 Open Access Article
Zero-strain strategy incorporating TaC with Ta2O5 to enhance its rate capacity for long-term lithium storage†
Yinhong
Gao
,
Xu
Nan
,
Bing
Sun
,
Wenli
Xu
,
Qiang
Huang
,
Ye
Cong
,
Yanjun
Li
 ,
Xuanke
Li
* and
Qin
Zhang
 *
*
Hubei Province Key Laboratory of Coal Conversion and New Carbon Materials, Wuhan University of Science and Technology, Wuhan, 430081, China. E-mail: zhangqin627@wust.edu.cn; lixuanke@wust.edu.cn
First published on 28th December 2022
Abstract
Ta2O5 holds great potential for lithium storage due to its high theoretical capacity and long-life cycling. However, it still suffers from an unsatisfactory rate capability because of its low conductivity and significant volume expansion during the charging/discharging process. In this study, a zero-strain strategy was developed to composite Ta2O5 with zero-strain TaC as an anode for lithium-ion batteries (LIBs). The zero-strain TaC, featuring negligible lattice expansion, can alleviate the volume variation of Ta2O5 when cycling, thereby enhancing the rate capacity and long-term cycling stability of the whole electrode. Further, the formation of a heterostructure between Ta2O5 and TaC was confirmed, giving rise to an enhancement in the electrical conductivity and structural stability. As expected, this anode displayed a reversible specific capacity of 395.5 mA h g−1 at 0.5 A g−1 after 500 cycles. Even at an ultrahigh current density of 10 A g−1, the Ta2O5/TaC anode delivered a high capacity of 144 mA h g−1 and superior durability with a low-capacity decay rate of 0.08% per cycle after 1000 cycles. This zero-strain strategy provides a promising avenue for the rational design of anodes, sequentially contributing to the development of high-rate capacity and long cycling LIBs.
Introduction
The global energy crisis and increasing concerns about environmental pollution are driving the exploration of clean sustainable energy, which has also triggered a new upsurge in the study of energy-storage systems,1,2 particularly rechargeable lithium-ion batteries (LIBs). LIBs possess the merits of high energy density, high power density, good safety, and environmental friendliness.3–6 However, there is an urgent need for high-rate, fast-charging, and long-cycling LIBs to meet the rising demands of portable electronic devices and electric vehicles.7,8 To date, commercial graphite anodes tend to be low-cost and eco-friendly but suffer from a very limited theoretical capacity (372 mA h g−1). Furthermore, the formation of irreversible Li dendrites in the graphite anode can result in safety issues at a low operating potential (∼0.1 V vs. Li/Li+) and high current density.9–12 Therefore, graphite anodes fail to satisfy the high requirements for next-generation LIBs. As such, an alternative anode is desired for LIBs that can meet the demands for long-term cycling, fast charging, and good safety.Tantalum-based compounds have aroused enormous interest, particularly as electrodes for energy-related applications, owing to their natural abundance, and superior chemical and thermal stability, as well as for having an open matrix accessible to alkali metal ions.13,14 Among such compounds, tantalum pentoxide (Ta2O5), despite its large atomic mass, reportedly furnished a high theoretical capacity of 482 mA h g−1 through a partial conversion mechanism.14,15 Hence, it has long been a decent choice for a LIB anode. Recently, Ta2O5 was reported to possess an extrinsic pseudo-capacitance property and has shown great potential for fast-charging LIBs.16,17 For instance, Xia et al.18 proposed a three-dimensional (3D) Ta2O5 electrode and achieved a stable capacity of 205 mA h g−1 at 5C (2410 mA g−1). Ta2O5 aerogels prepared by Pan et al.19 presented an outstanding rate capability of 97.0 mA h g−1 at a current density of 5 A g−1. However, its poor conductivity and the large and repeating volume variations during the charging/discharging process hinder Ta2O5 from demonstrating a high-rate performance. To overcome the above issues, constructing a heterostructure has been verified to be an efficient strategy for optimizing the electrochemical performance of materials.20–23 The generation of an internal electric field between different components can facilitate charge transfer, and greatly elevate the electrical and ionic conductivities, thereby contributing to a superior rate capability and cycle life of the electrode materials.24,25
Herein, we propose a zero-strain strategy involving constructing Ta2O5 with zero-strain TaC to form a Ta2O5/TaC heterostructure. The Ta2O5/TaC heterostructure was fabricated via a reflux polymerization and solvothermal precipitation process, followed by a partial reduction of Ta2O5 to generate TaC. TaC with a high elastic modulus (537 GPa) was inferred to feature a zero-strain property,26 which was further confirmed by the ex situ and in situ X-ray diffraction (XRD) patterns. Such a zero-strain and conductive TaC alleviated the large volume expansion of the whole electrode during the lithiation/delithiation process. The heterostructure possessed abundant active sites, enhanced electrical conductivity and structural stability, and reduced diffusion barrier of Li ions. Furthermore, the Ta2O5/TaC heterostructure also demonstrated typical faradaic pseudo-capacitance characteristics, ensuring a high-rate capacity and long cycling performance. As expected, this anode displayed a high reversible specific capacity of 395.5 mA h g−1 at 0.5 A g−1 after 500 cycles. Even at an ultrahigh current density of 10 A g−1, the Ta2O5/TaC anode presented a high capacity of 144 mA h g−1 and superior durability with a low-capacity decay rate of 0.08% per cycle after 1000 cycles. This study highlights the significance of the zero-strain strategy for boosting the high-rate capability and provides invaluable guidance for designing advanced anodes towards next-generation high-power LIBs.
Experimental
Materials synthesis
All the chemical reagents used in this work were of analytical grade and used without further purification. Based on a reported method with a slight modification,27 in a typical synthesis, 3 mM TaCl5 and 0.15 mM phenolic resin (PF) were dissolved in a mixed solvent of 40 mL ethanol and 10 mL acetylacetone under magnetic stirring, and then refluxed at 80 °C for 2 h to generate the yellow liquid polymer precursor. After that, the yellow solution was transferred into a steel autoclave and treated at 200 °C for 3 h. After cooling to ambient temperature, the resultant yellow precipitates were collected through centrifugation, washed with ethanol several times, and dried at 80 °C overnight. Finally, the above yellow precipitates were transferred into a furnace, and the temperature was increased to the optimized value of 1100 °C, 1200 °C, or 1400 °C (10 °C min−1), and maintained at the specified temperature for 1 h annealing under an argon-protecting environment to obtain the desired Ta2O5, Ta2O5/TaC, and TaC respectively.Materials characterizations
The crystallographic phases of all the as-obtained samples were investigated by X-ray diffraction (XRD; Bruker D8 Advance) equipped with Cu Kα radiation, λ = 1.542 Å. The scanning rate and scanning step size were 5° min−1 and 0.033°, respectively. In situ XRD tests were also performed on the Bruker D8 Advance X-ray diffractometer. The in situ cell employed Be foil as an X-ray penetrator window. The corresponding Li+ insertion/extraction potential ranged from 0.01 V to 3 V vs. Li/Li+ during the initial two cycles at a current density of 50 mA g−1. The in situ XRD patterns of Ta2O5/TaC were collected in the two-theta region between 20° and 60° with a step size of 0.02° and a scanning speed of 0.07° s−1. The morphology and structure of products were characterized by scanning electron microscopy (SEM, JSM-7610F PLUS) and transmission electron microscopy (TEM, JEM-2100UHR). The surface chemical states of the products were investigated by X-ray photoelectron spectroscopy (XPS, Thermo Fischer, ESCALAB 250Xi).Electrochemical measurements
The electrochemical tests were conducted in a CR2016 coin-type cells configuration. The electrodes were prepared by blending the active materials with Super P and polyvinylidene fluoride (PVDF) binder, in a mass ratio of 6![[thin space (1/6-em)]](https://www.rsc.org/images/entities/char_2009.gif) :
:![[thin space (1/6-em)]](https://www.rsc.org/images/entities/char_2009.gif) 3
3![[thin space (1/6-em)]](https://www.rsc.org/images/entities/char_2009.gif) :
:![[thin space (1/6-em)]](https://www.rsc.org/images/entities/char_2009.gif) 1, respectively, together with N-methyl-2-pyrrolidone (NMP) as the blending solvent. The resulting slurry was spread on Cu foil as a current collector, followed by drying in a vacuum oven at 80 °C overnight. The coin cells were assembled in an Ar-filled glovebox with O2 and H2O concentrations less than 0.1 ppm. A lithium pellet acted as the counter and reference electrodes. The employed electrolyte was 1 M LiPF6 in a mixture of ethylene carbonate (EC) and dimethyl carbonate (DEC) with a volume ratio (v/v) of 1
1, respectively, together with N-methyl-2-pyrrolidone (NMP) as the blending solvent. The resulting slurry was spread on Cu foil as a current collector, followed by drying in a vacuum oven at 80 °C overnight. The coin cells were assembled in an Ar-filled glovebox with O2 and H2O concentrations less than 0.1 ppm. A lithium pellet acted as the counter and reference electrodes. The employed electrolyte was 1 M LiPF6 in a mixture of ethylene carbonate (EC) and dimethyl carbonate (DEC) with a volume ratio (v/v) of 1![[thin space (1/6-em)]](https://www.rsc.org/images/entities/char_2009.gif) :
:![[thin space (1/6-em)]](https://www.rsc.org/images/entities/char_2009.gif) 1 (DoDoChem, 99.9%), and with 5 wt% fluoroethylene carbonate (FEC) additive. Galvanostatic charge/discharge measurements were performed at 25 °C on a LAND battery testing system. Galvanostatic intermittent titration technique (GITT) tests were conducted by charge/discharge at 0.1C with a current pulse duration of 10 min and an interval time of 20 min. Cyclic voltammetry (CV) and electrochemical impedance spectra (EIS, with a frequency range of 100 kHz to 0.01 Hz) were measured on a CHI660D electrochemical workstation (Chenhua Inc., Shanghai, China). The CV profiles were recorded in the potential range from 0.005 to 3.0 V with various scan speeds (0.2–3 mV s−1).
1 (DoDoChem, 99.9%), and with 5 wt% fluoroethylene carbonate (FEC) additive. Galvanostatic charge/discharge measurements were performed at 25 °C on a LAND battery testing system. Galvanostatic intermittent titration technique (GITT) tests were conducted by charge/discharge at 0.1C with a current pulse duration of 10 min and an interval time of 20 min. Cyclic voltammetry (CV) and electrochemical impedance spectra (EIS, with a frequency range of 100 kHz to 0.01 Hz) were measured on a CHI660D electrochemical workstation (Chenhua Inc., Shanghai, China). The CV profiles were recorded in the potential range from 0.005 to 3.0 V with various scan speeds (0.2–3 mV s−1).
Results and discussion
To better present the zero-strain strategy, Scheme 1 manifests the structural evolution of the pure Ta2O5 and Ta2O5/TaC anode in the Li+-storage process. The Ta2O5 stores the Li+ ions by means of the typical intercalation and conversion reaction mechanism during the lithiation process. When the Li+ ions insert into pure Ta2O5, it leads to a lattice expansion of Ta2O5. Followed by the formation of TaO, it then suffers from significant pulverization, thus giving rise to capacity attenuation of the electrode. As for TaC, it followed a solid–solution mechanism, demonstrating negligible volume change. For the Ta2O5/TaC heterostructure, even when experiencing the repeated charging/discharging process, Ta2O5 and its reduction products could be confined in a limited space by the zero-strain TaC. Thus, the structural integrity of the whole Ta2O5/TaC electrode could be maintained, which would guarantee the long-term cycling stability and high-rate capacity.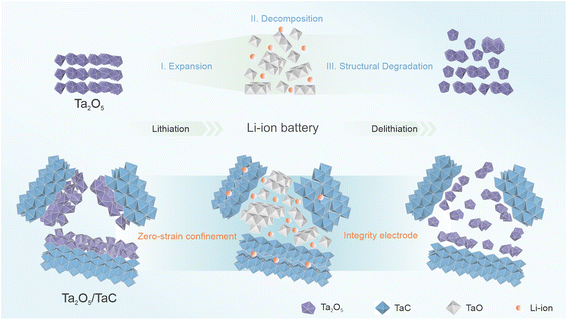 | ||
| Scheme 1 Illustration of the reaction mechanism during the initial lithiation/delithiation of the pure Ta2O5 and Ta2O5/TaC anode. | ||
The Ta2O5/TaC heterostructure was fabricated through a reflux polymerization, convenient solvothermal co-precipitation, and post-heat treatment carbonization. The experimental conditions and processes are described in detail in the Experimental section. Primarily, polycondensation between phenolic resin (PF) and Ta5+ took place to form an organic liquid precursor. This could be expected to promote the uniform mixing of tantalum and carbon sources, and prevent the agglomeration of metal compounds during the following carbonization process. Subsequently, the dispersed inorganic hybrid intermediate (amorphous Ta2O5@PF hybrid) was obtained by the solvothermal reaction. Finally, the partial carbonization of the Ta2O5@PF hybrid gave rise to the in situ formation of the Ta2O5/TaC anode. XRD characterization was employed to investigate the components of the solvothermal intermediate and the findings are presented in Fig. S1a.† The two broad peaks located at 26° and 55° indicated the formation of amorphous Ta2O5 nanospheres.28 The field-emission scanning electron microscopy (FESEM) image in Fig. S1b† shows the uniformly dispersed nanosphere structure of Ta2O5@PF with a smooth surface.
We utilized FESEM, high-resolution transmission electron microscopy (HRTEM), and energy dispersive spectrometry (EDS) to characterize the crystal structure, heterointerface, and chemical composition of the synthesized Ta2O5/TaC composite (Fig. 1). Fig. 1a presents the morphology of the as-prepared Ta2O5/TaC. Compared with pure Ta2O5 and TaC (Fig S2a and d†), the Ta2O5/TaC nanoparticles displayed the smallest average particle size, which was measured to be about 80 nm (Fig. 1b), which would be conducive to a shorter ion-diffusion path. However, pure TaC exhibited the largest particle size, due to agglomeration at high temperatures. The microstructure of Ta2O5, Ta2O5/TaC, and TaC were further investigated by transmission electron microscopy (TEM), as shown in Fig. 1c and S2b and e,† respectively. The HRTEM image displayed the clear lattice fringes of Ta2O5 and TaC (Fig. 1d). The interplanar spacing (highlighted in yellow) was measured to be 0.31 nm, which was identified as the (1110) plane of Ta2O5. The lattice fringes with a d-spacing of 0.22 nm (marked in red) corresponded to the (200) crystalline plane of cubic phase TaC.28,29 A clear heterointerface between Ta2O5 and TaC could be observed in Fig. 1d (marked in yellow dotted lines). Nonetheless, in the HRTEM image of Ta2O5 (Fig. S2c†) and TaC (Fig. S2f†), only typical lattice fringes of the single oxide and carbide phases could be recognized, respectively. Moreover, the EDS mapping images of Ta2O5/TaC revealed the uniform distribution of Ta, C, and O elements in the composite, as presented in Fig. 1e.
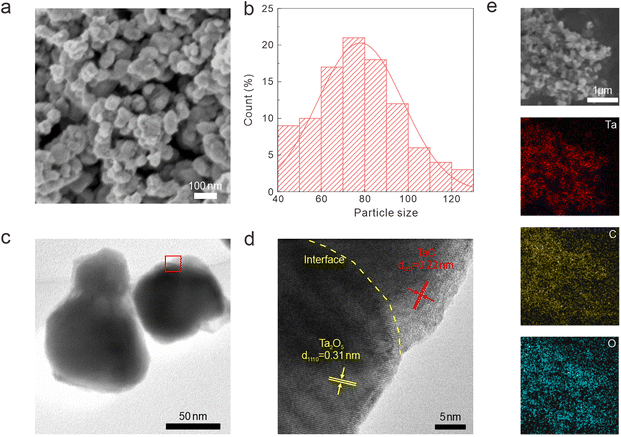 | ||
| Fig. 1 Morphology characterization of the Ta2O5/TaC nanoparticles. (a) FESEM images. (b) Particle size distribution. (c) TEM image. (d) HRTEM image. (e) EDS mapping images. | ||
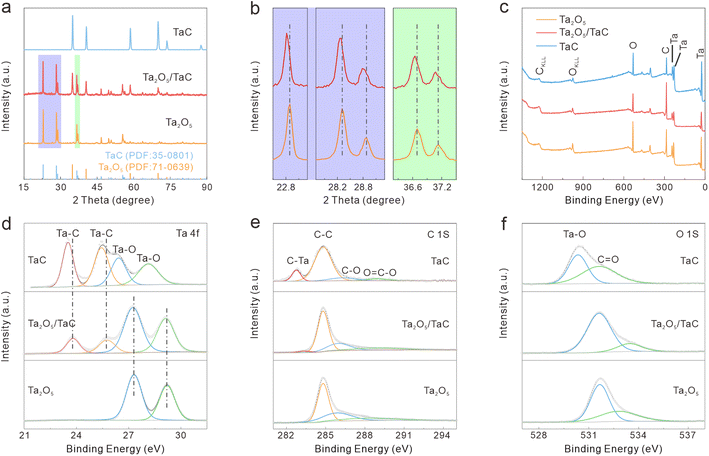
XRD was conducted to further confirm the structural constitution and crystalline phase. For comparison, pure Ta2O5 and TaC synthesized via the same route served as the contrast samples. The XRD patterns of Ta2O5, TaC, and Ta2O5/TaC are shown in Fig. 2a. The main peaks were located at 22.8°, 28.2°, 28.7°, 36.6°, 37.1°, 46.6°, 49.7°, 50.6°, and 55.7° and were assigned to the (001), (1110), (200), (1111), (201), (002), (0220), (3110), and (1112) lattice planes of Ta2O5, respectively. The peaks at 34.9°, 40.5°, 58.6°, 70.0°, and 73.6° were indexed to the (111), (200), (220), (311), and (222) lattice planes of TaC. Clearly, the obtained XRD patterns matched well with the standard patterns of rhomboidal Ta2O5 (PDF: 71-0639) and cubic TaC (Fm![[3 with combining macron]](https://www.rsc.org/images/entities/char_0033_0304.gif) m) (PDF: 35-0801). According to the zoom-in regions shown in Fig. 2b, the (001), (1110), (200), (1111), and (201) planes of Ta2O5 in Ta2O5/TaC were slightly shifted to a lower diffraction angle in comparison with the bare Ta2O5. This phenomenon indicated the synergistic effect between Ta2O5 and TaC, confirming the formation of the Ta2O5/TaC heterostructure. Then, a Rietveld-refined XRD pattern was applied to Ta2O5/TaC and the results are displayed in Fig. S3.† The small residual of 1.34% revealed that the calculated curve matched well with the experimental result.30 Also, the refinement result manifested the good crystallinity of the Ta2O5/TaC composite. Moreover, the contents of Ta2O5 and TaC were calculated to be 67.4% and 32.6%, respectively. According to the results, the unit-cell volume of Ta2O5 was calculated to be 977.9 nm3, while the value was 88.4 nm3 for TaC. The unit-cell volume of Ta2O5 in Ta2O5/TaC was larger than for pure Ta2O5 (970.9 nm3).
m) (PDF: 35-0801). According to the zoom-in regions shown in Fig. 2b, the (001), (1110), (200), (1111), and (201) planes of Ta2O5 in Ta2O5/TaC were slightly shifted to a lower diffraction angle in comparison with the bare Ta2O5. This phenomenon indicated the synergistic effect between Ta2O5 and TaC, confirming the formation of the Ta2O5/TaC heterostructure. Then, a Rietveld-refined XRD pattern was applied to Ta2O5/TaC and the results are displayed in Fig. S3.† The small residual of 1.34% revealed that the calculated curve matched well with the experimental result.30 Also, the refinement result manifested the good crystallinity of the Ta2O5/TaC composite. Moreover, the contents of Ta2O5 and TaC were calculated to be 67.4% and 32.6%, respectively. According to the results, the unit-cell volume of Ta2O5 was calculated to be 977.9 nm3, while the value was 88.4 nm3 for TaC. The unit-cell volume of Ta2O5 in Ta2O5/TaC was larger than for pure Ta2O5 (970.9 nm3).
The surface electronic states and compositions of Ta2O5, Ta2O5/TaC, and TaC were further probed by X-ray photoelectron spectroscopy (XPS), as presented in Fig. 2c. Five distinct peaks were noted at 26.4, 230.7, 243.3, 285.1, and 531.3 eV, which belonged to Ta 4f, Ta 4d5/2, Ta 4d3/2, C 1s, and O 1s, respectively. The high-resolution Ta 4f spectra of the three samples are shown in Fig. 2d. The Ta 4f spectrum of Ta2O5 could only be fitted into the Ta–O 4f7/2 (27.3 eV) and Ta–O 4f5/2 (29.2 eV) states. As for Ta2O5/TaC, there were four well-resolved peaks corresponding to the Ta–C bond in TaC (23.8 eV and 25.7 eV for Ta 4f7/2 and Ta 4f5/2, respectively) and the Ta–O bond in Ta2O5 (27.2 eV and 29.1 eV for 4f7/2 and 4f5/2, respectively).26,31 For the pure TaC, the peaks located at 26.4 and 28.1 eV could be ascribed to the Ta–O bond, resulting from the natural oxidation of carbide during air exposure. Also, another two peaks at 23.5 and 25.4 eV were associated with Ta 4f7/2 and Ta 4f5/2 for TaC. The Ta–C peaks in the Ta2O5/TaC composite were shifted to higher binding energy compared with TaC, indicating the strong electronic interactions between Ta2O5 and TaC. In comparison with the pure Ta2O5, the Ta–O peak was shifted to a lower binding energy, further suggesting the existence of the Ta2O5/TaC heterostructure. The deconvolution peak located at 283.3 eV in the C 1s spectrum of Ta2O5/TaC was ascribed to the C–Ta bond and further confirmed the formation of TaC (Fig. 2e). Moreover, the peak intensity of C–Ta (282.7 eV) in the C 1s of TaC was higher and sharper than that of Ta2O5/TaC. The O 1s state of Ta2O5/TaC showed two typical peaks originating from the O![[double bond, length as m-dash]](https://www.rsc.org/images/entities/char_e001.gif) C and O–Ta bonds, located at 533.3 and 531.6 eV, respectively (Fig. 2f). In accordance with the XRD results, the XPS analysis indicated that the Ta2O5/TaC heterostructure was successfully synthesized.
C and O–Ta bonds, located at 533.3 and 531.6 eV, respectively (Fig. 2f). In accordance with the XRD results, the XPS analysis indicated that the Ta2O5/TaC heterostructure was successfully synthesized.
Then, the electrochemical performances of these samples were evaluated for use as anode materials for LIBs. Fig. S4† shows the first five cyclic voltammogram of the Ta2O5, Ta2O5/TaC, and TaC anodes in the potential range from 3.0 to 0.005 V at a scan rate of 0.2 mV s−1. As shown in Fig. S4b,† the irreversible cathodic peaks of the Ta2O5/TaC anode appearing at 0.36 V and 0.67 V in the first cycle were derived from the side reactions with the electrolyte and the generation of a solid–electrolyte interphase layer (SEI),32 which was not fully recovered in the subsequent anodic sweep. The following four cycles demonstrated a higher overlap ratio than that of Ta2O5, indicating the outstanding reversibility and cycle stability of Li+ insertion/extraction in the Ta2O5/TaC anode. Additionally, a pair of broad peaks at ∼0.75/0.8 V was noted, corresponding to the reversible phase transition of the Ta2O5/TaC anode. In the following four cycles, the intensity of the oxidation peaks continued to increase, indicating that more active components were involved in the delithiation reaction.33 Note that the curves of the following four circles of TaC basically overlapped, and showed the minimum potential difference (ϕp) of the redox process, indicating its better cycle stability than that of the Ta2O5 anode.34 The ϕp value of Ta2O5/TaC was intermediate between Ta2O5 and TaC, revealing that the introduction of zero-strain TaC facilitated the reversibility of the whole electrode. Fig. S5† presents the galvanostatic charge/discharge profiles of the Ta2O5/TaC anode in the 1st, 2nd, and 10th cycles at a current density of 0.5 A g−1. It could be seen in the first cycle that an irreversible capacity loss was mainly caused by the formation of SEI layers,23 which was in accordance with the CV result. The plateaus of the discharge–charge characteristics matched well with the CV profiles.
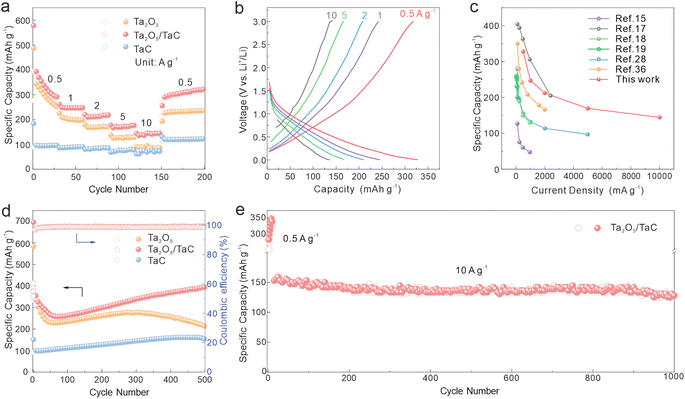
Fig. 3a shows the rate performances of Ta2O5/TaC, Ta2O5, and TaC at varying current densities from 0.5 to 10 A g−1. The Ta2O5/TaC anode displayed higher discharge capacities of 328.6, 247, 212.2, 169.3, and 144.4 mA h g−1 at differing current densities, higher than those of Ta2O5 (124.9 mA h g−1 at 5 A g−1 and 86.1 mA h g−1 10 A g−1). When the current density suddenly switched back to 0.5 A g−1, a discharge specific capacity of 301.3 mA h g−1 could still be recovered in Ta2O5/TaC, indicating its high reversibility and excellent Li+-diffusion kinetics. Furthermore, both Ta2O5/TaC and TaC exhibited enhanced capacity retention rates at higher current rates. Compared with the rate performance at 0.5 A g−1, the capacity retention rates of Ta2O5/TaC and TaC at 10 A g−1 were 43.9% and 78.8%, respectively, while the corresponding value for Ta2O5 was only 29.3%. One can draw a conclusion that TaC was conducive to realizing the excellent rate capability of the Ta2O5/TaC anode. Fig. 3b shows the galvanostatic charge–discharge profiles at current densities from 0.5 to 10 A g−1. The absence of the plateau region in these curves suggested a capacitive Li+-storage behaviour of the Ta2O5/TaC anode.35 To highlight the impressive lithium storage performance of Ta2O5/TaC, the performances of the reported Ta2O5 anodes are listed in Fig. 3c.15,17–19,28,36 As shown, the Ta2O5/TaC anode manifested superior electrochemical performance, especially at higher cycling rates.
We also evaluated the cycling performances of Ta2O5, Ta2O5/TaC, and TaC electrodes at a current density of 0.5 A g−1 and the results are displayed in Fig. 3d. The reversible capacity of Ta2O5/TaC remained at 395.5 mA h g−1 even after 500 cycles. In contrast, the Ta2O5 and TaC anodes showed unsatisfactory capacities of 212.8 and 152.8 mA h g−1, respectively. This revealed that the Ta2O5/TaC anode had preferable cycling stability compared with the bare Ta2O5 anode. The long-term stability of the Ta2O5/TaC electrode was first activated at 0.5 A g−1 for 10 cycles and was further measured under an ultrahigh current density of 10 A g−1 (Fig. 3e). The reversible capacity of Ta2O5/TaC remained as high as 127.8 mA h g−1 even after 1000 cycles with a low-capacity decay rate of 0.08% per cycle.
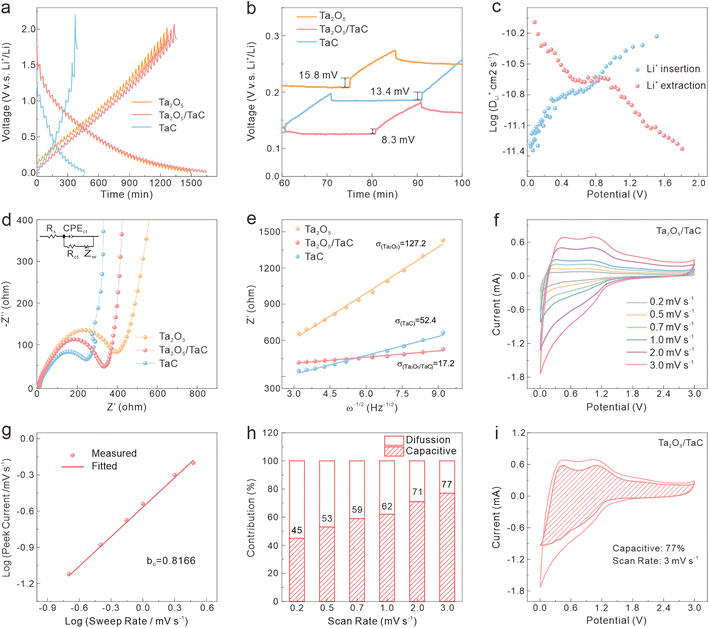
To further study the kinetic process of the Ta2O5/TaC anode, the lithium-ion diffusivity was evaluated by the galvanostatic intermittent titration technique (GITT). Fig. 4a presents the GITT curves for Ta2O5, Ta2O5/TaC, and TaC, and the zoom-in regions are shown in Fig. 4b. The Ta2O5/TaC anode presented the lowest voltage difference of 8.3 mV during the Li+ lithiation/delithiation process, while the values were 15.8 mV for Ta2O5 and 13.4 mV for TaC. This indicated that lower polarization occurred in the Ta2O5/TaC anode.37 The corresponding diffusion coefficient (D1Li) could be calculated by Fick's second law with eqn (1),38
 | (1) |
 | (2) |
As exhibited in Fig. 4c, the average D1Li values of Ta2O5/TaC towards Li+ insertion and extraction were 1.64 × 10⁻¹¹ and 2.26 × 10⁻¹¹, respectively (Table S1†). Both values were higher than those of Ta2O5 (9.54 × 10⁻¹² and 1.38 × 10⁻¹¹) and TaC (1.61 × 10⁻¹¹ and 2.05 × 10⁻¹¹) in Table S1 and Fig. S6.† This indicated a faster interface kinetics and efficient lithium-ion insertion/desertion, further implying a higher rate capability of Ta2O5/TaC for LIBs.22
The electrochemical impedance spectra (EIS) were adapted to clearly understand the dynamic behaviour and further verify the synergistic effect between Ta2O5 and TaC. The Nyquist profiles at an open-circuit potential before cycling are shown in Fig. 4d. Ta2O5, Ta2O5/TaC, and TaC possessed similar resistance profiles, with the semicircle in the high-frequency regions corresponding to the charge-transfer resistance (Rct), and the sloping line in the low-frequency region related to the solid-state Li-ion mass-transfer process.39 The solution resistance (Rs) and Rct of Ta2O5/TaC were calculated to be 3.7 and 351.8 Ω, respectively, according to the simulated equivalent circuit model (Table S2†). The Rct of Ta2O5/TaC was higher than that of the TaC anode (255.4 Ω). Meanwhile, the Ta2O5 electrode presented the largest Rct (400 Ω). This confirmed that the introduction of highly conductive TaC significantly improved the conductivity and led to a synergistic enhancement of the interfacial kinetics, thus boosting the rate performance. After that, the D2Li of all electrodes could be deduced via the linear relationship between the real part of the impedance (Z′) and the reciprocal square root of the angular frequency (ω−1/2) in the low-frequency region (Z′ = σω−1/2, where σ is Warburg parameter),40 as depicted in Fig. 4e. According to the equation D2Li = R2T2/2A2n4F4C2σ2,23 the D2Li of Ta2O5/TaC was calculated to be 54.7 and 9.3 times higher than that of Ta2O5 and TaC, respectively. This is consistent with the GITT results described above. Therefore, we could conclude that the Ta2O5/TaC composite exhibited enhanced Li+-diffusion kinetics due to the interaction between Ta2O5 and the highly conductive TaC. Fig. S7† shows the Nyquist plots of the Ta2O5/TaC composite before and after cycling. It could be observed that the impedance value gradually decreased with the increasing cycles, manifesting the reduction of electrode polarization and successive activation of Ta2O5/TaC in the cycling process.
The CV measurements of the Ta2O5/TaC electrode under scanning speeds ranging from 0.2 to 3 mV s−1 were carried out and the results are shown in Fig. 4f. Both the cathodic and anodic peak currents (i) increased with the elevated scan rates (v), owing to the capacitive effect on the electrode materials under the fast Li+ charge/discharge process.37 The contribution of the pseudocapacitive (k1v) and diffusion-controlled (k2v1/2) process were analyzed based on the following equation: i = k1v + k2v1/2 = avb (where k1, k2, and a are constants; and b is an adjustable parameter). The b value (anodic peak) of Ta2O5/TaC (Fig. 4g) was calculated to be 0.8166, demonstrating the superior Li+-storage behaviour stemming from the combination of a diffusion-controlled and capacitive process.12,19 In Fig. 4h, the pseudocapacitive contribution of the Ta2O5/TaC anode increased with the sweep rate. This exhibits a pseudocapacitive capacity of 77% at a scanning rate of 3 mV s−1 (Fig. 4i). This pseudocapacitive behaviour enabled the Ta2O5/TaC anode to realize rapid charge transport and enhanced rate performance. The kinetics analysis demonstrated the synergistic effect between Ta2O5 and TaC to ensure an outstanding rate performance of the Ta2O5/TaC anode, by accelerating both electron and Li-ion transportation.
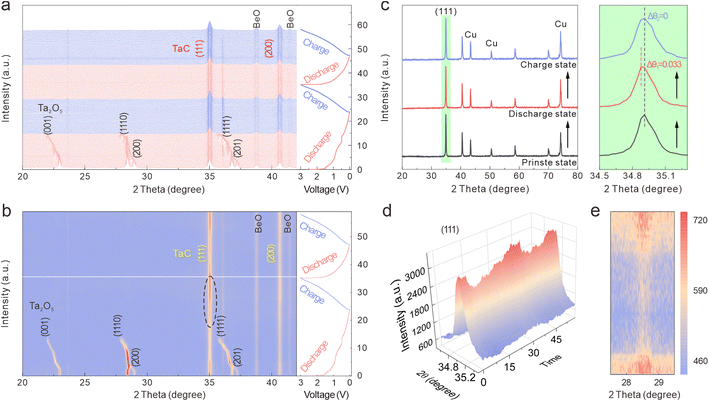
In situ XRD tests were conducted to explore the electrochemical reaction mechanism and the crystal-structure evolution of the Ta2O5/TaC anode during cycling. The in situ XRD patterns and contour map related to the time–voltage profiles between 3 and 0.01 V during the first two cycles at 50 mA g−1 are shown in Fig. 5a and b. From the contour plots, we proposed a three-stage transition for the Ta2O5/TaC electrode during the first discharging procedure. In the first stage (marked as I1), the potential dropped rapidly from an open-circuit voltage to 1.6 V. When initially discharged to 1 V, the (001), (1110), (200), (1111), and (201) crystallographic planes of Ta2O5 gradually shifted to lower angles, due to the lattice expansion caused by Li+ intercalation.41
When further discharged to 0.88 V (the second stage, I2), the intensity of these two peaks of TaC gradually decreased and then recovered to the original intensity after being completely charged (Fig. 5d and S8a†). From the enlarged (111) peaks of the TaC electrode, no obvious intensity change could be observed during the cycle. As for TaC, neither the (111) nor (200) diffraction peaks showed evident shifts during the charge–discharge process. This indicated that the TaC stored the Li ions via a solid–solution reaction, with the crystal transformation highly reversible.42 To further confirm this solid–solution transition characteristic of the TaC anode, ex situ XRD patterns were obtained and are shown in Fig. 5c. The XRD patterns of the TaC anode almost remained unchanged at different stages, with no advent of new peaks or vanishing of the original peaks. The solid–solution type TaC demonstrated negligible lattice distortion and strain during the charge/discharge process, thereby continuously enabling the Li+ ions to realize the fast-charging application. Moreover, by virtue of Rietveld refining of the XRD patterns of TaC, the alterations of the lattice parameters and volume are presented in Fig. S8b.† The refinement results showed that the initial lattice parameters were a = b = c = 4.445 Å (Fig. S9†). After the first full discharge process, the unit-cell volume of TaC varied from 88.41 to 88.62 Å3, with a total volume expansion of only 0.24%. This value was less than 1%, verifying that TaC was a zero-strain insertion material.43 Significantly, the evolution of the lattice parameters and volume in the second cycle almost held constant, verifying the excellent structural stability and reversibility of TaC. Here, TaC with negligible lattice distortion could confine Ta2O5 in a very limited region, thus giving rise to an enhanced cycling life of the whole anode. Furthermore, given the small volume change during cycling, the decomposition and structural damage of the SEI layer could be mitigated to some degree.
Subsequently, all the peak intensities of Ta2O5 gradually reduced with decreasing the potential and then disappeared at ∼0.34 V (the third stage, I3). This was likely due to the structural damage and reduced crystallinity of Ta2O5. In the contour plot in the range of 27.5–29.5° during the second cycle (Fig. 5e), when charging to 3 V, the Ta2O5 phase appeared again. This phenomenon proved the reversible reaction of Ta2O5 with Li+. As shown in Fig. 5b and d and S8a,† the peaks at 34.9° and 40.5° belonged to the (111) and (200) planes of TaO (PDF: 89-4772), respectively. The intensity of these two peaks continuously increased when discharging to 0.34 V, then decreased in the subsequent charging process, due to the conversion of Ta2O5 to TaO.18 Therefore, the electrochemical Li+ insertion/extraction mechanism of Ta2O5/TaC can be described by eqn (3) and (4):
| TaC + xe− + xLi+ ↔ LixTaC | (3) |
| Ta2O5 + 3e− + 3Li+ ↔ 2TaO + 3LiO | (4) |
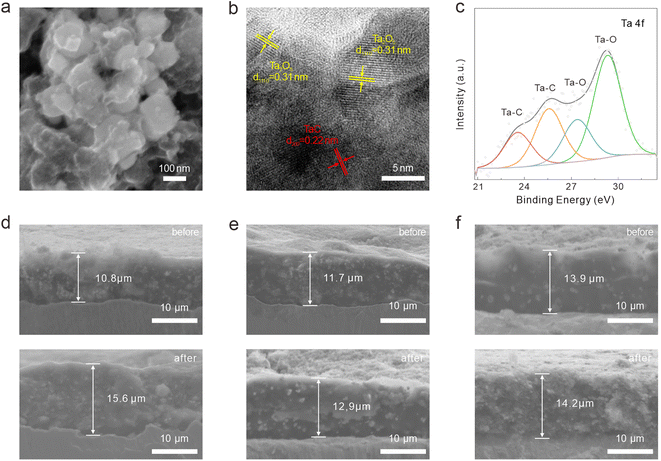
The morphology evolution of the Ta2O5/TaC electrode was explored after cycling for 50 times at a current density of 0.5 A g−1 is shown in Fig. S10a† and 6a. The electrode still showed an intact surface and the Ta2O5/TaC nanoparticles could be well preserved, verifying the structural stability induced by the zero-strain strategy. Besides, the TEM image also confirmed the structural stability of Ta2O5/TaC (Fig. S10b†). When the Ta2O5/TaC electrode returned to a fully charged state after 50 cycles, the lattice fringes for Ta2O5 (1110) and TaC (200) could observed in the HRTEM image (Fig. 6b). The HRTEM image also indicated that TaC robustly maintained a monocrystalline phase, while on the contrary, Ta2O5 cracked into polycrystalline from the original single-crystal phase. The robust TaC structure allowed the volume expansion of the inner Ta2O5, thereby maintaining the integrity of the whole electrode. Additionally, the phase compositions of the Ta2O5/TaC electrode after being charged to 3 V were investigated by XPS (Fig. 6c, and S10c–f†). The high-resolution Ta 4f spectrum could be resolved into four distinguishable peaks, assigned to the Ta–C bond in TaC (23.6 and 25.6 eV) and Ta–O bond in Ta2O5 (27.4 and 29.3 eV), respectively. In comparison with the high-resolution C 1s spectra of Ta2O5/TaC before and after cycling, the intensity of the O![[double bond, length as m-dash]](https://www.rsc.org/images/entities/char_e001.gif) C–O peak was stronger after cycling (Fig. S10c†). The Ta–O bond for Ta2O5 (531.8 eV) could also be clearly observed in the spectrum of O 1s (Fig. S10d†). The only peak located at 55.4 eV was ascribed to the Li–O state of Li2O (Fig. S10e†). The above results confirmed the reversibility of the reaction and the integrity of the electrode before and after cycling. To further demonstrate the structural effect of zero-strain TaC, the cross-sectional SEM was employed to compare the thickness of the electrodes before and after cycling, as shown in Fig. 6d–f. After 50 cycles, the increase in thickness of the Ta2O5/TaC electrode (10%) was significantly reduced relative to the pure Ta2O5 electrode (44%). Moreover, the TaC electrode exhibited minimal thickness variation of just 2%. These results demonstrated that the zero-strain TaC could reduce the electrode swelling.
C–O peak was stronger after cycling (Fig. S10c†). The Ta–O bond for Ta2O5 (531.8 eV) could also be clearly observed in the spectrum of O 1s (Fig. S10d†). The only peak located at 55.4 eV was ascribed to the Li–O state of Li2O (Fig. S10e†). The above results confirmed the reversibility of the reaction and the integrity of the electrode before and after cycling. To further demonstrate the structural effect of zero-strain TaC, the cross-sectional SEM was employed to compare the thickness of the electrodes before and after cycling, as shown in Fig. 6d–f. After 50 cycles, the increase in thickness of the Ta2O5/TaC electrode (10%) was significantly reduced relative to the pure Ta2O5 electrode (44%). Moreover, the TaC electrode exhibited minimal thickness variation of just 2%. These results demonstrated that the zero-strain TaC could reduce the electrode swelling.
Based on the above results, we can conclude that the enhanced electrochemical performance of the Ta2O5/TaC anode originated from the synergistic effect between the TaC and Ta2O5 during the charge/discharge process. First, the zero-strain and conductive TaC could boost the conductivity of the whole electrode, thereby reducing the diffusion barrier of Li+. Also, the zero-strain capacity enabled TaC to remit the volume expansion of Ta2O5 when cycling, which guaranteed the long-term cycling life of the Ta2O5/TaC anode. Second, the construction of heterostructure led to the formation of an implanted electric field and more delocalized charge transport on the interface. Then, the transport of charge carriers could be accelerated, ensuring the high-rate performance of the Ta2O5/TaC anode.
Conclusion
To sum up, a heterostructured Ta2O5/TaC anode was fabricated as a novel fast-charging anode for LIBs. A reversible solid–solution process and conversion reaction mechanism of the Ta2O5/TaC anode was revealed. The anode achieved a high rate and long-cycle performance. After 1000 cycles, the capacities of Ta2O5/TaC retained 127.8 mA h g−1 at an ultrahigh current density of 10 A g−1, with a low-capacity decay rate of 0.08% per cycle. This could be attributed to the zero-strain and high conductivity of TaC, which enhanced the Li+ transport and relieved the volume expansion during charge/discharge. The heterostructure between Ta2O5 and TaC accelerated the interfacial kinetics, and lowered the charge transfer energy barriers. Additionally, the intercalation–pseudocapacitive behaviour enabled Ta2O5/TaC anode to store additional energy and thus it delivered a high-rate capacity. We believe that these findings open a new avenue in the search for even better anode materials and will be help speed up the development of high-rate capacity LIBs for large-scale energy-storage systems.Author contributions
Yinhong Gao: conceptualization, investigation, data curation and writing-original draft & editing. Xu Nan: formal analysis, resources and software. Bing Sun: supervision and formal analysis. Wenli Xu: formal analysis. Qiang Huang: formal analysis. Ye Cong: conceptualization. Yanjun Li: conceptualization. Xuanke Li: project administration. Qin Zhang: validation, project administration and writing-review & editing.Conflicts of interest
There are no conflicts to declare.Acknowledgements
The research was supported by the National Natural Science Foundation of China (No. 51902232). The authors moreover thank Haotang Li for data analysis.Notes and references
- L. Zhai, W. Zhang, H. Gong, Y. Li, M. Gao, X. Zhang, D. Li, Y. Zhou, C. Dong, W. Liu, F. Jiang and J. Sun, Surf. Interfaces, 2022, 34, 102299 CrossRef CAS.
- T. Li, J. Sun, S. Gao, B. Xiao, J. Cheng, Y. Zhou, X. Sun, F. Jiang, Z. Yan and S. Xiong, Adv. Energy Mater., 2021, 11, 2003699 CrossRef CAS.
- T. Kim, W. Song, D. Y. Son, L. K. Ono and Y. Qi, J. Mater. Chem. A, 2019, 7, 2942–2964 RSC.
- V. P. H. Huy, S. So, I. T. Kim and J. Hur, Energy Storage Mater., 2021, 34, 669–681 CrossRef.
- Y. H. Gao, X. Nan, Y. Yang, B. Sun, W. L. Xu, D. L. D. Wandji, X. K. Li, Y. J. Li and Q. Zhang, New Carbon Mater., 2021, 36, 1–28 CrossRef.
- S. Gao, P. Ju, Z. Liu, L. Zhai, W. Liu, X. Zhang, Y. Zhou, C. Dong, F. Jiang and J. Sun, J. Energy Chem., 2022, 69, 356–362 CrossRef CAS.
- J. W. Choi and D. Aurbach, Nat. Rev. Mater., 2016, 1, 1–16 Search PubMed.
- N. Mahmood, T. Tang and Y. Hou, Adv. Energy Mater., 2016, 6, 1600374 CrossRef.
- J. Liu, D. Xie, X. Xu, L. Jiang, R. Si, W. Shi and P. Cheng, Nat. Commun., 2021, 12, 3131 CrossRef CAS PubMed.
- X. Zhang, L. Han, J. Li, T. Lu, J. Li, G. Zhu and L. Pan, J. Mater. Sci. Technol., 2022, 97, 156–164 CrossRef.
- K. Xu, X. Shen, C. Song, H. Chen, Y. Chen, Z. Ji, A. Yuan, X. Yang and L. Kong, Small, 2021, 17, 2101080 CrossRef CAS PubMed.
- X. Zhu, J. Xu, Y. Luo, Q. Fu, G. Liang, L. Luo, Y. Chen, C. Lin and X. Zhao, J. Mater. Chem. A, 2019, 7, 6522–6532 RSC.
- J. Ma, X. Guo, H. Xue, K. Pan, C. Liu and H. Pang, Chem. Eng. J., 2020, 380, 122428 CrossRef CAS.
- M. Sun, Y. Jiang, J. Ni and L. Li, J. Mater. Sci. Technol., 2018, 34, 1969–1976 CrossRef CAS.
- X. Geng, X. Huang, B. Zhong, Z. Liu, D. Wang and G. Wen, J. Alloys Compd., 2021, 881, 159920 CrossRef CAS.
- C. Choi, D. S. Ashby, D. M. Butts, R. H. DeBlock, Q. Wei, J. Lau and B. Dunn, Nat. Rev. Mater., 2020, 5, 5–19 CrossRef.
- K. N. Manukumar, B. Kishore, R. Viswanatha and G. Nagaraju, J. Solid State Electrochem., 2020, 24, 1067–1074 CrossRef CAS.
- S. Xia, J. Ni, S. V. Savilov and L. Li, Nano Energy, 2018, 45, 407–412 CrossRef CAS.
- L. Pan, H. Huang, T. Liu and M. Niederberger, Electrochim. Acta, 2019, 321, 134645 CrossRef CAS.
- J. Wu, R. Zhao, H. Xiang, C. Yang, W. Zhong, C. Zhang, Q. Zhang, X. Li and N. Yang, Appl. Catal., B, 2021, 292, 120200 CrossRef CAS.
- S. Chen, S. Huang, J. Hu, S. Fan, Y. Shang, M. E. Pam, X. Li, Y. Wang, T. Xu, Y. Shi and H. Y. Yang, Nano-Micro Lett., 2019, 11, 80 CrossRef CAS PubMed.
- S. Zhang, G. Wang, B. Wang, J. Wang, J. Bai and H. Wang, Adv. Funct. Mater., 2020, 30, 2001592 CrossRef CAS.
- C. Hou, J. Wang, W. Du, J. Wang, Y. Du, C. Liu, J. Zhang, H. Hou, F. Dang, L. Zhao and Z. Guo, J. Mater. Chem. A, 2019, 7, 13460–13472 RSC.
- S. Xiao, X. Li, T. Li, Y. Xiang and J. S. Chen, J. Mater. Chem. A, 2021, 9, 7317–7335 RSC.
- S. Xiao, X. Li, W. Zhang, Y. Xiang, T. Li, X. Niu, J. S. Chen and Q. Yan, ACS Nano, 2021, 15, 13307–13318 CrossRef CAS PubMed.
- L. Wang, F. Zhang, W. Dai, Q. Cheng, L. Lu, K. Zhang, M. Lin, M. Shen and D. Wang, J. Am. Ceram. Soc., 2019, 102, 6455–6462 CrossRef CAS.
- J. Jiang, S. Wang, W. Li and Z. Chen, Ceram. Int., 2016, 42, 7118–7124 CrossRef CAS.
- K. N. Manukumar, B. Kishore, K. Manjunath and G. Nagaraju, Int. J. Hydrogen Energy, 2018, 43, 18125–18135 CrossRef CAS.
- Z. W. Cui, X. K. Li, Y. Cong, Z. J. Dong, G. M. Yuan and J. Zhang, New Carbon Mater., 2017, 32, 205–212 CrossRef CAS.
- A. C. Larson and R. B. Von Dreele, Report lAUR, 1994, pp. 86–748 Search PubMed.
- C. Di, X. Yan, Y. Yang, W. Ye, M. Zhao and D. Li, Ceram. Int., 2021, 47, 32766–32774 CrossRef CAS.
- K. Manukumar, R. Viswanatha and G. Nagaraju, Ionics, 2020, 26, 1197–1202 CrossRef CAS.
- M. C. Zhao, J. Zhang, W. Wang and Qi Zhang, Nanotechnology, 2021, 32, 485404 CrossRef CAS PubMed.
- G. Luo, Y. Gu, Y. Liu, Z. Chen, Y. Huo, F. Wu, Y. Mai, X. Dai and Y. Deng, Ceram. Int., 2021, 47, 11332–11339 CrossRef CAS.
- J. Wu, X. Zhang, Z. Li, C. Yang, W. Zhong, W. Li, C. Zhang, N. Yang, Q. Zhang and X. Li, Adv. Funct. Mater., 2020, 30, 2004348 CrossRef CAS.
- S. Wang, T. Yao, B. Li, Y. Li and Y. Yang, Mater. Lett., 2020, 267, 127545 CrossRef CAS.
- Q. Wang, H. Yang, T. Meng, J. Yang, B. Huang, F. L. Gu, S. Zhang, C. Meng and Y. Tong, Energy Storage Mater., 2021, 36, 365–375 CrossRef.
- K. Chang, Z. Wang, G. Huang, H. Li, W. Chen and J. Y. Lee, J. Power Sources, 2012, 201, 259–266 CrossRef CAS.
- X. Li, Q. Xiao, H. Zhang, H. Xu and Y. Zhang, J. Energy Chem., 2018, 27, 940–948 CrossRef.
- Y. You, X. L. Wu, Y. X. Yin and Y. G. Guo, J. Mater. Chem. A, 2013, 1, 14061–14065 RSC.
- K. Lee, S. Shin, T. Degen, W. Lee and Y. S. Yoon, Nano Energy, 2017, 32, 397–407 CrossRef CAS.
- W. Zhang, D. H. Seo, T. Chen, L. Wu, M. Topsakal, Y. Zhu, D. Lu, G. Ceder and F. Wang, Science, 2020, 367, 1030–1034 CrossRef CAS PubMed.
- Y. S. Kim, Y. Cho, P. M. Nogales and S. K. Jeong, Energies, 2019, 12, 2960 CrossRef CAS.
Footnote |
| † Electronic supplementary information (ESI) available. See DOI: https://doi.org/10.1039/d2na00764a |
| This journal is © The Royal Society of Chemistry 2023 |

