 Open Access Article
Microfluidic static droplet generated quantum dot arrays as color conversion layers for full-color micro-LED displays†
Licai
Zhu
 ab,
Jin
Tao
*a,
Panyuan
Li
 ab,
Wenchao
Sun
 ab,
Jiwei
Li
ab,
KaiLi
Fan
ab,
Jinguang
Lv
a,
Yuxin
Qin
a,
Kaifeng
Zheng
a,
Baixuan
Zhao
a,
Yingze
Zhao
a,
Yupeng
Chen
a,
Yingwen
Tang
c,
Weibiao
Wang
a and
Jingqiu
Liang
*a
ab,
Jiwei
Li
ab,
KaiLi
Fan
ab,
Jinguang
Lv
a,
Yuxin
Qin
a,
Kaifeng
Zheng
a,
Baixuan
Zhao
a,
Yingze
Zhao
a,
Yupeng
Chen
a,
Yingwen
Tang
c,
Weibiao
Wang
a and
Jingqiu
Liang
*a
aState Key Laboratory of Applied Optics, Changchun Institute of Optics, Fine Mechanics and Physics, Chinese Academy of Sciences, Changchun, Jilin 130033, China. E-mail: taojin@ciomp.ac.cn
bUniversity of Chinese Academy of Sciences, Beijing 100049, China
cCollege of Physics and Information Engineering, Minnan Normal University, Zhangzhou 363000, China
First published on 11th April 2023
Abstract
This paper presents an easy and intact process based on microfluidics static droplet array (SDA) technology to fabricate quantum dot (QD) arrays for full-color micro-LED displays. A minimal sub-pixel size of 20 μm was achieved, and the fluorescence-converted red and green arrays provide good light uniformity of 98.58% and 98.72%, respectively.
Recently, the metaverse has attracted huge attention from industry and academia and promises a wonderful, interesting and valuable world. The most promising technology for augmented-reality glasses, which constitute the fundamental hardware of the metaverse, involves micro-LED displays and diffracted optical waveguides.1–4 Compared with LCD and OLED displays, micro-LEDs have the advantages of high brightness, long life, low power consumption, high contrast, and high color saturation.5–7 Yet, how to fabricate high brightness, high pixel per inch (PPI), full-color micro-LEDs remains a challenge. One solution is to fabricate a monochromatic high-PPI micro-LED chip at the wafer level and then combine the red, green and blue micro-LEDs by using a trichroic prism to produce full-color images, but such a structure would be relatively bulky and expensive.8 Another solution is to use a quantum dot color conversion layer (QDCCL) combined with a blue micro-LED as an excitation source, which is simpler, more efficient, and cheaper.9–11 The main processes to fabricate QDCCLs are photolithography patterning,12–15 inkjet-printing16–18 and transfer printing.19–21 Photolithography patterning mixes QDs and photoresists, which degrade the QDs due to the application of ultraviolet light and solvents.22 Inkjet-printing can be an efficient method to fabricate QD films with negligible material waste but suffers from difficulties in the formulation of QD inks and poor uniformity caused by coffee-ring effects.23–25 In particular, printing sizes less than 5 μm are difficult with this method. Transfer printing is characterized by high resolution but suffers high equipment cost and low uniformity.26
In our previous study, 140 × 50 μm sub-pixels were created using conventional microfluidic technology.27 However, due to their lateral size exceeding 100 μm, they were unsuitable for using in micro-LED pixels. Moreover, because there was no alternative method to individually isolate pixels within an array, pixels of the same color were linked in a linear sequence through a single microchannel. This resulted in a crosstalk effect at the microbridge junction of adjacent pixels of the same color, which affected the performance of the device.28
In this paper, we propose a simple and intact method to fabricate QDCCLs that exploits microfluidic static droplet array (SDA) technology. As a typical representative of droplet microfluidics, SDA technology can generate, transport, immobilize, fuse, and store micro-droplets29,30 ranging from 1 μm to 1 mm,31–35 which is comparable to the pixel size of micro-LEDs. Red and green QD solutions are conducted in separate channels of the same SDA and after removing the excess QD solution and solidification thereof, a dual-color QD array is formed with uniform size and separated sub-pixels. Compared with photolithography patterning, the method proposed herein produces intact QDs with maximal fluorescence conversion efficiency. The output has a neater morphology and higher PPI than is possible with inkjet-printing because the pixel size is determined by the photolithography process of SDA and is more consistent and reliable than transfer printing.
Fig. 1(a)–(c) show the process for preparing dual-color QDCCLs with a SDA microfluidic chip. All microfluidic devices discussed herein were fabricated using standard soft lithography.36 Fig. S1† shows the process for preparing a SDA microfluidic chip. Red and green QD solutions are first injected into the SDA microfluidic chip to completely fill the pattern [Fig. 1(a)] and then transparent sealing fluid is injected [Fig. 1(b)] to create the pixel dots. Finally, in Fig. 1(c), the microfluidic chip's inlet and outlet are sealed to keep out air and water vapor and safeguard the QDs. Fig. 1(d) shows a single SDA element, which consists essentially of a channel, a bridge and a well. Fig. 1(e) shows the preparation of a single QD pixel. Fig. S2† shows a photograph of fluorescence from a dual-color QDCCL and the optical micrographs of the SDA microfluidic chips.
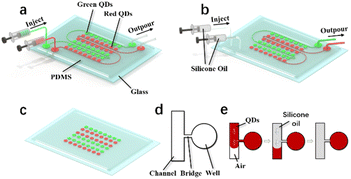 | ||
| Fig. 1 (a–c) Schematic diagram of a QDCCL prepared by SDA. (d) Single structure of SDA. (e) Preparation of a single QD pixel. | ||
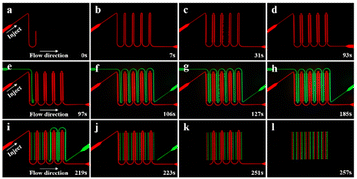
The experimental images of a dual-color QDCCL with a pixel size of 50 μm and array dimensions of 18 × 20 were created by SDA to demonstrate the specifics of QDCCL preparation, as shown in Fig. 2. The time to complete a QDCCL is 257 s, which can be significantly decreased by raising the pressure of the injection pump or by simultaneously injecting the dual-color QD solutions. The red QD solution is injected into the channels and flows across the bridges and into the wells, as shown in Fig. 2(a)–(d). A portion of the solution entering the wells progressively fills the entire chamber because of the capillary force.37 The process for injecting green QD solution is shown in Fig. 2(e)–(h); the same process works for red QDs. Next, the injection port is used to inject the transparent sealing fluid. Dow Corning medical silicone oil was used as the transparent sealing liquid,38 which totally drained the QD solution in the channels because it is immiscible with the QD solution. For details on transparent sealing fluid, please see the ESI.† Given that the wells are filled with the QD solution and that the bridges are considerably smaller than the channels, the transparent sealing fluid has difficulty entering the wells, but it flows out of the liquid outlet along the channels due to the large hydraulic pressure differential. According to Fig. 2(i)–(l), only the final QD solution remains in the wells, creating a QD-pixel array. See the ESI movie† for further details on the injection procedure.
SDAs can create 1 to 100 μm droplets with good morphology and uniformity, as evinced by visible photography. Fig. 3 shows monochromatic and dual-color QDCCLs with pixel sizes of 90, 50 and 20 μm prepared by SDA technology; the number of monochromatic and dual-color pixel arrays is 10 × 10 and 18 × 20, respectively. The horizontal pitch is 150, 90 and 40 μm for pixel sizes of 90, 50 and 20 μm, respectively. The horizontal pitch can be made smaller by increasing the lithography precision and decreasing the channel size. In this experiment, the bridge's width is also investigated. There are four intended bridge sizes: 3, 5, 7 and 9 μm. Comparing the results with the different bridge sizes shows that the pixel arrays of the three sizes all exhibit good results when the bridge's width is 5 μm. The QD pixels produced are destroyed when the bridge width is 7 μm, because the transparent sealing fluid enters the wells and destroys the pixels. However, it is difficult for the QD solution to enter the wells to form pixels when the bridge size is 3 μm.
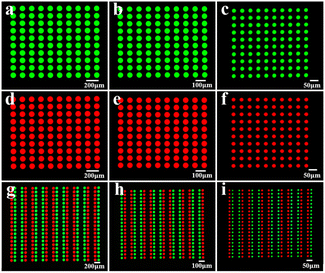 | ||
| Fig. 3 (a–c) Green, (d–f) red and (g–i) dual-color QDCCLs with pixel sizes of 90/50/20 μm prepared by SDA, respectively. | ||
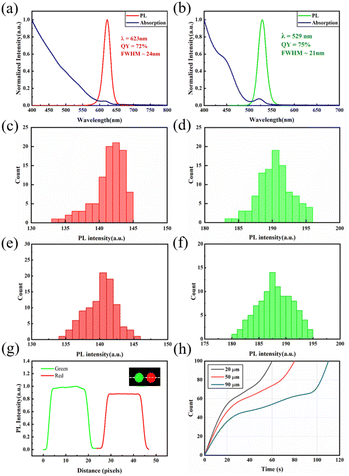
CdSe/ZnS QDs were used in the experiment because of their excellent stability, long fluorescence lifetime, and narrow emission spectrum.11,39Fig. 4(a) and (b) show the absorption spectrum and UV excitation spectrum of the CdSe/ZnS QDs thin film. The emission peaks of red and green QDs are 623 and 529 nm, respectively, with FWHMs of 24 and 21 nm, and quantum yields of 72% and 75%, respectively, when excited by 365 nm UV light.
In addition, the luminous uniformity of pixels is a critical metric for assessing display performance.25,40,41 The average fluorescence intensity distribution of a monochromatic QDCCL with a 10 × 10 pixel layout of 50 μm is shown in Fig. 4(c) and (d), and for 20 μm in Fig. 4(e) and (f), as measured by ImageJ. According to the electronic industry standard “Measure method of light-emitting diode (LED) display screen” of the People's Republic of China, the light uniformity of red and green QDs with a pixel diameter of 50 μm is calculated to be 94.1% and 96.4%, respectively, while the uniformity of red and green QDs with a pixel diameter of 20 μm is calculated to be 98.58% and 98.72%, respectively. This indicates the high fluorescence homogeneity of the QDCCL produced via SDA technology, which conforms to the national standard. The uniformity of 20 μm pixels is improved by 4.54% and 2.35%, respectively, compared to 50 μm pixels, indicating that SDA microfluidic technology produces greater fluorescence intensity uniformity for smaller-sized QD pixels. We believe this is due to the microfluidic chip manufacturing process and the reduced impact of inherent non-uniformity of QD solution on smaller-sized QD pixel arrays. Fig. 4(g) shows the fluorescence intensity of two adjacent red and green QD pixels along the dashed line in the 20 μm dual-color QDCCL under 365 nm UV excitation.42 The green QDs emit a higher intensity than the red QDs when exposed to the same amount of light, and there is minimal optical crosstalk between neighbouring pixels.
As shown in Fig. 4(h), we also investigate the relationship between injection time and the number of filled monochromatic QDCCL pixels for three different pixel sizes and array numbers of 100 when the injection velocity is 10 μL min−1 and the SDA pattern depth is 20 μm. Here, when the QD solution fills a single well in excess of 50%, the well can be regarded as a complete pixel because the capillary force inevitably guides the solution to fill the well completely,31 so this part of the time is not included in this study. As soon as the first pixel emerges, we begin. The injection times of 20, 50 and 90 μm pixel arrays are 60, 80, and 110 s, respectively. The difference is mainly caused by the different volumes of patterns that need to be filled with solution. In addition, the QD solution rapidly fills the SDA at the outset, then slows down, and finally accelerates again. The reason for this behavior is that the QD solution first fills the entire channel; the anterior segment of the channel has a larger hydraulic pressure than the posterior segment, so the QD solution fills the anterior segment of the SDA pattern preferentially. In the anterior segment, the solution gradually flows from bridges to wells, and the filling area of the wells soon reaches 50%, forming partially filled wells, which explains why pixels rapidly form in the early stage. With continuing injection, the solution fills the partially filled wells to make them complete, but during this time, fewer new pixels are generated than before. Once the anterior part of the well array is filled, the speed of the posterior segment pixel generation will resume its rapidity.
We probed blue OLED backlight excitation on the dual-color QDCCL with a pixel size of 50 μm to analyse the performance of the full-color display of the QDCCL by SDA.43Fig. 5(a) shows the excitation spectrum. The comprehensive intensity ratio of blue, green, and red is 1.00![[thin space (1/6-em)]](https://www.rsc.org/images/entities/char_2009.gif) :
:![[thin space (1/6-em)]](https://www.rsc.org/images/entities/char_2009.gif) 0.22
0.22![[thin space (1/6-em)]](https://www.rsc.org/images/entities/char_2009.gif) :
:![[thin space (1/6-em)]](https://www.rsc.org/images/entities/char_2009.gif) 0.15, so the intensity of the blue light is significantly greater than that of the red and green light, according to the spectral data. In this case, white balances the CIE chromaticity coordinates of the samples mentioned above. The colorspace coverage reaches 119.7% of the National Television System Commission (NTSC) standard, as shown in Fig. 5(b).
0.15, so the intensity of the blue light is significantly greater than that of the red and green light, according to the spectral data. In this case, white balances the CIE chromaticity coordinates of the samples mentioned above. The colorspace coverage reaches 119.7% of the National Television System Commission (NTSC) standard, as shown in Fig. 5(b).
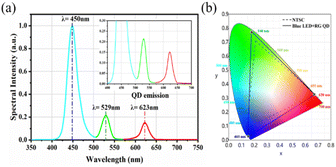 | ||
| Fig. 5 (a) Emission spectrum of blue OLED backlight with a 50 μm dual-color QDCCL. The inset is the same spectrum but with magnified red and green scales. (b) Color gamut diagram. | ||
Conclusions
In summary, we propose herein a methodology based on microfluidic SDA for fabricating microscale QDCCLs. After fabricating monochromatic and dual-color QDCCLs with three pixel sizes, we studied their optical properties and associated parameters. A minimal sub-pixel size of 20 μm was achieved, and the fluorescence-converted red and green arrays provide a good light uniformity of 98.58% and 98.72%, respectively. SDA technology has several advantages over conventional processes, including high precision, low cost, an intact approach, high efficiency, and no required encapsulation. This work thus provides an intact method to fabricate full-color QDCCLs, which should further promote the commercialization of full-color micro-LEDs.Conflicts of interest
There are no conflicts to declare.Acknowledgements
This work was supported by the National Key Research and Development Program (2022YFB3604702), National Natural Science Foundation of China (62004195), and Jilin Scientific and Technological Development Program (20200401056GX). Thanks for the cooperative project between Tianjin and the Chinese Academy of Sciences.References
- B. Kress, E. Saeedi and V. Brac-de-la-Perriere, The segmentation of the HMD market: optics for smart glasses, smart eyewear, AR and VR headsets, Proc. SPIE 9202, Photonics Applications for Aviation, Aerospace, Commercial, and Harsh Environments V, San Diego, CA, 2014, p. 92020D Search PubMed.
- J. Xiong, E.-L. Hsiang, Z. He, T. Zhan and S.-T. Wu, Augmented reality and virtual reality displays: emerging technologies and future perspectives, Light: Sci. Appl., 2021, 10, 216 CrossRef CAS PubMed.
- Y. Ban, J. Jia, Y. Zhan, Z. Liu, H. Li, K. Liu, Y. Su, M. Lian and T. Cao, A Black Phosphorus-Based Fabry–Pérot Cavity and Its Application for Reversible Color Switching, Adv. Photonics Res., 2022, 3, 2200137 CrossRef CAS.
- J. Y. Jia, Y. Ban, K. Liu, L. B. Mao, Y. Su, M. Lian and T. Cao, Reconfigurable Full Color Display using Anisotropic Black Phosphorus, Adv. Opt. Mater., 2021, 9(16), 2100499 CrossRef CAS.
- Y. Huang, E.-L. Hsiang, M.-Y. Deng and S.-T. Wu, Mini-LED, Micro-LED and OLED displays: present status and future perspectives, Light: Sci. Appl., 2020, 9, 105 CrossRef CAS PubMed.
- D. Hwang, A. Mughal, C. D. Pynn, S. Nakamura and S. P. DenBaars, Sustained high external quantum efficiency in ultrasmall blue III-nitride micro-LEDs, Appl. Phys. Express, 2017, 10(3), 032101 CrossRef.
- H.-W. Chen, J.-H. Lee, B.-Y. Lin, S. Chen and S.-T. Wu, Liquid crystal display and organic light-emitting diode display: present status and future perspectives, Light: Sci. Appl., 2018, 7, 17168 CrossRef CAS PubMed.
- Z. J. Liu, W. C. Chong, K. M. Wong, K. H. Tam and K. M. Lau, A Novel BLU-Free Full-Color LED Projector Using LED on Silicon Micro-Displays, IEEE Photonics Technol. Lett., 2013, 25, 2267–2270 CAS.
- X. J. Zhou, P. F. Tian, C. W. Sher, J. Wu, H. Z. Liu, R. Liu and H. C. Kuo, Growth, transfer printing and colour conversion techniques towards full-colour micro-LED display, Prog. Quantum Electron., 2020, 71(71), 100263 CrossRef.
- J. Bae, Y. Shin, H. Yoo, Y. Choi, J. Lim, D. Jeon, I. Kim, M. Han and S. Lee, Quantum dot-integrated GaN light-emitting diodes with resolution beyond the retinal limit, Nat. Commun., 2022, 13, 1862 CrossRef CAS PubMed.
- Z. Liu, C. Lin, R. Hyun Byung, W. Sher Chin, Z. Lv, B. Luo, F. Jiang, T. Wu, H. Ho Chih, C. Kuo Hao and H. He Jr, Micro-light-emitting diodes with quantum dots in display technology, Light: Sci. Appl., 2020, 9(3), 83 CrossRef CAS PubMed.
- C. Zou, C. Chang, D. Sun, K. F. Bohringer and L. Y. Lin, Photolithographic Patterning of Perovskite Thin Films for Multicolor Display Applications, Nano Lett., 2020, 20, 3710–3717 CrossRef CAS PubMed.
- J. Yang, D. Hahm, K. Kim, S. Rhee, M. Lee, S. Kim, J. H. Chang, H. W. Park, J. Lim, M. Lee, H. Kim, J. Bang, H. Ahn, J. H. Cho, J. Kwak, B. Kim, C. Lee, W. K. Bae and M. S. Kang, High-resolution patterning of colloidal quantum dots via non-destructive, light-driven ligand crosslinking, Nat. Commun., 2020, 11(1), 2874 CrossRef CAS PubMed.
- S. Y. Lin, G. J. Tan, J. H. Yu, E. G. Chen, Y. L. Weng, X. T. Zhou, S. Xu, Y. Ye, Q. F. Yan and T. L. Guo, Multi-primary-color quantum-dot down-converting films for display applications, Opt. Express, 2019, 27, 28480–28493 CrossRef CAS PubMed.
- H. M. Kim, M. Ryu, J. H. J. Cha, H. S. Kim, T. Jeong and J. Jang, Ten micrometer pixel, quantum dots color conversion layer for high resolution and full color active matrix micro-LED display, J. Soc. Inf. Disp., 2019, 27, 347–353 CrossRef CAS.
- S.-W. Wang, H.-Y. Lin, C.-C. Lin, T. S. Kao, K.-J. Chen, H.-V. Han, J.-R. Li, P.-T. Lee, H.-M. Chen, M.-H. Hong and H.-C. Kuo, Pulsed-laser micropatterned quantum-dot array for white light source, Sci. Rep., 2016, 6, 23563 CrossRef CAS PubMed.
- H. V. Han, H. Y. Lin, C. C. Lin, W. C. Chong, J. R. Li, K. J. Chen, P. C. Yu, T. M. Chen, H. M. Chen, K. M. Lau and H. C. Kuo, Resonant-enhanced full-color emission of quantum-dot-based micro LED display technology, Opt. Express, 2015, 23, 32504–32515 CrossRef CAS PubMed.
- X. Zheng, Y. B. Zhu, Y. Liu, L. P. Zhou, Z. W. Xu, C. Feng, C. B. Zheng, Y. T. Zheng, J. Y. Bai, K. Y. Yang, D. Y. Zhu, J. M. Yao, H. L. Hu, Y. H. Zheng, T. L. Guo and F. S. Li, Inkjet-Printed Quantum Dot Fluorescent Security Labels with Triple-Level Optical Encryption, ACS Appl. Mater. Interfaces, 2021, 13, 15701–15708 CrossRef CAS PubMed.
- L. Kim, P. O. Anikeeva, S. A. Coe-Sullivan, J. S. Steckel, M. G. Bawendi and V. Bulovic, Contact Printing of Quantum Dot Light-Emitting Devices, Nano Lett., 2008, 8, 4513–4517 CrossRef CAS PubMed.
- T. H. Kim, K. S. Cho, E. K. Lee, S. J. Lee, J. Chae, J. W. Kim, D. H. Kim, J. Y. Kwon, G. Amaratunga, S. Y. Lee, B. L. Choi, Y. Kuk, J. M. Kim and K. Kim, Full-colour quantum dot displays fabricated by transfer printing, Nat. Photonics, 2011, 5, 176–182 CrossRef CAS.
- T. Meng, Y. Zheng, D. Zhao, H. Hu, Y. Zhu, Z. Xu, S. Ju, J. Jing, X. Chen, H. Gao, K. Yang, T. Guo, F. Li, J. Fan and L. Qian, Ultrahigh-resolution quantum-dot light-emitting diodes, Nat. Photonics, 2022, 16, 297–303 CrossRef CAS.
- J. Zhao, L. X. Chen, D. Z. Li, Z. Q. Shi, P. Liu, Z. L. Yao, H. C. Yang, T. Y. Zou, B. Zhao, X. Zhang, H. Zhou, Y. X. Yang, W. R. Cao, X. L. Yan, S. D. Zhang and X. W. Sun, Large-area patterning of full-color quantum dot arrays beyond 1000 pixels per inch by selective electrophoretic deposition, Nat. Commun., 2021, 12(1), 4603 CrossRef CAS PubMed.
- Y. L. Weng, S. Y. Chen, Y. G. Zhang, L. Sun, Y. Wu, Q. Yan, T. L. Guo, X. T. Zhou and C. X. Wu, Fabrication and color conversion of patterned InP/ZnS quantum dots photoresist film via a laser-assisted route, Opt. Laser Technol., 2021, 140(3), 107026 CrossRef CAS.
- X. L. Dai, Y. Z. Deng, X. G. Peng and Y. Z. Jin, Quantum-Dot Light-Emitting Diodes for Large-Area Displays: Towards the Dawn of Commercialization, Adv. Mater., 2017, 29(14), 1607022 CrossRef PubMed.
- Y. Y. Gao, C. B. Kang, M. F. Prodanov, V. V. Vashchenko and A. K. Srivastava, Inkjet-Printed, Flexible Full-Color Photoluminescence-Type Color Filters for Displays, Adv. Eng. Mater., 2022, 24(8), 2101553 CrossRef CAS.
- Y. Cheng, J. C. C. Lo, X. Qiu, B. Shieh and S. W. R. Lee, Quantum Dot Film Patterning on a Trenched Glass Substrate for Defining Pixel Arrays of a Full-color Mini/Micro-LED Display, 2020 21st International Conference on Electronic Packaging Technology (ICEPT), Guangzhou, China, 2020, pp. 1–3 Search PubMed.
- Y. Li, J. Tao, Q. Wang, Y. Zhao, Y. Sun, P. Li, J. Lv, Y. Qin, W. Wang, Q. Zeng and J. Liang, Microfluidics-based quantum dot color conversion layers for full-color micro-LED display, Appl. Phys. Lett., 2021, 118(17), 173501 CrossRef CAS.
- P. Li, J. Tao, Y. Zhao, Y. Sun, K. Fan, L. Zhu, W. Sun, J. Lv, Y. Qin, Q. Wang, Q. Zeng, W. Wang, S. Wang and J. Liang, Flexible Quantum-Dot Color-Conversion Layer Based on Microfluidics for Full-Color Micro-LEDs, Micromachines, 2022, 13(3), 448 CrossRef PubMed.
- S. H. Jin, H. H. Jeong, B. Lee, S. S. Lee and C. S. Lee, A programmable microfluidic static droplet array for droplet generation, transportation, fusion, storage, and retrieval, Lab Chip, 2015, 15, 3677–3686 RSC.
- V. Bianco, B. Mandracchia, V. Marchesano, V. Pagliarulo, F. Olivieri, S. Coppola, M. Paturzo and P. Ferraro, Endowing a plain fluidic chip with micro-optics: a holographic microscope slide, Light: Sci. Appl., 2017, 6, e17055 CrossRef CAS PubMed.
- J. Shemesh, T. Ben Arye, J. Avesar, J. H. Kang, A. Fine, M. Super, A. Meller, D. E. Ingber and S. Levenberg, Stationary nanoliter droplet array with a substrate of choice for single adherent/nonadherent cell incubation and analysis, Proc. Natl. Acad. Sci. U. S. A., 2014, 111, 11293–11298 CrossRef CAS PubMed.
- S. Ota, H. Kitagawa and S. Takeuchi, Generation of Femtoliter Reactor Arrays within a Microfluidic Channel for Biochemical Analysis, Anal. Chem., 2012, 84, 6346–6350 CrossRef CAS PubMed.
- C. H. J. Schmitz, A. C. Rowat, S. Koster and D. A. Weitz, Dropspots: a picoliter array in a microfluidic device, Lab Chip, 2009, 9, 44–49 RSC.
- S. S. Bithi, W. S. Wang, M. Sun, J. Blawzdziewicz and S. A. Vanapalli, Coalescing drops in microfluidic parking networks: A multifunctional platform for drop-based microfluidics, Biomicrofluidics, 2014, 8(3), 034118 CrossRef PubMed.
- M. Sun, S. S. Bithi and S. A. Vanapalli, Microfluidic static droplet arrays with tuneable gradients in material composition, Lab Chip, 2011, 11, 3949–3952 RSC.
- A. Llobera, J. Juvert, A. González-Fernández, B. Ibarlucea, E. Carregal-Romero, S. Büttgenbach and C. Fernández-Sánchez, Biofunctionalized all-polymer photonic lab on a chip with integrated solid-state light emitter, Light: Sci. Appl., 2015, 4, e271 CrossRef CAS.
- H. Boukellal, S. Selimovic, Y. W. Jia, G. Cristobal and S. Fraden, Simple, robust storage of drops and fluids in a microfluidic device, Lab Chip, 2009, 9, 331–338 RSC.
- W. Zhang, H. Zappe and A. Seifert, Wafer-scale fabricated thermo-pneumatically tunable microlenses, Light: Sci. Appl., 2014, 3, e145 CrossRef CAS.
- Y. Shirasaki, G. J. Supran, M. G. Bawendi and V. Bulović, Emergence of colloidal quantum-dot light-emitting technologies, Nat. Photonics, 2013, 7, 13–23 CrossRef CAS.
- Z. J. Liu, W. C. Chong, K. M. Wong, C. W. Keung and K. M. Lau, A Novel BLU-Free Full-Color LED Projector Using LED on Silicon Micro-Displays, IEEE Photonics Technol. Lett., 2013, 25, 1290–1293 CAS.
- S. Hwangbo, L. Hu, A. T. Hoang, J. Y. Choi and J. H. Ahn, Wafer-scale monolithic integration of full-colour micro-LED display using MoS2 transistor, Nat. Nanotechnol., 2022, 17, 500–506 CrossRef CAS PubMed.
- W. C. Sun, F. Li, J. Tao, P. Y. Li, L. C. Zhu, J. W. Li, J. G. Lv, W. B. Wang, J. Q. Liang and H. Z. Zhong, Micropore filling fabrication of high resolution patterned PQDs with a pixel size less than 5 μm, Nanoscale, 2022, 14, 5994–5998 RSC.
- C. C. Lin, K. L. Liang, W. H. Kuo, H. T. Shen, C. I. Wu and Y. H. Fang, Colloidal Quantum Dot Enhanced Color Conversion Layer for Micro LEDs, IEICE Trans. Electron., 2022, E105C, 52–58 CrossRef.
Footnote |
| † Electronic supplementary information (ESI) available. See DOI: https://doi.org/10.1039/d2na00765g |
| This journal is © The Royal Society of Chemistry 2023 |

