 Open Access Article
A terahertz metasurface sensor with fingerprint enhancement in a wide spectrum band for thin film detection
Xuan
Zhang
,
Jianjun
Liu
and
Jianyuan
Qin
 *
*
Centre for Terahertz Research, China Jiliang University, Hangzhou 310018, China. E-mail: jyqin@cjlu.edu.cn
First published on 9th March 2023
Abstract
Terahertz spectroscopy is a powerful tool to resolve molecular fingerprints by detecting their vibrational and rotational modes, and has great application potential in chemistry and biomedicine. However, the limited sensitivity and poor specificity restrict its applications in these areas, where trace amounts of analytes need to be identified effectively and accurately. Here, we propose a sensing scheme for enhancing molecular fingerprints based on angle-scanning of terahertz waves on an all-silicon metasurface. The metasurface consists of a periodic array of silicon cylinder dimers arranged in a square lattice. An ultrasharp guided mode resonance governed by bound states in the continuum can be excited by elaborately arranging the silicon cylinder dimers. By utilizing the angle-scanning strategy, two kinds of saccharides are successfully identified with extremely high sensitivity. Specifically, the detection limits for lactose and glucose are 1.53 μg cm−2 and 1.54 μg cm−2, respectively. Our study will provide a new idea for the detection of trace amounts of analytes, and promote the application of terahertz technology in chemistry and biomedicine.
Introduction
Terahertz (THz) spectroscopy with frequency ranging from 0.1 to 10 THz is particularly promising in the field of non-destructive testing due to its advantages of high penetration, low photon energies, and molecular fingerprint patterns.1–3 In recent years, THz spectroscopy has been applied in many fields such as physics,4 chemistry,5 biomedicine,6 and environmental monitoring.7 It is worth mentioning in particular that many biochemical molecules have their vibrational and rotational modes located in the THz band, which are expressed as their fingerprints such as absorption and dispersion. This unique advantage of THz spectroscopy offers great potential for molecular identification in chemistry and biomedicine.8,9 Nevertheless, the interactions between the molecules and THz waves are quite weak due to the extremely small size of most molecules in the nanometer scale compared to THz wavelengths in the micrometer scale. As a result, a large volume of analytes is usually required in THz sensing to have observable fingerprints for detection.10,11In a traditional THz detection method, analytes are usually detected in the form of solid tablets with a thickness of several millimeters and a weight of hundreds of milligrams.12 Therefore, it is inapplicable to the detection of trace amounts of analytes. To address this issue, it is essential to improve the sensitivity of the THz detection method in practical applications. Many attempts have been made in this regard, and metasurface structures such as covalent-organic-framework absorbers,13 graphene metamaterials,14 near-field THz enhancements,15 split-ring resonators,16,17 metallic gratings,18 antenna arrays,19,20 and waveguide structures21,22 were used as sensors to enhance the local electric field and thus to amplify the fingerprints of analytes. These sensors could enhance the absorption cross-section of analytes and greatly improve the detection sensitivity, but they all suffer from large intrinsic losses and low quality factors, which will lead to a limited sensitivity for the detection of analytes. Recently, an angle-scanning strategy was introduced in the metasurface structure to obtain a wide spectrum band for sensing applications in the THz band. Utilizing this technology, tyrosine and santonin on the metasurface could be identified with detection limits of 6.7 μg cm−2 and 59.35 μg cm−2, respectively.23 The molecular fingerprints of lactose, 2, 4-DNT, and RDX were amplified about 13, 25, and 25 times, respectively.24 However, the sensitivities in these reports were slightly insufficient and need to be further improved,23,24 and the incident angle of THz waves was scanned in two different planes (y–z and x–z) in order to allow the spectrum to cover a wider band, which increased the difficulty of operation.23
In this paper, a sensing method for enhancing molecular fingerprints based on angle-scanning of terahertz waves on an all-silicon metasurface is proposed. The metasurface that consists of a periodic array of silicon cylinder dimers arranged in a square lattice can excite guided mode resonance (GMR) driven by bound states in the continuum (BIC). By manipulating the incident angle of THz waves in one plane (x–z), a wide envelope curve formed by the resonance dips can be generated. This wide envelope curve covers the absorption resonances of lactose and glucose. As a result, lactose and glucose can be recognized using this metasurface, and their detection limits are 1.53 μg cm−2, and 1.54 μg cm−2, respectively, which are higher than the previous reports.23 In addition, the fabrication of the all-silicon metasurface in our study is much easier,23–25 and the acquisition of a wide spectrum band is simplified by scanning only one plane.23 Therefore, this sensing method can identify the absorption resonances of lactose and glucose with good accuracy and high sensitivity.
Structure and design
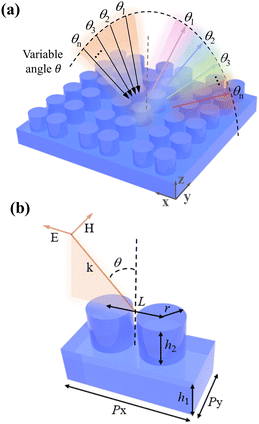
The proposed metasurface is illustrated in Fig. 1(a), which consists of a periodic array of silicon cylinder dimers arranged in a square lattice on a silicon substrate. Silicon (relative permittivity being 11.7) is used as the material for both the cylinder and substrate because of its low dissipative loss and high refractive index in the THz region.25 THz waves with TM polarization are incident on the surface of the metasurface. By varying the incident angle (θ), the resonance dip in the transmittance spectrum will shift, and these shifting resonance dips eventually form a wide transmittance envelope curve. Fig. 1(b) demonstrates the unit cell of the metasurface. The geometric parameters of the unit cell are set as follows, period Px = 245 μm and Py = 114 μm, cylinder radius r = 40 μm, distance between the centers of two silicon cylinders L = 94 μm, cylinder height h2 = 69 μm, and substrate thickness h1 = 72 μm. During the angle-scanning, the k vector andpolarization of THz waves are in the x–z plane. The performance of this metasurface (three-dimensional simulation model) is investigated using the frequency-domain finiteelement method with the commercially available CST Microwave Studio (Version 2019), where the periodic boundary conditions are imposed in x- and y-directions, and the open boundary condition is used in the z-direction. The proposed metasurface can be fabricated using the mature complementary metal-oxide semiconductor technology,26,27 and its transmittance spectrum can be measured using a THz spectroscopy system working in transmittance mode.Results and discussion
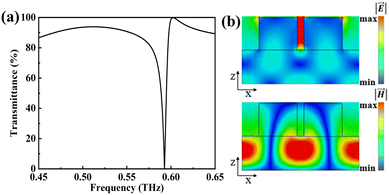
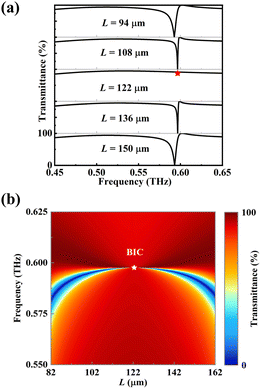
Fig. 2 shows the transmittance spectrum of the proposed metasurface and the absolute value distribution of the electric field and magnetic field at the resonance when the THz waves are vertically incident on the metasurface along the z-direction with an electric field polarized along the x-direction. It can be seen from Fig. 2(a) that an ultrasharp resonance dip is located at 0.59 THz. The linewidth (full width at half maximum, FWHM)of the transmittance resonance is about 5 GHz, and the calculated quality (Q) factor28 can reach 110. At the resonance, the magnetic field (x–z plane) is strongly localized and confined in the silicon substrate layer, and the strong electric field (x–z plane) is concentrated between the two silicon cylinders, see Fig. 2(b). Such electric field distribution can provide effective interaction between the field and analytes and will have great potential in sensing applications. In our structure, the silicon substrate is considered as the waveguide layer while the silicon cylinders are regarded as two-dimensional gratings.29 In this case, the incident THz waves can be coupled to the waveguide mode through diffraction and thus excite the GMR, indicating that the observable resonance dip located at 0.59 THz is the GMR.To get insight into the effect of the distance between the centers of two silicon cylinders on the transmittance resonance, the spectral response of the metasurface with various L values ranging from 94 μm to 150 μm is analyzed. It can be seen from Fig. 3(a) that the frequency position of the resonance dip shows a little blue-shift (shifts to higher frequency) while its linewidth is becoming narrower as the L value is close to 122 μm. When L equals 122 μm, the resonance dip vanishes (see the red pentagram), which means that there is no leakage energy in the channel between the bound state and the free space continuum and indicates the existence of BIC.30 This phenomenon is due to the fact that continuous tuning of the distance between the cylinder dimers can satisfy certain destructive interference conditions of an “accidental” (parameter-tuned) BIC. Fig. 3(b) shows the two-dimensional diagram of transmittance as a function of frequency and parameter L. One resonance dip can be seen and it becomes sharper as L approaches 122 μm and eventually disappears at an L value of 122 μm (see the white pentagram). As the L value decreases or increases from 122 μm, the resonance dip appears again with a gradually increasing linewidth, demonstrating that this resonance dip is transformed from BIC into quasi-BIC with a finite Q factor.31
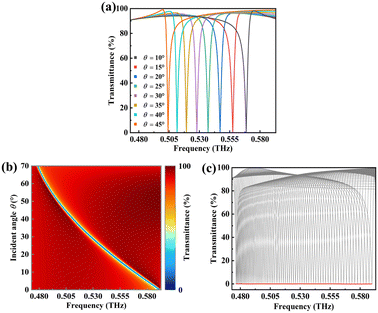
To characterize the spectral response of the metasurface, the dependence of transmittance resonance dip behavior on the incident angle θ is investigated. Fig. 4(a) depicts the transmittance spectra of the metasurface as a function of incident angle θ ranging from 10° to 45°. There is a unity transmittance corresponding to each incident angle θ, and the frequency position of the resonance dip experiences a red-shift (shifts to lower frequency) while its linewidth remains almost constant as the incident angle θ increases. The Q factor of the resonance dip remains high for all incident angles with an average value of 216. Fig. 4(b) shows a two-dimensional contour map of transmittance as a function of frequency and incident angle θ. It is worth noting that the frequency of the resonance dip has a good linear dependency on the incident angle θ. Such an angle-dependent spectral response can be interpreted by the theory of GMR,32 in which the incident waves pass through the metasurface structure at a specific angle and eventually generate a waveguide mode at the corresponding frequency. In this waveguide mode, the incident waves can be trapped and guided within the metasurface. The grating diffraction and waveguiding criteria provide the critical condition for the realization of GMR. By analyzing and processing this condition, the GMR can be readily achieved as a function of θ. Fig. 4(c) shows the transmittance spectra (θ from 1° to 70° with a step of 1°) and the corresponding envelope curve of the metasurface. The resonance dips in transmittance spectra for different incident angles are extracted and further fitted into an envelope curve (shown as the red line) by interpolation. This envelope curve can cover a wide range of frequencies, which is important for the fingerprint detection of analytes. It can be noticed that this envelope curve is non-resonant (with no resonance dip), which is beneficial for fingerprint detection. In this case, a resonance dip that matched the fingerprint of the analyte will be observed in the envelope curve when the analyte is deposited on the metasurface.
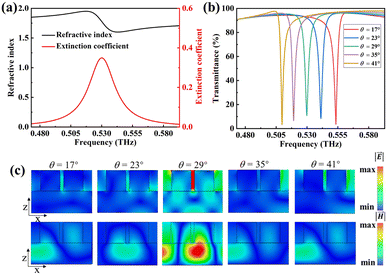
The sensing performance of this metasurface is evaluated when 0.16 μm thick lactose is deposited on it. The complex dielectric permittivity of lactose is characterized by using the Lorentz model,33 and for simple calculations, we only consider the first-order absorption resonance of lactose at 0.53 THz in the present study. Therefore, the complex dielectric permittivity of lactose can be calculated from the following equation,
 | (1) |
 | (2) |
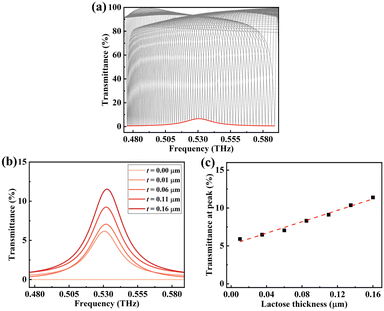
The ability of fingerprint detection for this metasurface is comprehensively investigated by using lactose and glucose as detected objects. In the simulation, lactose and glucose are assumed to be a layer of uniform thin film on the surface of the metasurface structure. Fig. 6(a) shows the transmittance spectra (θ from 1° to 70°) and the corresponding envelope curve of the metasurface with a 0.01 μm thick lactose layer deposition. It can be seen that the envelope curve shows a maximum transmittance value of 5.91% at 0.53 THz due to the optical loss of lactose. As a result, an envelope peak located at 0.53 THz indicates that the fingerprint of lactose can be clearly observed. Fig. 6(b) depicts the envelope curves of the lactose layer with different thicknesses coated on the metasurface. It is found that as the lactose thickness increases, the transmittance value at 0.53 THz increases as well. When the lactose thickness increases from 0.01 μm to 0.16 μm, the transmittance at 0.53 THz increases from 5.91% to 11.39%, and the corresponding transmittance change is 5.48%. The dependence of transmittance at 0.53 THz for lactose thickness ranging from 0.01 μm to 0.16 μm is presented in Fig. 6(c). The fitted equation is estimated to be y = 0.38x + 0.05, where y represents the transmittance at 0.53 THz, and x is the lactose thickness in units of microns. The correlation coefficient of this fitted curve is 0.98, indicating a good linear dependency between the transmittance at the envelope peak and the lactose thickness. The detection limit (σ) can be calculated using σ = ρ × h, where h is the thickness of lactose, and ρ is the volume density of lactose. In our study, the thickness of lactose is h = 0.01 μm, the volume density of lactose is ρ = 1.53 g cm−3, and the minimum thickness of lactose that can be detected is 0.01 μm; thus the detection limit σ of the proposed metasurface for lactose detection is calculated to be 1.53 μg cm−2. These results show that the lactose thickness can be predicted based on the transmittance at the envelope peak, achieving the quantitative detection of lactose.
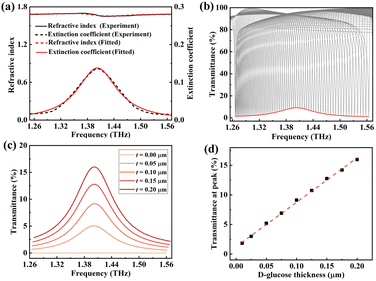
For the detection of glucose, the transmittance spectrum of glucose is obtained by measuring the glucose tablet sample using a commercial THz–TDS system.34 Then the complex refractive index of the glucose is extracted using the data processing model based on the Fresnel formula.35,36 It is reported that glucose has a characteristic absorption peak (fingerprint) located at 1.40 THz.37 To cover the fingerprint of glucose, the transmittance envelope curves are obtained by angle-scanning (θ from 1° to 70°) the metasurface with geometric parameters of Px = 90 μm, Py = 43 μm, r = 15 μm, L = 36 μm, h1 = 28 μm and h2 = 27 μm. Fig. 7(a) shows the complex refractive index of glucose within the frequency range of 1.26 to 1.56 THz, and the black curve represents the complex refractive index obtained by experiment while the red curve is the complex refractive index obtained by fitting. It can be seen that the refractive index n(ω) of glucose has little variation with an average value of 1.68, while its extinction coefficient k(ω) shows remarkable change with a maximum value at 1.40 THz that corresponds to the fingerprint of glucose. The transmittance spectra (θ from 1° to 70°) and the corresponding envelope curve of the metasurface coated with a 0.1 μm thick glucose layer are shown in Fig. 7(b). It can be seen that the envelope curve has a maximum transmittance of about 9.5% and thus shows an envelope peak at 1.40 THz because of the optical loss of glucose. Fig. 7(c) shows the envelope curves of glucose with different thicknesses deposited on the metasurface. As thickness increases from 0.05 to 0.20 μm, the transmittance at the envelope peak increases from 5.20% to 15.98%, and the corresponding transmittance change is 10.78%. The transmittance at the envelope peak versus glucose thickness ranging from 0.01 μm to 0.20 μm is presented in Fig. 7(d). There is a monotonic increase in the transmittance at 1.40 THz as the thickness increases, and the fitted equation is estimated to be y = 0.75x + 0.01, where x and y represent the thickness of glucose and transmittance at 1.40 THz, respectively. The correlation coefficient of this fitted curve is 0.99, indicating a good linear dependency between the glucose thickness and the transmittance at 1.40 THz. In our study, the thickness h of glucose is 0.01 μm, the volume density ρ of glucose is 1.54 g cm−3, and the minimum thickness of glucose that can be detected is 0.01 μm; thus the detection limit (σ) of the proposed metasurface for glucose is 1.54 μg cm−2.
Conclusions
In conclusion, an all-silicon metasurface based on angle-scanning has been proposed, which greatly improved the detection sensitivity in the THz range. The metasurface is composed of a periodic array of silicon cylinder dimers arranged in a square lattice, and GMR with a high Q factor governed by BIC can be excited when the THz waves are vertically incident on this metasurface. In this case, the magnetic field is strongly localized and confined in the silicon substrate while the strong electric field is concentrated between the two silicon cylinders. With the help of the angle-scanning strategy, a wide transmittance envelope curve that covers a wide range of frequencies is produced. Then the resonance dips in transmittance spectra are extracted to form an envelope curve that has non-resonance characteristics, which is beneficial for fingerprint detection. The performance of fingerprint detection using this technology is investigated theoretically and experimentally, and the qualitative and quantitative detection of lactose and glucose can be successfully achieved with detection limits of 1.53 μg cm−2 and 1.54 μg cm−2, respectively. Our study indicates that the proposed metasurface combined with the angle-scanning strategy has great potential for fingerprint detection of trace amounts of analytes in the THz region. We believe that our findings will provide a basis for performing further experiments. And the effects of the THz spectroscopy system such as its spectral resolution and signal-to-noise ratio need to be taken into account, which is what we are going to focus on in the following study.Author contributions
X. Zhang performed numerical simulations and analyzed the results. J. Liu performed experiments and analyzed the results. J. Qin conceived the idea and acquired the funding. All authors contributed to the discussion of the results and manuscript preparation.Conflicts of interest
The authors declare no conflict of interest.Acknowledgements
This work was supported by the Fundamental Research Funds for the Provincial Universities of Zhejiang (2021YW27).Notes and references
- J. El Haddad, F. de Miollis, J. B. Sleiman, L. Canioni, P. Mounaix and B. Bousquet, Anal. Chem., 2014, 86, 4927–4933 CrossRef CAS PubMed
.
- L. Afsah-Hejri, P. Hajeb, P. Ara and R. J. Ehsani, Compr. Rev. Food Sci. Food Saf., 2019, 18, 1563–1621 CrossRef PubMed
.
- Q. X. Ma, Y. Teng, C. Li and L. Jiang, Food Chem., 2022, 377, 132030 CrossRef CAS
.
- S. Koenig, D. Lopez-Diaz, J. Antes, F. Boes, R. Henneberger, A. Leuther, A. Tessmann, R. Schmogrow, D. Hillerkuss, R. Palmer, T. Zwick, C. Koos, W. Freude, O. Ambacher, J. Leuthold and I. Kallfass, Nat. Photonics, 2013, 7, 977–981 CrossRef CAS
.
- M. J. Zhang, H. C. Hong, H. J. Lin, L. G. Shen, H. Y. Yu, G. C. Ma, J. R. Chen and B. Q. Liao, Water Res., 2018, 129, 337–346 CrossRef CAS
.
- M. Seo and H. R. Park, Adv. Opt. Mater., 2020, 8, 1900662 CrossRef CAS
.
- W. X. Leng, H. L. Zhan, L. N. Ge, W. Wang, Y. Ma, K. Zhao, S. Y. Li and L. Z. Xiao, Fuel, 2015, 159, 84–88 CrossRef CAS
.
- Z. X. Geng, X. Zhang, Z. Y. Fan, X. Q. Lv and H. D. Chen, Sci. Rep., 2017, 7, 16378 CrossRef PubMed
.
- S. H. Lee, D. Lee, M. H. Choi, J. H. Son and M. Seo, Anal. Chem., 2019, 91, 6844–6849 CrossRef CAS PubMed
.
- L. Ho, M. Pepper and P. Taday, Nat. Photonics, 2008, 2, 541–543 CrossRef CAS
.
- Y. F. Hua and H. J. Zhang, IEEE Trans. Microwave Theory Tech., 2010, 58, 2064–2070 CAS
.
- Z. J. Yan and W. Shi, J. Opt. Soc. Am. B, 2022, 39, A9–A12 CrossRef CAS
.
- W. D. Xu, S. Wang, W. Li, Z. Y. Zhang, Y. L. Wang, Y. H. Yang, H. R. Zhang, P. W. Liu, L. J. Xie and Y. B. Ying, Biosens. Bioelectron., 2022, 209, 114274 CrossRef CAS PubMed
.
- X. M. Du, F. P. Yan, W. Wang, L. N. Zhang, Z. Y. Bai, H. Zhou and Y. F. Hou, Opt. Laser Technol., 2021, 144, 107409 CrossRef CAS
.
- D. K. Lee, G. Kim, C. Kim, Y. M. Jhon, J. H. Kim, T. Lee, J. H. Son and M. Seo, IEEE Trans. Terahertz Sci. Technol., 2016, 6, 389–395 CAS
.
- S. J. Park, J. T. Hong, S. J. Choi, H. S. Kim, W. K. Park, S. T. Han, J. Y. Park, S. Lee, D. S. Kim and Y. H. Ahn, Sci. Rep., 2014, 4, 4988 CrossRef CAS PubMed
.
- K. Meng, S. J. Park, A. D. Burnett, T. Gill, C. D. Wood, M. Rosamond, L. H. Li, L. Chen, D. R. Bacon, J. R. Freeman, P. Dean, Y. H. Ann, E. H. Linfield, A. G. Davies and J. E. Cunningham, Opt. Express, 2019, 27, 23164–23172 CrossRef CAS PubMed
.
- J. Y. Qin, W. Cheng, B. J. Han, Y. Du, Z. H. Han and Z. S. Zhao, Sci. Rep., 2020, 10, 3712 CrossRef CAS PubMed
.
- S. J. Park, B. H. Son, S. J. Choi, H. S. Kim and Y. H. Ahn, Opt. Express, 2014, 22, 30467–30472 CrossRef CAS PubMed
.
- D. K. Lee, J. H. Kang, J. S. Lee, H. S. Kim, C. Kim, J. H. Kim, T. Lee, J. H. Son, Q. H. Park and M. Seo, Sci. Rep., 2015, 5, 15459 CrossRef CAS PubMed
.
- B. You, J. Y. Lu, C. P. Yu, T. A. Liu and J. L. Peng, Opt. Express, 2012, 20, 5858–5866 CrossRef CAS PubMed
.
- J. J. Yang, Y. Francescato, D. Z. Chen, J. F. Yang and M. Huang, Opt. Express, 2015, 23, 8583–8589 CrossRef CAS PubMed
.
- Y. J. Zhong, L. H. Du, Q. Liu, L. G. Zhu, K. Meng, Y. Zou and B. Zhang, RSC Adv., 2020, 10, 33018–33025 RSC
.
- J. F. Zhu, S. Jiang, Y. N. Xie, F. J. Li, L. H. Du, K. Meng, L. G. Zhu and J. Zhou, Opt. Lett., 2020, 45, 2335–2338 CrossRef CAS PubMed
.
- S. Y. Xiao, T. Wang, T. T. Liu, C. B. Zhou, X. Y. Jiang and J. F. Zhang, J. Phys. D: Appl. Phys., 2020, 53, 503002 CrossRef CAS
.
- R. T. Ako, A. Upadhyay, W. Withayachumnankul, M. Bhaskaran and S. Sriram, Adv. Opt. Mater., 2020, 8, 1900750 CrossRef CAS
.
- K. Bi, Q. M. Wang, J. C. Xu, L. H. Chen, C. W. Lan and M. Lei, Adv. Opt. Mater., 2021, 9, 2001474 CrossRef CAS
.
- Y. M. Yang, I. I. Kravchenko, D. P. Briggs and J. Valentine, Nat. Commun., 2014, 5, 5753 CrossRef CAS PubMed
.
- S. Han, M. V. Rybin, P. Pitchappa, Y. K. Srivastava, Y. S. Kivshar and R. Singh, Adv. Opt. Mater., 2020, 8, 1900959 CrossRef CAS
.
- Y. He, G. T. Guo, T. H. Feng, Y. Xu and A. E. Miroshnichenko, Phys. Rev. B, 2018, 98, 161112 CrossRef CAS
.
- X. G. Zhao, C. X. Chen, K. Kaj, I. Hammock, Y. W. Huang, R. D. Averitt and X. Zhang, Optica, 2020, 7, 1548–1554 CrossRef
.
- S. S. Wang and R. Magnusson, Appl. Opt., 1993, 32, 2606–2613 CrossRef CAS PubMed
.
- E. R. Brown, J. E. Bjarnason, A. M. Fedor and T. M. Korter, Appl. Phys. Lett., 2007, 90, 061908 CrossRef
.
- B. J. Han, Z. H. Han, J. Y. Qin, Y. M. Wang and Z. S. Zhao, Talanta, 2019, 192, 1–5 CrossRef CAS PubMed
.
- L. Duvillaret, F. Garet and J. L. Coutaz, Appl. Opt., 1999, 38, 409–415 CrossRef CAS PubMed
.
- T. D. Dorney, R. G. Baraniuk and D. M. Mittleman, J. Opt. Soc. Am. A, 2001, 18, 1562–1571 CrossRef CAS PubMed
.
- M. Askari, H. Pakarzadeh and F. Shokrgozar, J. Opt. Soc. Am. B, 2021, 38, 3929–3936 CrossRef CAS
.
| This journal is © The Royal Society of Chemistry 2023 |

