DOI:
10.1039/D3NA00115F
(Paper)
Nanoscale Adv., 2023,
5, 3267-3278
Control and regulation of the performance of fullerene-based dye-sensitized solar cells with a D–D–A structure by external electric fields†
Received
23rd February 2023
, Accepted 7th April 2023
First published on 19th April 2023
Abstract
We investigated the modulating effect of an electric field (Fext) on the photovoltaic properties of triphenylamine-based sensitizers with a D–D–A structure and compared the photovoltaic parameters at different electric field intensities. The results show that Fext can effectively adjust the photoelectric properties of the molecule. From the change of the parameters that measures the degree of electron delocalization, it can be seen that the Fext can effectively strengthen the electronic communication and promote the charge transfer process within the molecule. And the dye molecule under a strong Fext has a narrower energy gap, more favorable injection, regeneration driving force and a larger conduction band energy level shift, which ensures that the dye molecule can exhibit larger Voc and Jsc under a strong Fext. The results of calculations on the photovoltaic parameters of dye molecules show that dye molecules can exhibit better photovoltaic performance under the action of Fext, which provides beneficial predictions and prospects for the development of highly efficient DSSCs.
1. Introduction
Dye-sensitized solar cells (DSSCs) are a promising photovoltaic technology due to their low raw material cost and high power conversion efficiency (PCE).1 At present, the experimental power conversion efficiency has exceeded 13%,2–5 and the efficiency of small modules has exceeded 10%,6 but compared with traditional Si-based solar cells, its efficiency still needs to be developed. DSSCs are photovoltaic devices that graft photosensitizers and catalysts onto semiconductor electrodes to realize artificial photosynthetic systems.7,8 As an important component of DSSCs, redox-active photosensitizers play a key role in photogeneration of electrons, which affect the device performance by affecting the charge transfer process. In principle, they need to have suitable energy levels to ensure the injection of electrons, the efficient regeneration process of oxidation dyes, and a fast charge transfer process to reduce the occurrence of charge recombination processes.9,10 Currently, metal-based dyes, such as ruthenium (Ru) dye sensitizers, have high PCE efficiencies due to their broad light absorption range and better energy matching with TiO2.11 However, their high cost, metal scarcity, and high-purity methods limit their large-scale application in DSSCs.12,13
Compared with metal-based dyes, metal-free organic sensitizers have been developed as substitutes for metal-based dyes because of their high molar extinction coefficient, low cost and easy purification.14–17 As a donor material, a triphenylamine sensitizer has high electron donating ability and good stability, which is a good choice for DSSCs.18 Intramolecular charge transfer is the most basic reaction in light energy conversion. The photoelectrons are injected from their molecular excited states into the conduction band of TiO2, but the molecules have a strong tendency to aggregate at the semiconductor surface, leading to the aggregation of molecules at the interface.19,20 The propeller-like molecular structure of TPA can not only effectively alleviate the aggregation of molecules at the interface and promote the electron injection process at the interface, but also effectively inhibit the recombination of redox couples (I−/I3−).21 Furthermore, boron dipyrromethene (BODIPY), as a popular sensitizer, possesses a flexible geometry that can easily change its spectral and photophysical properties through minor modifications to its structure.22–24 The characteristics and photovoltaic characteristics of organic sensitizers are directly related to the molecular structure, and the photovoltaic characteristics of the molecules can be improved by structural modification, which in turn can improve the PCE. Sharma et al. formed a triplet PorCOOH-(BDP)2 by covalently bonding two BODIPY groups with 1,3,5-triazine. The introduction of BODIPY not only enhances the light absorption of the dye at 500 nm, but also promotes the electron injection process and improves the energy level alignment of dye regeneration.25
To this end, building on the work of Benitz et al., we investigated a TPA-based dual-donor dye molecule TPA-TT-BODIPY-C60 (Fig. 1), in which triphenylamine (TPA)-tertithiophene (TT) is the first donor and BODIPY is the second donor.26 So far, fullerenes and their derivatives have become promising materials for DSSCs, and the insertion of BODIPY provides a bridge between TPA-TT and fullerenes for efficient charge transfer, which is a good charge transfer promoter.27,28 The formed dual-donor structure can break the light absorption limitation of the D–A system and increase the charge transfer path, thus improving the efficiency of the cell device. In addition, experiments show that TPA-TT-BODIPY-C60 exhibits photoinduced charge separation in polar benzonitrile and non-polar toluene, and the long-lived charge separation state of TPA-TT-BODIPY-C60 is about 20 ns due to the hole displacement mechanism. Considering that the external electric fields (Fext) are usually able to modulate the charge transfer process, an effective intramolecular charge transfer process is a key factor in improving the photovoltaic performance of dyes.29–31 Moreover, so far, there are few reports on the application of Fext to DSSC devices, and the photophysical research of DSSCs under the action of Fext is still lacking. In this context, in order to find effective strategies to improve device performance, the effect of Fext variation on the photovoltaic parameters affecting the device was investigated.
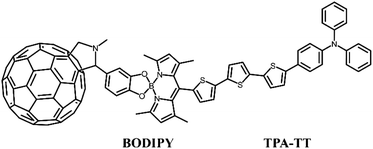 |
| | Fig. 1 Structural formula of TPA-TT-BODIPY-C60. | |
In this study, the electronic structures and light absorption properties of dye molecules at different Fext intensities were calculated by using DFT and TDDFT. The aim was to investigate the effect of Fext on key parameters that have a direct effect on dye short-circuit current density (Jsc) and photovoltage (Voc), which include light harvesting efficiency (LHE), electron injection driving force (ΔGinject), driving force of regeneration (ΔGreg), conduction band shift (ΔECB), etc. It is shown by calculations that the addition of Fext can indeed modulate the photoelectric properties of the TPA-TT-BODIPY molecule. And the increase of electric field strength makes the dye molecules have better ΔGinject, ΔGreg and larger ΔECB, which further enhances the photocurrent and voltage. Therefore, we hope to provide theoretical guidance for further optimization of DSSCs by elaborating the research results of the optoelectronic properties of the dye molecule under the action of the Fext.
2. Calculation details
All calculations in this work were performed using the density functional theory (DFT) and time-dependent DFT(TD–DFT) of the Gaussian 09 software.32–34 The ground-state structures before and after the dye was bound to Ti(OH)3·H2O were optimized by DFT using the B3LYP functional and 6-31G(d) basis set, where the Ti atom was based on the LANL2DZ basis set.35–39 Considering the long-range interaction, the excited-state transition properties before and after dye binding to Ti(OH)3·H2O were calculated using the long-range Coulomb decay CAM-B3LYP functional under TD–DFT theory, and the absorption spectra of the dye were simulated by Multiwfn software.40–42 For studying the effect of solvent on charge transfer, the solvent effect of benzonitrile solvent was simulated in calculations using a polarizable continuous medium model (IEF-PCM) in the form of integral equations.43,44 At the B3LYP/6-31G(d) level, single-point energy calculations were performed on the geometries of the cationic and anionic states of the optimized dye to obtain the total reorganization energy (λtotal) of the dye. Using a finite field approach, the Fext is set in the direction of the x-coordinate (Fig. 2), with the strength between −10 × 10−5–10 × 10−5 a.u., and the effect of the Fext on the parameters affecting the photovoltaic characteristics of the cell is investigated.
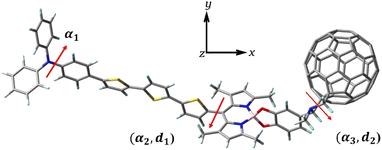 |
| | Fig. 2 Three-dimensional structure of TPA-TT-BODIPY-C60. The Fext is in the direction of the x coordinate. | |
3. Results and discussion
3.1. Molecular structure
It is well known that the charge transfer efficiency of dye molecules is closely related to the molecular structure, and efficient intramolecular charge transfer is a key factor affecting DSSCs. The PCE of DSSCs decreases due to the aggregation of dye molecules, so the aggregation phenomenon of molecules can be improved by changing the structure of molecules appropriately. On the one hand, by improving the molecular aggregation caused by planar molecules, and on the other hand, by the modulating effect of the electric field on improving the charge transfer efficiency, the non-planar dye molecule (TPA-TT-BODIPY) with a double donor structure at different Fext strengths is studied in this paper.
The respective dihedral angles and bond lengths of the studied dye at different Fext strengths are shown in Table 1. α1 is the dihedral angle of the donor (TPA) itself, and α2 and α3 are the dihedral angles between BODIPY and thiophene and the acceptor, respectively (Fig. 2). The α1 is in the range of 43–45°, indicating that the TPA exhibits a distorted conformation to some extent, and the distorted donor structure weakens the accumulation of the dye molecule on the semiconductor surface and improves the electron injection process. The dihedral angles α2 and α3 are in the range of 87° and 98°, respectively, indicating the formation of a torsional structure between BODIPY and thiophene/acceptor, which can effectively improve the π–π aggregation between dye molecules and ensure the improvement of their thermal stability. The bond length d1 between thiophene and BODIPY is about 1.4833 to 1.4835 Å, which is close to the bond length of C![[double bond, length as m-dash]](https://www.rsc.org/images/entities/char_e001.gif) C, which is beneficial for the intramolecular charge transfer. The bond length d2 between BODIPY and the acceptor is in the range of 1.5134–1.5135 Å and gradually shortens with increasing Fext strength, which will facilitate efficient ICT from the BODIPY to the acceptor. In fact, the addition of the Fext had no appreciable effect on these parameters and did not change the molecular structure to a large extent. In fact, the addition of Fext has no obvious effect on these parameters, so it can be seen that Fext does not have a great effect on the molecular structure.
C, which is beneficial for the intramolecular charge transfer. The bond length d2 between BODIPY and the acceptor is in the range of 1.5134–1.5135 Å and gradually shortens with increasing Fext strength, which will facilitate efficient ICT from the BODIPY to the acceptor. In fact, the addition of the Fext had no appreciable effect on these parameters and did not change the molecular structure to a large extent. In fact, the addition of Fext has no obvious effect on these parameters, so it can be seen that Fext does not have a great effect on the molecular structure.
Table 1 Dihedral angles(°) and bond lengths(Å) of TPA-TT-BODIPY in Fext (Fext in 10−5 a.u.)
|
F
ext
|
α
1
|
α
2
|
α
3
|
d
1
|
d
2
|
| −10 |
43.838 |
87.412 |
98.064 |
1.48345 |
1.51346 |
| −7 |
43.965 |
87.404 |
98.082 |
1.48342 |
1.51344 |
| −5 |
44.054 |
87.383 |
98.078 |
1.48342 |
1.51343 |
| −3 |
44.151 |
92.376 |
98.084 |
1.48342 |
1.51342 |
| −1 |
43.840 |
92.376 |
98.476 |
1.48344 |
1.5131 |
| 0 |
44.266 |
87.369 |
98.098 |
1.4834 |
1.5134 |
| 1 |
44.295 |
87.357 |
98.089 |
1.48338 |
1.5134 |
| 3 |
44.396 |
87.336 |
98.094 |
1.48337 |
1.51339 |
| 5 |
44.481 |
87.322 |
98.097 |
1.48336 |
1.51338 |
| 7 |
44.578 |
87.351 |
98.102 |
1.48336 |
1.51337 |
| 10 |
44.715 |
87.164 |
98.107 |
1.48332 |
1.51336 |
3.2. Electronic structure
In DSSCs, the efficient charge-separated states are closely related to the electronic excitation of the frontier molecular orbitals. To gain insight into the correlation between electronic properties and the molecular structure at different Fext intensities, we mapped the electron density of frontier molecular orbitals (FMOs) of dye molecules at different Fext intensities. As shown in Fig. 3, the highest occupied molecular orbital (HOMO) is distributed on the donor TPA-TT and the lowest unoccupied molecular orbital (LUMO) is distributed on the acceptor C60. This distribution can effectively separate the charges, making the long-distance charge transfer process easier to occur. The HOMO to LUMO transition can result in charge transfer from TPA-TT to C60, resulting in electron injection. Under the effect of the Fext, the electron densities of FMOs of dye molecules are less affected by the Fext and show similar distribution characteristics.
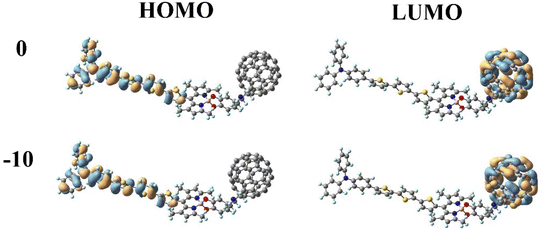 |
| | Fig. 3 Frontier molecular orbitals (FMOs) of TPA-TT-BODIPY in Fext (Fext in 10−5 a.u.). | |
The energy level of the dye molecule is a key factor affecting electron injection and dye regeneration. As shown in Fig. 4, under different Fext conditions, the LUMOs of the dye located above the conduction band of TiO2 (−4.0 eV) indicate that the excited dye has efficient charge injection capability. The HOMOs of the dye are lower than the redox potential of the electrolyte (I−/I3−), which ensures that the dye that loses electrons can gain electrons from the electrolyte, thereby realizing the dye regeneration process. At Fext = 10 × 10−5 a.u., the energy level of the HOMO is −3.09 eV, which is 0.09 eV lower compared to −3.00 eV at Fext = −10 × 10−5 a.u., as shown in the schematic energy diagram in Fig. 4. We found that when the Fext strength changes, the LUMO energy level is relatively stable, but the HOMO–LUMO energy gap (Eg) becomes smaller and smaller. Therefore, it can be seen that the change mainly comes from the effect of the Fext on the stability of the HOMO. The reduced energy gap makes the molecule more easily excited, improves the light absorption capacity of the molecule in the long wavelength region, and further improves the power conversion efficiency. The charge transfer reaction is the most fundamental reaction in light energy conversion and is an important factor affecting the conversion efficiency. In our previous work, it was found that in the TPA-TT-BODIPY-C60 molecule, charge transfer occurred not only between C60 and the two electron donors, but also between the two electron donors due to the difference in electron donating ability. This opens up more possibilities for multiple charge transfer pathways.
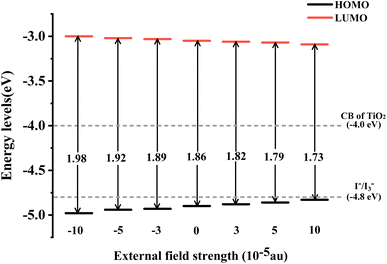 |
| | Fig. 4 Schematic energy diagram of TPA-TT-BODIPY in Fext. | |
3.3. Nonlinear optical properties
Dye molecules are receiving increasing attention for their good nonlinear optical (NLO) response for a wide range of applications in data storage, sensors, etc. The impact is that electronic properties of the molecule are the key factors affecting the NLO properties, and materials with low energy gaps and efficient charge transfer efficiency exhibit good NLO properties. The change in hyperpolarizability (β) is an indicator of nonlinear optical properties and is a key parameter to measure the degree of electron delocalization. We investigated the correlation between the electric field, NLO properties and molecular structure by calculating the hyperpolarizability of the dye at different electric field strengths. According to the FF method combined with the electronic structure method the first hyperpolarizability (βtot) is expressed as:45,46| |  | (1) |
where βx, βy and βz are the components of the second-order polarizability tensor along the x, y, and z directions, respectively, and the first hyperpolarizability is a third-order tensor that can be further represented by the component matrix traces:| | | βx = βxxx + βxyy + βxzz | (2) |
| | | βy = βyyy + βxxy + βzzy | (3) |
| | | βz = βzzz + βxxz + βyyz | (4) |
The calculated first hyperpolarizabilities of the dye molecules and their x, y, and z components are shown in Table 2. The βtot of the dye is 4297 a.u. in the absence of Fext. Compared with βtot in Fext = 0, the hyperpolarizability of the dye at all Fext intensities is improved, indicating that the addition of Fext can indeed increase the β value of dye molecules. In the case of increasing Fext strength, βtot exhibits a gradually increasing trend, which is consistent with the change in the energy gap. A decrease in the energy gap makes the electron excitation easier, and the hyperpolarizability increases. The β values of the three components were compared, and it was found that the β value in the x direction was significantly larger than the β value in the y/z direction, indicating that the first hyperpolarizability was mainly contributed by the x-direction, indicating that the charge transfer was mainly along the x-direction. Moreover, under the external electric conditions, |βxxx| at Fext = 10 × 10−5 a.u. produces an increment of 524 relative to |βxxx| = 3435 at Fext = −10 × 10−5 a.u. This indicates that the increase mainly originates from the charge transfer direction (X direction), which also proves that the βtot can promote electron excitation and thus modulate the NLO properties. For asymmetric systems the dipole moment is the most commonly used physical indicator to determine the polarity of a molecule, which essentially reflects the separation of the positive and negative charge centers of the system. We found that the dipole moment increases with increasing electric field by calculating the dipole moment under different electric fields (Table S1†), which further supports the results obtained from the βtot.
Table 2 Hyperpolarizability (a.u.) of the dye in Fext(Fext in 10−5 a.u.)
|
F
ext
|
β
xxx
|
β
xyy
|
β
xzz
|
β
yyy
|
β
xxy
|
β
zzy
|
β
zzz
|
β
xxz
|
β
yyz
|
β
xyz
|
β
tot
|
| −10 |
−3435 |
−549 |
−350 |
−226 |
−144 |
−132 |
40 |
123 |
94 |
−182 |
4363 |
| −7 |
−3514 |
−551 |
−351 |
−225 |
−143 |
−132 |
40 |
124 |
−225 |
−183 |
4455 |
| −5 |
−3566 |
−552 |
−352 |
−225 |
−142 |
−132 |
40 |
125 |
95 |
−183 |
4498 |
| −3 |
−3619 |
−553 |
−352 |
−225 |
−141 |
−132 |
40 |
126 |
95 |
−183 |
4552 |
| −1 |
−3661 |
−562 |
−341 |
−254 |
−196 |
−127 |
16 |
138 |
70 |
−145 |
4601 |
| 0 |
−3404 |
−552 |
−308 |
−255 |
−146 |
−127 |
111 |
36 |
91 |
−214 |
4297 |
| 1 |
−3721 |
−556 |
−354 |
−225 |
−140 |
−132 |
41 |
128 |
95 |
−184 |
4657 |
| 3 |
−3774 |
−557 |
−354 |
−224 |
−139 |
−132 |
41 |
128 |
95 |
−184 |
4712 |
| 5 |
−3826 |
−558 |
−355 |
−224 |
−138 |
−132 |
41 |
129 |
95 |
−185 |
4765 |
| 7 |
−3879 |
−560 |
−356 |
−224 |
−138 |
−132 |
−356 |
130 |
96 |
−185 |
4836 |
| 10 |
−3959 |
−560 |
−357 |
−224 |
−137 |
−131 |
42 |
130 |
96 |
−186 |
4902 |
3.4. Dye adsorption on TiO2
We further evaluated the light-absorbing ability of the dye molecules by calculating the UV-vis absorption spectra of the dye molecule. Fig. 5 shows the absorption spectra of the dye obtained by Gaussian broadening (broadening parameter of 0.3 eV). The spectrum is mainly composed of two absorption bands, with the main absorption band appearing at 394–453 nm, as shown in Fig. 5. The excitation parameters of the excited states corresponding to the strongest absorption peaks at different Fext intensities are shown in Table 3. However, at different Fext intensities, its absorption spectrum does not change much, which can be seen from the change of its maximum absorption wavelength. Under the condition of Fext = 0, the strongest absorption peak is mainly contributed by the excited states of S8, S12 and S15, and the corresponding maximum absorption wavelength is 420 nm. The corresponding oscillator strengths are 0.3707, 1.5667 and 0.5095, indicating that the strongest absorption peak is mainly contributed by S12, and the excited state parameters of the other excited state are shown in Table S2.† For S12, it can be seen from its charge density difference (CDD) (Fig. 5b) that electrons and holes are distributed on fullerenes and BODIPY, respectively, which can identify S12 as intramolecular charge transfer excitation from BODIPY to fullerene. When the Fext strength increases, the absorption peak appears slightly red-shifted, and the maximum absorption wavelength and oscillator strength also change accordingly.
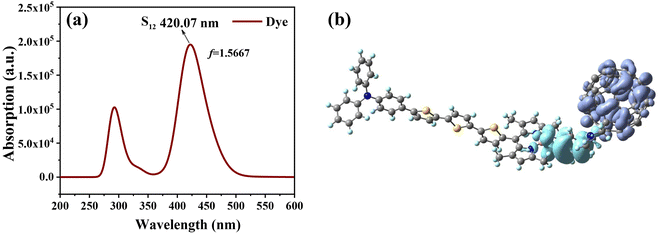 |
| | Fig. 5 Simulated UV-vis absorption spectrum of the dye molecule (a) and charge density difference (CDD) of S12 (b); in CDD, purple represents electrons and blue represents holes. | |
Table 3 Electronic transition energy (ΔE), maximum absorption wavelength (λmax), oscillator strength (f) and main configuration of the dye molecule in Fext (Fext in 10−5 a.u.)a
|
F
ext
|
State |
ΔE/eV |
λ
max/nm |
f
|
Main configuration |
|
In CI, H is the HOMO and L is the LUMO.
|
| −10 |
12 |
2.9652 |
418.12 |
1.7877 |
61.56% (H–L+4) |
| −7 |
12 |
2.9613 |
418.68 |
1.7405 |
59.15% (H–L+4) |
| −5 |
12 |
2.9587 |
419.0 |
1.6976 |
59.15% (H–L+4) |
| −3 |
12 |
2.9559 |
419.45 |
1.6512 |
55.04% (H–L+4) |
| 0 |
12 |
2.9515 |
420.07 |
1.5667 |
51.39% (H–L+4) |
| 3 |
12 |
2.9460 |
420.85 |
1.4700 |
47.37% (H–L+4) |
| 5 |
12 |
2.9423 |
421.38 |
1.3961 |
44.44% (H–L+4) |
| 7 |
12 |
2.9390 |
421.87 |
1.3123 |
41.35% (H–L+5) |
| 10 |
11 |
2.9303 |
423.11 |
1.2125 |
36.77% (H–L+5) |
The DFT theory was used to simulate the adsorption structure of the dye and TiO2 (Fig. 6), and to study the interaction between the dye and semiconductor surfaces. The dye molecule is connected by a carboxylic acid group and TiO2via a bidentate bridging, and has been shown to be the most stable chemisorption model.47,48 We considered different Fext strengths to study the effect of Fext on the energy gap. The carboxylic acid-linked bidentate bridge enables the adsorption of molecules on the Ti(OH)3·H2O surface, and the stability of this bidentate bridge adsorption mode makes it the preferred adsorption mode. To gain more insight into the electronic coupling between the dye and the TiO2 conduction band, we calculated the electronic structure of the dye-TiO2 system, and the energy levels of the FMOs are shown in Table 4.
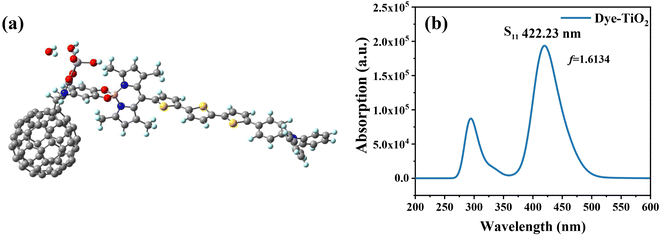 |
| | Fig. 6 Three-dimensional structure of dye-TiO2 (a), and simulated UV-vis absorption spectrum of dye-TiO2 (b). | |
Table 4 LUMO level, HOMO level and energy gap of the dye and dye-TiO2 in Fext (Fext in 10−5 a.u.)
|
F
ext
|
Dye |
Dye-TiO2 |
| LUMO |
HOMO |
E
g
|
LUMO |
HOMO |
E
g
|
| −10 |
−3.00 |
−4.98 |
1.98 |
−3.14 |
−4.82 |
1.67 |
| −7 |
−3.02 |
−4.96 |
1.94 |
−3.13 |
−4.84 |
1.71 |
| −5 |
−3.02 |
−4.94 |
1.92 |
−3.12 |
−4.86 |
1.73 |
| −3 |
−3.03 |
−4.93 |
1.89 |
−3.11 |
−4.87 |
1.76 |
| −1 |
−3.04 |
−4.91 |
1.87 |
−3.11 |
−4.89 |
1.78 |
| 0 |
−3.05 |
−4.90 |
1.86 |
−3.10 |
−4.90 |
1.79 |
| 1 |
−3.05 |
−4.90 |
1.84 |
−3.11 |
−4.90 |
1.80 |
| 3 |
−3.06 |
−4.88 |
1.82 |
−3.10 |
−4.92 |
1.82 |
| 5 |
−3.07 |
−4.86 |
1.79 |
−3.09 |
−4.93 |
1.84 |
| 7 |
−3.08 |
−4.85 |
1.77 |
−3.08 |
−4.95 |
1.87 |
| 10 |
−3.09 |
−4.83 |
1.73 |
−3.07 |
−4.97 |
1.90 |
As shown in Table 4, under the condition of Fext = 0, the HOMO of the dye-TiO2 did not change compared to that of a single dye, while the LUMO level decreased significantly, resulting in a smaller energy gap. The decrease of the LUMO level indicates that the dye and the TiO2 conduction band have strong electronic coupling, which is favorable for the electron injection process. In fact, the changes in the HOMO and LUMO under the Fext are opposite to those of a single dye, which leads to a somewhat larger energy gap with increasing Fext. In the range of Fext = −10 to 3 × 10⁻⁵ a.u., the energy gap of dye-TiO2 is lower than that of a single dye, indicating that negative and weak electric fields are more favorable for electron injection.
The combination of the dye with Ti(OH)3·H2O causes a change in the optical properties of the dye. Therefore, using the TD–DFT method, the UV-vis absorption spectrum of dye-TiO2 was calculated, and the corresponding excited state parameters are shown in Table 5. The absorption spectra of the dye-TiO2 are not very different from those of a single dye, and their main absorption bands are mainly distributed in the range of 410–453 nm, as shown in Fig. 6. When there is no electric field, the maximum absorption wavelength of dye-TiO2 has a slight blue shift, and the oscillator strength is also improved. Unlike the dye alone, the maximum absorption wavelength of the dye-TiO2 system under a negative Fext corresponds to S11. Under the action of a positive Fext, the corresponding oscillator strength also increases, and with the increase of the Fext, its maximum absorption wavelength also gradually exhibits a blue shift, which is opposite to the case of a single dye. The main orbital contribution of dye-TiO2 corresponding to λmax shows that the orbital contribution of dye-TiO2 is slightly different from that of the separated dye as well. This may be due to the appearance of new excitons in the interaction of the dye with TiO2.
Table 5 Electronic transition energy (eV), maximum absorption wavelength (λmax), oscillator strength (f), and main configuration of dye-TiO2 in Fext (Fext in 10−5 a.u.)a
|
F
ext
|
State |
ΔE/eV |
λ
max/nm |
f
|
Main configuration |
|
In CI, H is the HOMO and L is the LUMO.
|
| −10 |
11 |
2.9167 |
425.08 |
1.3001 |
40.63% (H–L+5) |
| −7 |
11 |
2.9235 |
424.1 |
1.4037 |
44.77% (H–L+5) |
| −5 |
11 |
2.9273 |
423.54 |
1.4698 |
47.45% (H–L+5) |
| −3 |
11 |
2.9313 |
422.97 |
1.5309 |
50.01% (H–L+5) |
| 0 |
11 |
2.9364 |
422.23 |
1.6134 |
53.53% (H–L+4) |
| 3 |
12 |
2.9604 |
420.85 |
2.0115 |
73.44% (H–L+4) |
| 5 |
12 |
2.9621 |
418.57 |
2.0263 |
74.29% (H–L+4) |
| 7 |
12 |
2.9648 |
418.19 |
2.0191 |
74.14% (H–L+4) |
| 10 |
12 |
2.9672 |
417.84 |
2.0206 |
74.63% (H–L+4) |
3.5. Reorganization energy, IP, EA and chemical reactivity
The energy required for the reorganization of the molecular structure during charge migration is a key parameter affecting the degree of charge migration, i.e., the reorganization energy. The reorganization energy mainly comes from two parts, one part comes from the difference in the molecular structure before and after charge transfer, which is called internal reorganization energy. The other part comes from the influence of the solvent medium on charge transfer, i.e., the external reorganization energy, but it is difficult to estimate with theoretical accuracy. In our calculations, the changes in internal reorganization energy under different electric fields were calculated, and then the regulation of charge carrier mobility by using the electric field was investigated. In general, the reorganization energy is negatively correlated with the charge mobility, and a smaller reorganization energy is an important factor to ensure good current density. The total internal reorganization energy (λtotal) is determined by both electron reorganization energy (λe) and hole reorganization energy (λh), which can be calculated by using the following equation:49,50| | | λe = (E0− − E−) + (E−0 − E0) | (5) |
| | | λh = (E0+ − E+) + (E+0 − E0) | (6) |
E0−(E0+) is the energy of the anion (cation) based on the optimal ground state geometry, where E−(E+) is the energy of the optimal anion (cation) geometry, E−0(E+0) is the energy of the neutral dye based on the optimal anion (cation) geometry, and E0 is the energy of the optimal ground state geometry. The reorganization energies of the dye molecule at different Fext are shown in Fig. 7. First, it can be seen from Fig. 7a that when Fext = 0, λe = 0.138 eV and λh = 0.262 eV, λh is obviously larger than λe, indicating that the electron transfer rate is larger than the hole transfer rate. And in the negative electric field range, except for Fext = −10 × 10−5 a.u., the λe under other electric fields is larger than λh, which is opposite to the case of no electric field, indicating that the direction of the electric field does have an impact on the charge transfer. Furthermore, the results show that λh tends to decrease as the electric field increases; however, the variation of λe with electric field is somewhat different. Compared with the gradual change of λh, the large increase of λe when Fext = −1 × 10⁻⁵ a.u. indicates that the electron mobility is more sensitive to the direction of the electric field. Compared to 0.8296 eV at Fext = −10 × 10−5, λh at Fext = 10 × 10−5 a.u. is reduced by 0.39 eV. Comparing the changes of λh and λe at different electric field strengths shows that, overall, the change of λh is larger than that of λe. It can be seen that although the variation trends of λh and λe with the electric field strength are different, when the electric field increases, both have a certain decrease, and λtotal also decreases (see Fig. 7b), indicating that the introduction of the forward Fext can indeed promote the charge transfer of the dye.
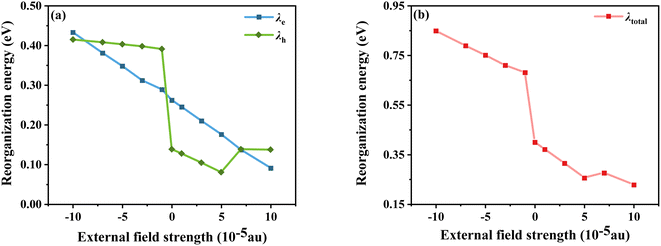 |
| | Fig. 7 Electron and hole reorganization energy (a) and total internal reorganization energy (b) in Fext. | |
In addition, the energy barriers for hole and electron injection can be predicted by the ionization potential (IP) and electron affinity potential (EA). IP denotes the energy change of absorbed holes (or injected electrons) and EA denotes the energy change of added electrons (or injected holes), which can be expressed as:51
In general, a lower IP is favorable to improve ability of hole injection, and a higher EA is favorable to improve the ability of electron injection. As shown in
Fig. 8, IP and EA are decreasing and increasing, respectively, with the change in electric field strength. Relative to IP = 4.884 eV and EA = 3.074 eV at
Fext = −10 × 10
−5 a.u., IP decreases by about 0.157 eV and EA produces an increment of 0.091 eV at
Fext = 10 × 10
−5 a.u. From the trends of IP and EA with the
Fext, it can be seen that the dye injection ability is continuously improved with the increase in the
Fext.
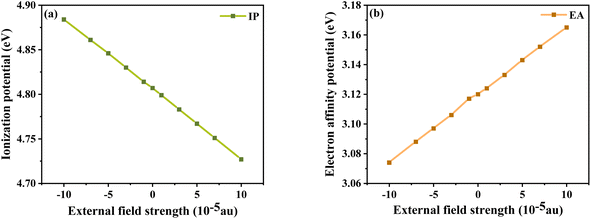 |
| | Fig. 8 Ionization potential (a) and electron affinity potential (b) in Fext. | |
The chemical reaction parameters also affect the optoelectronic properties of DSSCs, so the changes in the chemical reaction parameters of the dye under different electric field strengths were investigated.52 Among them, the chemical hardness (h), which is related to the stability and reactivity of the molecular system, describes the resistance to changes in intramolecular charge transfer. As shown in Fig. 9a, the values gradually decrease under the Fext, indicating that its intramolecular charge transfer characteristics are enhanced with the addition of the Fext. Not only the propensity or ability of a dye to accept electrons can be assessed by measuring the electrophilic index (ω); this index is a measure of the stability of a molecular system after gaining an electron. As shown in Fig. 9b, with the increase of the Fext, ω gradually increases, that is, its energy stability after accepting electrons gradually increases. The electron accepting power (ω+) evaluated the electron-accepting ability, and the gradually increasing ω+ under the electric field change indicated the improvement of the electron-attracting ability of the acceptor part, which ensured a good photocurrent efficiency, as seen in Fig. 9c. Thus, in terms of chemical reaction parameters, the dye molecules under the action of a strong electric field exhibit excellent performance.
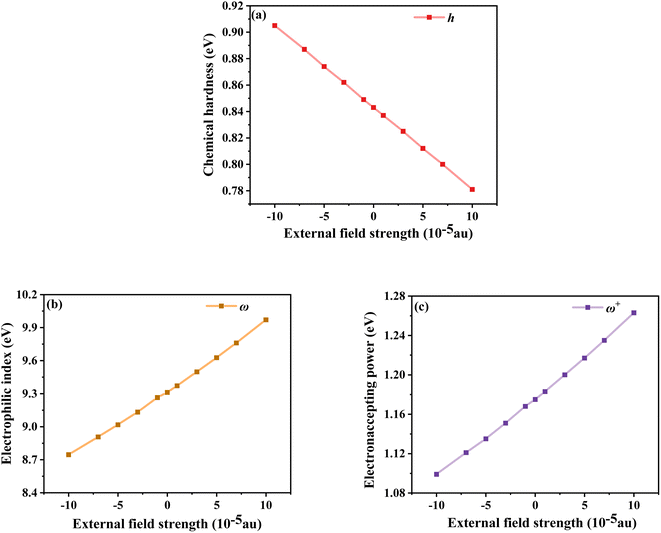 |
| | Fig. 9 Chemical hardness (a), electrophilic index (b) and electron accepting power (c) in Fext. | |
3.6. Parameters affecting the photovoltaic characteristics of cells
In general, as an important parameter to measure the performance of dyes, PCE (η) can be defined as:53| |  | (10) |
where Jsc is the short-circuit current density, Voc is the open-circuit voltage, Pin is the incident solar energy on the cell, and FF is the fill factor. The FF can be expressed as the ratio of the maximum power of the solar cell to the product of Jsc and Voc; however, it is difficult to describe the FF quantitatively because of the complexity of the cell operation process. However, we can characterize the effect of Jsc and Voc on the photovoltaic performance of dyes by quantitatively characterizing the parameters that have a major effect on Jsc and Voc. Jsc in DSSCs can be expressed as:| |  | (11) |
where ϕinject is the electron injection efficiency and ηcollect is the charge collection efficiency. The same DSSC under different dye conditions has the same ηcollect, so ηcollect can be assumed to be a constant. LHE(λ) is the light-harvesting efficiency at the maximum absorption wavelength (λmax), and according to the definition of LHE (LHE(λ) = 1–10−f), high oscillator strength can ensure better light capture efficiency.47,54 To study the effect of Fext on the light response, we calculated the light collection efficiency at the maximum absorption wavelength under different electric fields. The calculated results (Fig. 10) show that the LHE value is close to 1 and the dye molecule has good light trapping ability. Under the action of an electric field, the addition of a negative directional electric field increases the LHE compared to the action of a positive electric field, and the light trapping ability of the dye is the strongest at Fext = −10 × 10−5 a.u.
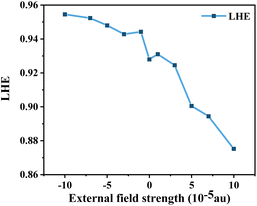 |
| | Fig. 10 Light-harvesting efficiency (LHE) in Fext. | |
On the basis of the efficient light-harvesting ability of dyes, more importantly, the injection of electrons into semiconductors is converted into electric current by means of charge transfer. So enhancing the electron injection efficiency (ϕinject) of dyes is another way to improve Jsc. The ϕinject is closely associated with the electron injection driving force (ΔGinject), which can be defined as:47,54,55
| |  | (12) |
where

and
Edye are the excited state oxidation potential and ground state redox potential of the dye, respectively,
Eλmax is the transition energy at
λmax, and
ECB is the reduction potential at the edge of the TiO
2 conduction band, which is usually taken to be −4.0 eV. On the other hand, the ability of dyes to acquire electrons from the electrolyte (dye regeneration) is also a key factor affecting the performance of DSSCs, and the regeneration efficiency can be estimated by quantifying the driving force of regeneration (Δ
Greg). According to the redox potential of electrolyte solutions
I−/
I3−, Δ
Greg can be defined as:
| | | ΔGreg = EI−/I3− − Edye | (13) |
The calculated  , Edye, ΔGinject and ΔGreg at different electric fields are shown in Fig. 11. First, it can be found that the calculated ΔGinject is less than zero, and the charge injection process can proceed spontaneously. And the absolute value of ΔGinject is greater than 0.2 eV under all electric field conditions, and the dye molecules have good electron injection efficiency. Moreover, the absolute value of ΔGinject shows an increasing trend when the electric field increases, indicating that the addition of the Fext can further promote the electron injection process of dye molecules. As shown in Fig. 11b, with the change of the Fext, the absolute value of ΔGreg gradually decreases, indicating that the Fext can also improve the regeneration efficiency of the dye. The increase of ΔGinject and the decrease of ΔGreg in general are favorable conditions to ensure a good Jsc. Therefore, the addition of the Fext increases the possibility for making dye molecules with higher Jsc.
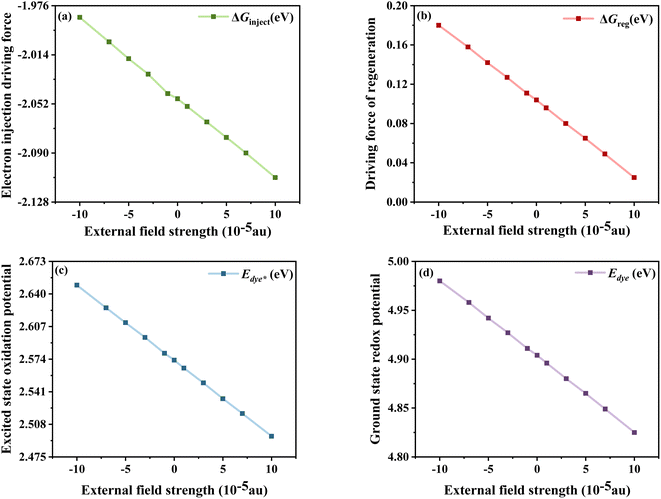 |
| | Fig. 11 Electron injection driving force (a), driving force of regeneration (b), excited state oxidation potential of the dye (c) and ground state redox potential of the dye (d) in Fext. | |
According to eqn (10), the Voc is also an effective factor affecting the cells of dye-sensitized solar energy, which is expressed as:56,57
| |  | (14) |
where
ECB is the conduction band edge of the semiconductor,
q is the unit charge,
kT is the thermal energy at room temperature.
nc and
NCB are the number of electrons and the density of states in the conduction band, and
Eredox is the oxidation potential of the electrolyte. For the same dye molecule,
Voc is mainly controlled by the change in the conduction band energy level. The adsorption of dyes can cause charge redistribution, and the change of the electronic structure of TiO
2 will inevitably cause the shift of the
ECB (Δ
ECB), which in turn affects
Voc. Below we discuss how different electric field intensities affect the shift of the
ECB induced by dye adsorption, which in turn affects
Voc.
Using density functional theory, the total density of states (TDOS) of the dye-TiO2 system and the partial density of states (PDOS) of the Ti(OH)3·H2O monomer were calculated at the B3LYP/6-31G(d) (LANL2DZ for Ti) level.58 Smaller clusters may not accurately describe the dye–semiconductor interaction, but our main concern is the relative change of the dye under different electric fields, which should have little effect on the accuracy of the results. Then a linear fit is performed through the low energy range curve (−5 to −3 eV) to obtain the intercept point of the curve with the energy axis. The difference between the intercepts of the TDOS and PDOS lines and the energy axis is ΔECB (see Fig. 12). As shown in Fig. 12d, the sensitizer adsorption under different Fext can induce the shift of ECB to different degrees. Obviously, ΔECB generally shows a gradually increasing trend under the change of the Fext. It shows that the dye under the action of strong Fext will show stronger Voc, and then show excellent photovoltaic properties.
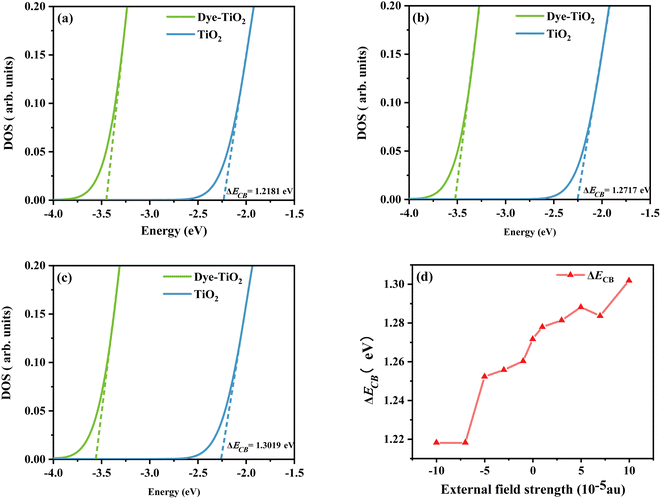 |
| | Fig. 12 Schematic diagram of the model to evaluate the ΔECB due to dye adsorption under the action of Fext = −10 (a), Fext = 0 (b), and Fext = 10 (c), and the variation curve (d) of the ΔECB in Fext (Fext in 10−5 a.u.). | |
4. Conclusion
Using DFT and TD–DFT theories, the photoelectric properties of D–D–A structured dye molecules under the action of the Fext were systematically investigated with the aim of further improving the PCE of DSSCs. We understand the effect of the Fext on the photovoltaic properties of DSSCs by evaluating the key role of relevant parameters affecting PCE. The results show that the dye, under the action of the positive electric field, has better optoelectronic properties than the negative electric field. First, the key photovoltaic properties (ΔGinject, ΔGreg and λtotal) under a positive electric field showed significant improvement, indicating that the photocurrent conversion efficiency can be improved to a certain extent. And under the change in electric field strength, the electron affinity ω showed a gradually increasing trend, indicating that the energy stability of the acceptor after accepting electrons gradually increased, ensuring the energy stability of the charge transfer process. Furthermore, the gradual increase in the change of the conduction band level (ΔECB) will contribute to better Voc performance. Based on the above discussion, it is hoped that these results of DSSCs under the action of the Fext can provide a theoretical model and provide a valuable reference for the development of more efficient DSSCs in the future.
Conflicts of interest
There are no conflicts to declare.
Acknowledgements
This work was supported by the National Natural Science Foundation of China (Grant No. 11974152), the Science program of the Liaoning Provincial Department of Education (LJKZ0097), and the intercollegiate cooperation project of colleges and universities of Liaoning Provincial Department of Education.
References
- Q. Huaulmé, V. M. Mwalukuku, D. Joly, J. Liotier, Y. Kervella, P. Maldivi, S. Narbey, F. Oswald, A. J. Riquelme, J. A. Anta and R. Demadrille, Nat. Energy, 2020, 5, 468–477 CrossRef PubMed.
- J.-M. Ji, H. Zhou, Y. K. Eom, C. H. Kim and H. K. Kim, Adv. Energy Mater., 2020, 10, 2000124 CrossRef CAS.
- D. Zhang, M. Stojanovic, Y. Ren, Y. Cao, F. T. Eickemeyer, E. Socie, N. Vlachopoulos, J.-E. Moser, S. M. Zakeeruddin, A. Hagfeldt and M. Grätzel, Nat. Commun., 2021, 12, 1777 CrossRef CAS PubMed.
- K. Kakiage, Y. Aoyama, T. Yano, K. Oya, J.-i. Fujisawa and M. Hanaya, Chem. Commun., 2015, 51, 15894–15897 RSC.
- Z. Yao, H. Wu, Y. Li, J. Wang, J. Zhang, M. Zhang, Y. Guo and P. Wang, Energy Environ. Sci., 2015, 8, 3192–3197 RSC.
- M. A. Green, K. Emery, Y. Hishikawa, W. Warta and E. D. Dunlop, Prog. Photovoltaics, 2016, 24, 3–11 Search PubMed.
- F. A. Black, C. J. Wood, S. Ngwerume, G. H. Summers, I. P. Clark, M. Towrie, J. E. Camp and E. A. Gibson, Faraday Discuss., 2017, 198, 449–461 RSC.
- M. K. Brennaman, R. J. Dillon, L. Alibabaei, M. K. Gish, C. J. Dares, D. L. Ashford, R. L. House, G. J. Meyer, J. M. Papanikolas and T. J. Meyer, J. Am. Chem. Soc., 2016, 138, 13085–13102 CrossRef CAS PubMed.
- Y. Li, X. Li and Y. Xu, Spectrochim. Acta, Part A, 2020, 234, 118241 CrossRef CAS PubMed.
- Y. Hao, W. Yang, L. Zhang, R. Jiang, E. Mijangos, Y. Saygili, L. Hammarström, A. Hagfeldt and G. Boschloo, Nat. Commun., 2016, 7, 13934 CrossRef CAS PubMed.
- K. Cai, H. Wu, T. Hua, C. Liao, H. Tang, L. Wang and D. Cao, Dyes Pigm., 2022, 197, 109922 CrossRef CAS.
- M. Hosseinnezhad, S. Nasiri, M. Fathi, M. Ghahari and K. Gharanjig, Opt. Mater., 2022, 124, 111999 CrossRef CAS.
- P. S. Gangadhar, A. Jagadeesh, M. N. Rajesh, A. S. George, S. Prasanthkumar, S. Soman and L. Giribabu, Adv. Mater., 2022, 3, 1231–1239 RSC.
- L. Jin, S. Shi, C. Zhao, X. Yu, J. Lu, Q. Wang and Y. Wei, J. Power Sources, 2021, 481, 228952 CrossRef CAS.
- A. K. Singh, A. N. Veetil and J. Nithyanandhan, ACS Appl. Energy Mater., 2021, 4, 3182–3193 CrossRef CAS.
- M. Miyashita, K. Sunahara, T. Nishikawa, Y. Uemura, N. Koumura, K. Hara, A. Mori, T. Abe, E. Suzuki and S. Mori, J. Am. Chem. Soc., 2008, 130, 17874–17881 CrossRef CAS PubMed.
- A. Mishra, M. K. Fischer and P. Bäuerle, Angew. Chem., Int. Ed. Engl., 2009, 48, 2474–2499 CrossRef CAS PubMed.
- L. Han, J. Liu, Y. Liu and Y. Cui, J. Mol. Struct., 2019, 1180, 651–658 CrossRef CAS.
- T. G. Deepak, G. S. Anjusree, S. Thomas, T. A. Arun, S. V. Nair and A. Sreekumaran Nair, RSC Adv., 2014, 4, 17615–17638 RSC.
- H. Li, Y. Hou, Y. Yang, R. Tang, J. Chen, H. Wang, H. Han, T. Peng, Q. Li and Z. Li, ACS Appl. Mater. Interfaces, 2013, 5, 12469–12477 CrossRef CAS PubMed.
- S. Kotteswaran and P. Ramasamy, New J. Chem., 2021, 45, 2453–2462 RSC.
- G. R. Kandregula, S. Mandal, G. Prince, S. K. Yadav and K. Ramanujam, New J. Chem., 2020, 44, 4877–4886 RSC.
- L. Jean-Gérard, W. Vasseur, F. Scherninski and B. Andrioletti, Chem. Commun., 2018, 54, 12914–12929 RSC.
- R. S. Rao, B. Yadagiri, G. D. Sharma and S. P. Singh, Chem. Commun., 2019, 55, 12535–12538 RSC.
- G. D. Sharma, S. A. Siddiqui, A. Nikiforou, G. E. Zervaki, I. Georgakaki, K. Ladomenou and A. G. Coutsolelos, J. Mater. Chem. C, 2015, 3, 6209–6217 RSC.
- A. Benitz, M. B. Thomas, Y. Jang, V. Nesterov and F. D'Souza, J. Chem. Sci., 2021, 133, 71 CrossRef CAS.
- P. Besalu-Sala, A. A. Voityuk, J. M. Luis and M. Sola, Phys. Chem. Chem. Phys., 2021, 23, 5376–5384 RSC.
- S. Mukherjee, F. Libisch, N. Large, O. Neumann, L. V. Brown, J. Cheng, J. B. Lassiter, E. A. Carter, P. Nordlander and N. J. Halas, Nano Lett., 2013, 13, 240–247 CrossRef CAS PubMed.
- X. Lu, Y. Sun and W. Hu, J. Mater. Chem. A, 2021, 9, 21044–21050 RSC.
- P. Song, Y. Li, F. Ma and M. Sun, J. Mater. Chem. C, 2015, 3, 4810–4819 RSC.
- P. Song, Y. Li, F. Ma, T. Pullerits and M. Sun, J. Phys. Chem. C, 2013, 117, 15879–15889 CrossRef CAS.
-
M. J. Frisch, G. W. Trucks, H. B. Schlegel, G. E. Scuseria, M. A. Robb, J. R. Cheeseman, G. Scalmani, V. Barone, G. A. Petersson, H. Nakatsuji, X. Li, M. Caricato, A. V. Marenich, J. Bloino, B. G. Janesko, R. Gomperts, B. Mennucci, H. P. Hratchian, J. V. Ortiz, A. F. Izmaylov, J. L. Sonnenberg, D. Williams-Young, F. Ding, F. Lipparini, F. Egidi, J. Goings, B. Peng, A. Petrone, T. Henderson, D. Ranasinghe, V. G. Zakrzewski, J. Gao, N. Rega, G. Zheng, W. Liang, M. Hada, M. Ehara, K. Toyota, R. Fukuda, J. Hasegawa, M. Ishida, T. Nakajima, Y. Honda, O. Kitao, H. Nakai, T. Vreven, K. Throssell, J. A. Montgomery Jr, J. E. Peralta, F. Ogliaro, M. J. Bearpark, J. J. Heyd, E. N. Brothers, K. N. Kudin, V. N. Staroverov, T. A. Keith, R. Kobayashi, J. Normand, K. Raghavachari, A. P. Rendell, J. C. Burant, S. S. Iyengar, J. Tomasi, M. Cossi, J. M. Millam, M. Klene, C. Adamo, R. Cammi, J. W. Ochterski, R. L. Martin, K. Morokuma, O. Farkas, J. B. Foresman and D. J. Fox, Gaussian 09, Gaussian, Inc., Wallingford CT, 2016 Search PubMed.
- P. Hohenberg and W. Kohn, Phys. Rev., 1964, 136, B864–B871 CrossRef.
- E. K. Gross and W. Kohn, Phys. Rev. Lett., 1985, 55, 2850–2852 CrossRef CAS PubMed.
- A. D. Becke, Phys. Rev. A, 1988, 38 6, 3098–3100 CrossRef PubMed.
- V. A. Rassolov, M. A. Ratner, J. A. Pople, P. C. Redfern and L. A. Curtiss, J. Comput. Chem., 2001, 22, 976–984 CrossRef CAS.
- J. D. Dill and J. A. Pople, J. Chem. Phys., 1975, 62, 2921–2923 CrossRef CAS.
- M. M. Francl, W. J. Pietro, W. J. Hehre, J. S. Binkley, M. S. Gordon, D. J. DeFrees and J. A. Pople, J. Chem. Phys., 1982, 77, 3654–3665 CrossRef CAS.
- P. J. Hay and W. R. Wadt, J. Chem. Phys., 1985, 82, 299–310 CrossRef CAS.
- A. D. Becke, J. Chem. Phys., 1993, 98, 1372–1377 CrossRef CAS.
- T. Lu and F. Chen, J. Comput. Chem., 2012, 33, 580–592 CrossRef CAS PubMed.
- T. Yanai, D. P. Tew and N. C. Handy, Chem. Phys. Lett., 2004, 393, 51–57 CrossRef CAS.
- M. Cossi and V. Barone, J. Chem. Phys., 2001, 115, 4708–4717 CrossRef CAS.
- C. Adamo and V. Barone, Chem. Phys. Lett., 2000, 330, 152–160 CrossRef CAS.
- F. Sim, S. Chin, M. Dupuis and J. E. Rice, J. Phys. Chem. C, 1993, 97, 1158–1163 CrossRef CAS.
- K. B. Sophy, P. Calaminici and S. Pal, J. Chem. Theory Comput., 2007, 3, 716–727 CrossRef CAS PubMed.
- M. K. Nazeeruddin, R. Humphry-Baker, P. Liska and M. Grätzel, J. Phys. Chem. B, 2003, 107, 8981–8987 CrossRef CAS.
- R. Sánchez-de-Armas, M. Á. San Miguel, J. Oviedo and J. F. Sanz, Phys. Chem. Chem. Phys., 2012, 14, 225–233 RSC.
- A. Fitri, A. T. Benjelloun, M. Benzakour, M. McHarfi, M. Hamidi and M. Bouachrine, Spectrochim. Acta, Part A, 2014, 124, 646–654 CrossRef CAS PubMed.
- M. P. Balanay and D. H. Kim, J. Mol. Struct. THEOCHEM, 2009, 910, 20–26 CrossRef CAS.
- Z.-L. Zhang, L.-Y. Zou, A.-M. Ren, Y.-F. Liu, J.-K. Feng and C.-C. Sun, Dyes Pigm., 2013, 96, 349–363 CrossRef CAS.
- Y. Li, X. Li and Y. Xu, Spectrochim. Acta, Part A, 2020, 234, 118241 CrossRef CAS PubMed.
- M. R. Narayan, Renewable Sustainable Energy Rev., 2012, 16, 208–215 CAS.
- F. Arkan, M. Izadyar and A. Nakhaeipour, Energy, 2016, 114, 559–567 CrossRef CAS.
- W. Sang-aroon, S. Saekow and V. Amornkitbamrung, J. Photochem. Photobiol., A, 2012, 236, 35–40 CrossRef CAS.
- T. Marinado, K. Nonomura, J. Nissfolk, M. K. Karlsson, D. P. Hagberg, L. Sun, S. Mori and A. Hagfeldt, Langmuir, 2010, 26, 2592–2598 CrossRef CAS PubMed.
- S.-B. Li, D.-M. Gu, J. Zhang, Y. Geng, M. Zhang and Z.-M. Su, New J. Chem., 2016, 40, 9320–9328 RSC.
- E. Ronca, M. Pastore, L. Belpassi, F. Tarantelli and F. De Angelis, Energy Environ. Sci., 2013, 6, 183–193 RSC.
|
| This journal is © The Royal Society of Chemistry 2023 |
Click here to see how this site uses Cookies. View our privacy policy here.  Open Access Article
 *
*

![[double bond, length as m-dash]](https://www.rsc.org/images/entities/char_e001.gif) C, which is beneficial for the intramolecular charge transfer. The bond length d2 between BODIPY and the acceptor is in the range of 1.5134–1.5135 Å and gradually shortens with increasing Fext strength, which will facilitate efficient ICT from the BODIPY to the acceptor. In fact, the addition of the Fext had no appreciable effect on these parameters and did not change the molecular structure to a large extent. In fact, the addition of Fext has no obvious effect on these parameters, so it can be seen that Fext does not have a great effect on the molecular structure.
C, which is beneficial for the intramolecular charge transfer. The bond length d2 between BODIPY and the acceptor is in the range of 1.5134–1.5135 Å and gradually shortens with increasing Fext strength, which will facilitate efficient ICT from the BODIPY to the acceptor. In fact, the addition of the Fext had no appreciable effect on these parameters and did not change the molecular structure to a large extent. In fact, the addition of Fext has no obvious effect on these parameters, so it can be seen that Fext does not have a great effect on the molecular structure.


 and Edye are the excited state oxidation potential and ground state redox potential of the dye, respectively, Eλmax is the transition energy at λmax, and ECB is the reduction potential at the edge of the TiO2 conduction band, which is usually taken to be −4.0 eV. On the other hand, the ability of dyes to acquire electrons from the electrolyte (dye regeneration) is also a key factor affecting the performance of DSSCs, and the regeneration efficiency can be estimated by quantifying the driving force of regeneration (ΔGreg). According to the redox potential of electrolyte solutions I−/I3−, ΔGreg can be defined as:
 , Edye, ΔGinject and ΔGreg at different electric fields are shown in Fig. 11. First, it can be found that the calculated ΔGinject is less than zero, and the charge injection process can proceed spontaneously. And the absolute value of ΔGinject is greater than 0.2 eV under all electric field conditions, and the dye molecules have good electron injection efficiency. Moreover, the absolute value of ΔGinject shows an increasing trend when the electric field increases, indicating that the addition of the Fext can further promote the electron injection process of dye molecules. As shown in Fig. 11b, with the change of the Fext, the absolute value of ΔGreg gradually decreases, indicating that the Fext can also improve the regeneration efficiency of the dye. The increase of ΔGinject and the decrease of ΔGreg in general are favorable conditions to ensure a good Jsc. Therefore, the addition of the Fext increases the possibility for making dye molecules with higher Jsc.


