 Open Access Article
Colorimetric mercury detection with enhanced sensitivity using magnetic-Au hybrid nanoparticles†
Miseon
Jeong
,
Dahyun
Bae
and
Jin-sil
Choi
 *
*
Department of Chemical and Biological Engineering, Hanbat National University, Daejeon 34158, Korea. E-mail: jisil.choi@hanbat.ac.kr
First published on 15th May 2023
Abstract
Due to the neural toxicity of mercury, there is a need for the development of on-site detection systems for Hg2+ monitoring. To this end, a new colorimetric mercury detection probe, Fe3O4@SiO2@Au (magnetic-Au; Mag-Au) hybrid nanoparticles, has been developed. The Au on the surface of Mag-Au is an indicator of Hg2+, which forms an AuHg alloy (amalgam) on their surface (Mag-Au@Hg), with excellent peroxidase-like activity. The oxidation of 3,3′,5,5′-tetramethylbenzidine by Mag-Au@Hg resulted in a color change of the indicator solution, which was enhanced with increasing Hg2+ concentration. Mag-Au can be used to detect Hg2+ at nanomolar concentrations. Additionally, magnetic separation can be used to easily purify and concentrate the Mag-Au@Hg from samples, and thus avoid interference from unwanted residues or colored samples. The feasibility of Mag-Au for Hg2+ detection was tested with an artificial urine solution and it can be used to detect Hg2+ in various real samples, such as river water, seawater, food, and biological samples.
Introduction
The pollution caused by heavy metal ions has caused critical risks to human health and the environment worldwide.1–5 Mercury is one of the most toxic elements; it is readily bioaccumulated and thus concentrates in raw food materials. The accumulation of trace organic mercury in the human body has a strong neurotoxic impact and can cause severe damage to the organs. In addition, mercury can participate in the methylation and demethylation processes in the gut microbiome, which influences their metabolism thereby disturbing the neural system.6,7 Owing to the acute toxicity of mercury, the World Health Organization (WHO) and the U.S. Environmental Protection Agency have set the threshold concentration of mercury in drinking water at 2 μg L−1 (10 nM).8 Traditional methods for mercury detection mainly rely on atomic absorption spectrometry, atomic fluorescence spectrometry, inductively coupled plasma optical emission spectroscopy/mass spectrometry, and electrochemical methods.1,6 Because these methods require technically skilled operators, and are time-consuming and complex processes, it is highly desirable to develop inexpensive and facile on-site methods for mercury detection. To this end, optical analyses are promising techniques that can provide qualitative and quantitative results by naked-eye discrimination without requiring any expensive equipment.9–20Recently, colorimetric sensors, where nanozymes are adopted as color converters responding to targets, have attracted interest.1 The term ‘nanozymes’ refers to nanomaterials with intrinsic enzyme-like activity (e.g., peroxidase, oxidase, catalase, superoxide dismutase, and hydrolase), which can efficiently catalyze substrate conversions. Compared with natural enzymes, nanozymes are advantageous in terms of cost, large-scale production, robustness to harsh environments, stability, and long-term storage. In addition, their catalytic activity can be tuned by controlling size, structure, or morphology, by introducing dopants, and by modifying surface functional groups.21–25 Thus, several researchers have developed nanozyme-based mercury detection systems. For example, Au interacts strongly with Hg2+ ions forming an HgAu alloy (amalgam), which leads to a remarkable enhancement of the peroxidase-like activity of Au nanoparticles (Au NPs).26–32 The strong chelating interaction of Hg2+ with Ag2S@graphene oxide also provides an excellent synergistic catalytic effect.33 Mercuric cations downregulate the enzymatic activities of Pt, Se, SnTe, CuS, and Co3O4 nanoparticles.12,34–37 The formation of HgI reduces the peroxidase-like activity of I2, indicating the presence of Hg via the color change of the solution.38 Mercuric cations block the active sites of S-containing carbon dots and chitosan-functionalized MoSe2 nanosheets, reducing their catalytic activities.27,39 DNAzyme, rich in thymidine, is another suitable candidate for colorimetric mercury detection probes.8,40,41 However, these colorimetric sensors are limited by the color of the samples or are needed in the pretreatment process. Herein, we have developed a Fe3O4@SiO2@Au (magnetic Au; Mag-Au) hybrid nanoparticle system for mercury detection with enhanced sensitivity (Scheme 1). The Au shell of the Mag-Au system is an indicator that reacts with Hg2+ to form an amalgam (Mag-Au@Hg), which in turn, exhibits an enhanced peroxidase-like activity. The Mag-Au@Hg was purified and concentrated from the samples through magnetic separation. Therefore, it is possible to avoid the disturbance of enzymatic reactions by residues present in the samples and achieve clear color recognition. As a result, Hg2+ ions in artificial urine could be successfully monitored using the as-prepared Mag-Au hybrid nanoparticles.
Experimental section
Reagents
The following reagents and chemicals were used as received without further purification: FeCl3·6H2O (Sigma-Aldrich), anhydrous citric acid (99.5%, Samchun), sodium citrate dihydrate (99.0%, Daejung), anhydrous sodium acetate (NaOAc, Duksan), polyacrylic acid (PAA, MW: 5000, 50% aqueous solution, Acros Organics), tetraethyl orthosilicate (TEOS, TCI), ammonia solution (28–30%, Samchun), (3-aminopropyl)trimethoxysilane (APTMS, Sigma-Aldrich), and hydrogen tetrachloroaurate(III) hydrate (99.9% metal basis, Au 49% min Alfa Aesar), sodium hydroxide (Duksan), tetrakis(hydroxymethyl)phosphonium chloride (TCI), bis(p-sulfonatophenyl)phenylphosphine dihydrate dipotassium salt (BSPP, Sigma-Aldrich), anhydrous potassium carbonate (99%, Alfa Aesar), hydroxylamine hydrochloride, mercury(II) chloride (99.5%, Acros Organics), hydrogen peroxide (34.5%, Samchun), 3,3′,5,5′-tetramethylbenzidine (TMB, TCI), glacial acetic acid (Duksan), silver nitrate (99.8%, Samchun), anhydrous iron(III) chloride (98.0%, Samchun), nickel(II) chloride hexahydrate (97.0%, Samchun), cobalt(II) chloride hexahydrate (97.0%, Samchun), zinc chloride (98.0%, Samchun), copper(II) chloride dihydrate (97.0%, Daejung), manganese(II) chloride tetrahydrate (98.0%, Daejung), calcium chloride (95.0%, Duksan), sodium chloride (99.0%, Duksan), 1,3-diphenylisobenzofuran (DPBF, 97%, Alfa Aesar) and artificial urine (Pickering Laboratories, Inc.).Equipment
The size and shape of the Mag-Au nanoparticles were analyzed via field emission scanning electron microscopy (Cold Type FE-SEM, S-4800, Hitachi High Technology, Japan) and transmission electron microscopy (TEM, Tecnai G2 F30 S-Twin, Netherlands). The hydrodynamic size and surface charge of Mag-Au were measured using a Zetasizer (ZSU3200, Malvern Panalytical, England). The optical and magnetic properties of Mag-Au were analyzed using a UV-VIS/NIR spectrophotometer (Lambda 1050, PerkinElmer, USA) and vibrating sample magnetometry (VMS, 7400-S, Lake Shore Cryotronics, USA), respectively. X-ray diffraction (XRD; SmartLab, Rigaku, Japan) was used to determine the crystal structure of Mag-Au. Analyses of the chemical composition of Mag-Au were performed using energy dispersive X-ray spectroscopy (EDX equipped on TEM). The absorbance of Hg2+ detection solution was measured using plate reader (Multi-mode microplate reader, SpectraMax M2e, Molecular devices).Preparation of Mag-Au NPs (Fe3O4@SiO2@Au)
Fe3O4 nanoclusters were prepared via a solvothermal method42,43 and their surfaces were further modified with SiO2.44 The detailed preparation protocol is described in the ESI.† The aminated Fe3O4@SiO2 nanoparticles (10 mg) were incubated overnight with a concentrated Au seed solution. The unattached free Au seeds were then removed by magnetic separation. The purified Fe3O4@SiO2@Au seed was mixed with the growth solution (0.2 mM, 1.6 L), 20 mL of BSPP (22.6 μM), and 32 mL of NH3OH·HCl (363.2 μM) with vigorous stirring. The mixture was allowed to react for 3 days. After the reaction, the reaction solution was centrifuged and unreacted reagents in the supernatant were removed. The purified Mag-Au NPs were redispersed in DIW and were stored in the refrigerator at 4 °C before usage.Peroxidase-like activity of Mag-Au with the existence of Hg2+ ions
Mag-Au (300 ng) was added to a buffer solution (citrate buffer, pH 5.4, 10 mM) containing mercury ions (10–400 nM). Subsequently, H2O2 (150 mM) and TMB (0.59 mM) were added rapidly. After 10 minutes, the absorbance of the resulting solution was measured at 652 nm. Mag-Au@Hg can be further purified and concentrated using a NdFeB magnet to enhance their sensitivity.Hg2+ ion detection selectivity of Mag-Au
Experiments with different metals were performed to confirm the selective mercury detection of Mag-Au NPs. Mag-Au (300 ng) was added to a buffer (citrate buffer, pH 5.4, 10 mM) containing 200 nM of metal (Hg2+, Ag+, Fe3+, Ni2+, Co2+, Zn2+, Cu2+, Mn2+, Ca2+, Na+). H2O2 (130 mM, 20 μL) and TMB (0.59 mM, 20 μL) were then added rapidly. The absorbance of the resulting solution was measured at 652 nm.Detection of Hg2+ in artificial urine
The artificial urine sample of Hg addict patient was prepared by adding HgCl2 (1.1 μM, 10 μL) to artificial urine. Mag-Au (30 μg mL−1) were added to artificial urine, first. Then the mixture were mixed with pH 5.4 buffer (citrate buffer, 10 mM), H2O2 (150 mM), and TMB (0.59 mM). After 10 minutes of mixing, the absorbance of the solution was measured at 652 nm using a multimode plate reader.Results and discussion
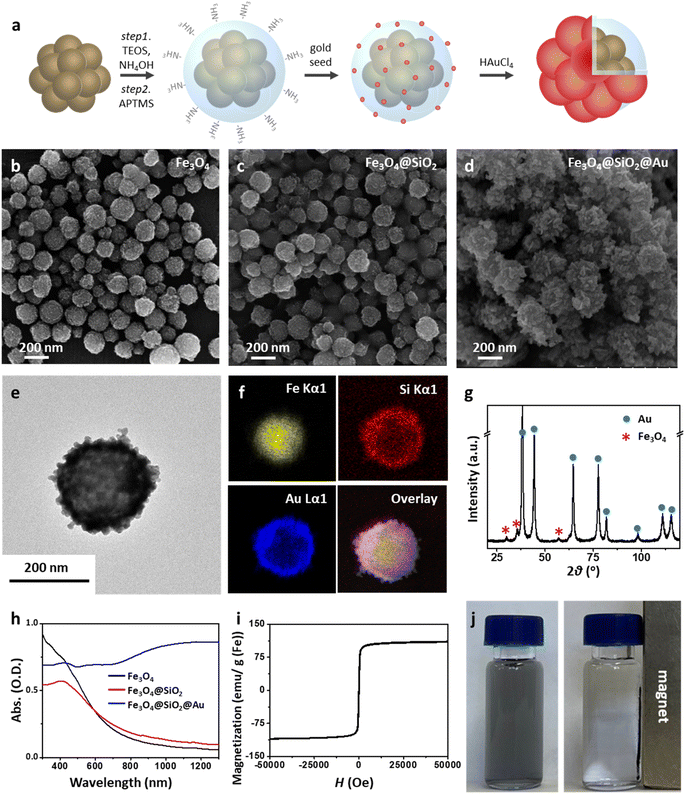
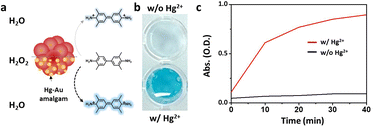
The Mag-Au nanoparticles were obtained by the sequential synthesis of the iron oxide core, intermediate SiO2 layer, and Au shell (Fig. 1a). The Au shell was easily grown from Au seeds with a surface charge of −30.4 mV, which were bound to the aminated silica shell on Fe3O4 with a surface charge of +46.49 mV via electrostatic interactions (Fig. S1 and S2†). As shown in the SEM and TEM images (Fig. 1b–d and S2†), the size of the nanoparticles gradually increases after the surface coating with silica and sequential growth of the Au shell without additional seed formation. The size of the Fe3O4 nanoclusters is 151.8 ± 29.7 nm, and that of Mag-Au increases to 233.7 ± 59.0 nm. The hydrodynamic size of Mag-Au is 491.5 nm, which is larger than the size observed in the SEM images. As shown in the high-resolution TEM image, crystalline Au particles of a few nanometers in size were grown on the amorphous SiO2 layer, forming an Au shell (Fig. S3†). The EDX mapping of the Mag-Au nanoparticles shows the distribution of Fe (yellow), Si (red), and Au (blue), and the core–shell structure was clearly visualized (Fig. 1f). According to EDX analysis, the as-prepared Mag-Au comprises 31.3% (Fe), 11.6% (Si), and 57.1% (Au) (Table S1†). The XRD spectrum exhibits peaks from both the Au shell and Fe3O4 core (Fig. 1g). The Mag-Au hybrid nanoparticles show strong absorption in the NIR region (>700 nm) as compared to Fe3O4 and Fe3O4@SiO2 nanoparticles (Fig. 1h); this can be attributed to the Au shell in the hybrid clusters. In addition, the Mag-Au nanoparticles are superparamagnetic with a high value of saturation magnetization, comparable with that of similar-sized Fe3O4 nanoparticles (Fig. 1i).43 Therefore, Mag-Au nanoparticles can strongly influence the response to the magnet, although they are well-dispersed in an aqueous solution without the magnet (Fig. 1j).The enzymatic activity of Au nanoparticles is enhanced by the formation of an amalgam with Hg2+; thus, several studies explore the use of Au hybrid nanoparticles for Hg2+ detection.26,28,30,45 To examine the possibility of using Mag-Au hybrid nanoparticles for Hg2+ ion detection, the peroxidase-like activity of the Mag-Au hybrid nanoparticles was compared in the presence and absence of Hg2+ (Fig. 2a). When a TMB (0.59 mM)/H2O2 (150 mM) solution was mixed with the Mag-Au hybrid nanoparticles, the color of the solution changed slightly to a light blue color (Fig. 2b) due to its peroxidase-like activity.46 In contrast, the color of the solution turned blue when Hg2+ ions (200 nM) were premixed with the Mag-Au hybrid nanoparticles (Fig. 2b). When the time-dependent absorbance variation at 652 nm was monitored, the absorbance of the solution containing Hg(II) premixed with Mag-Au hybrid nanoparticles dramatically increased compared to that of the solution with pristine Mag-Au hybrid nanoparticles (Fig. 2c). Considering no absorbance change was absorbed with Fe3O4 and Fe3O4@SiO2 under same experiment (Fig. S4†), formation of amalgam on Au shell on Mag-Au is key reaction to detect Hg2+. The color mapped EDX images of Mag-Au after the reaction with Hg2+ ions show Hg distribution at the similar position of Au shell (Fig. S5†). In the XPS spectrum of Mag-Au that was purified after the reaction with Hg2+ ions, new peaks from Hg 4f5/2 and Hg 4f7/2 appeared (Fig. S6†). In the high resolution XPS spectrum, Hg oxidation state is determined mostly as zero based on the reported XPS values47,48 on Mag-Au after the reaction with Hg2+ ions, indicating the formation of a HgAu amalgam on the Au shell.45 The citrate, buffer in our system, can help the reduction of Hg(II) ions to Hg(0) (Fig. S7†).26,49,50 After the reaction with TMB and H2O2, the oxidation state of most Hg in Mag-Au@Hg turned to 2+ (Fig. S6d and e†). Hg, which possesses smaller electronegativity compared to Au, can transfer electrons to nearby molecules through its oxidation.26
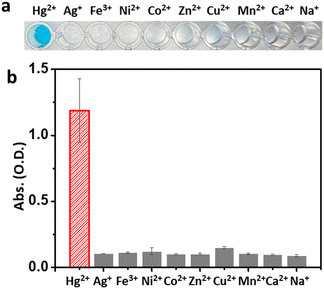
Based on the reactive oxygen species (ROS) indication test using 1,3-diphenylisobenzofuran, Mag-Au@Hg is capable of generating ROS and decomposing H2O2 more efficiently than Mag-Au (Fig. S8†). Among a range of metal ions studied, the Mag-Au hybrid nanoparticles show an enhanced enzymatic activity only in the presence of Hg2+ (Fig. 3). Therefore, the Mag-Au hybrid nanoparticles can be successfully used as highly selective Hg2+ detection probes.
The optimum reaction conditions for Hg2+ ion detection were explored. The peroxidase-like activity of the Mag-Au@Hg is maximum at a pH of 5.4 (Fig. S9†). The catalytic effect of Mag-Au accelerates with increasing H2O2 concentration, and plateaus at 150 mM H2O2 (Fig. S10†). Subsequently, the concentration range of Hg2+ that can be detected by Mag-Au was examined. The detection efficiency of Mag-Au peaks at a Hg2+ concentration of 30 μg mL−1 and then decreases at higher concentrations due to the formation of 3,3′,5,5′-tetramethylbenzidine diimine through a two-electron oxidation of TMB,51 which shows a weak absorption at 652 nm (Fig. S11†). The indicator solution containing TMB and H2O2, undergoes a color change after the reaction of Mag-Au with Hg2+ ions (0–400 nM). With the naked eye, a weak blue color is observed in the indicator solution mixed with 50 nM Hg2+ ions, and a clear blue color is noted at Hg2+ concentrations > 100 nM (Fig. 4a). The absorption intensity at 652 nm plotted against the Hg2+ ion concentration depicts a gradual increase in the absorption intensity from 50 to 200 nM Hg2+ (Fig. 4b). Below a concentration of 100 nM Hg2+, the difference in absorption intensity of the indicator solution with and without Hg2+ ions is not significant, which is similar to the observation with the naked eye (Fig. 4a). However, it increases considerably when the concentration of Hg2+ ions is >100 nM. However, the color change of the indicator solution is not clear enough to be recognized via a visual inspection at low concentrations.
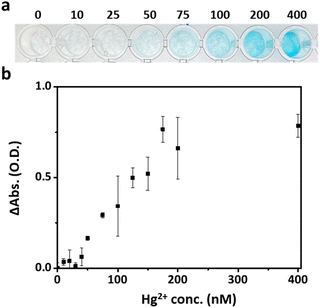 | ||
| Fig. 4 Hg2+ concentration-dependent (a) color change and (b) absorption intensity at 652 nm of indicator solution containing Mag-Au@Hg, TMB, and H2O2. | ||
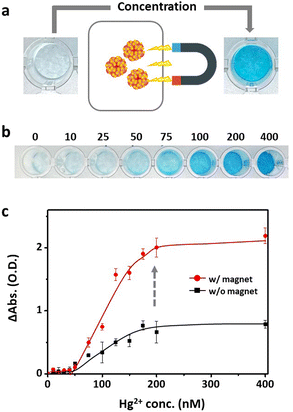
To address this limitation, the Mag-Au particles were further concentrated and purified via magnetic separation. Magnetic separation is a convenient method for purifying and concentrating magnetically tagged substances in mixtures. Owing to the strong response of Mag-Au to external magnets (Fig. 1i and j), the Mag-Au@Hg was successfully attracted to a magnet and concentrated by removing the supernatant and redispersing it in the desired volume of citrate buffer (pH 5.4). At Mag-Au@Hg concentrations of ten times the initial concentration, the color of the indicator solution turns blue (Fig. 5a and b). As shown in Fig. 5b, the blue color of the indicator solution is clearly observed compared to that of the original solution (Fig. 4a) at various concentrations of Hg2+ ions. The absorption intensity (at 652 nm) of the indicator solution is highly enhanced after the magnetic concentration step (Fig. 5c). In some studies, Fe3O4 nanoparticles have been used for facilitating the magnetic separation to remove the unreacted probes for Hg2+ detection,52,53 but not to concentrated probes in the solution. However, our study shows that the concentration of the Hg2+ reacted with the probe itself can influence the detection efficiency. As a result, lower concentrations of mercury can be detected with the naked eye; this method can be easily used for mercury detection in various environments.
Another advantage of the magnetic separation capability of Mag-Au is the purification of the probes from undesired residues in the samples. The amount of Hg2+ added is determined by measuring its concentration in urine or blood; the threshold concentration of Hg2+ in urine for Hg addict determination is 1.1 μM according to the WHO guidelines.2
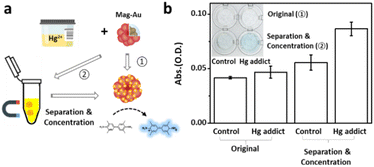
Real samples contain a large number of proteins, salts, or molecules that disturb the color recognition or the reaction between Hg2+ ions and the probe. Therefore, Hg2+ detection capability of Mag-Au were examined with the similar condition of real samples. To imitate the real sample, Hg2+ ions (1.1 μM) were mixed in artificial urine, which possesses the same composition as urine. A droplet of the Hg-containing artificial urine (Hg2+ concentration in the control sample: 0 μM, Hg-addict-imitation sample: 1.1 μM) was reacted with Mag-Au, and the presence of Hg2+ was confirmed by the color change in the indicator solution (Fig. 6a). Without separation of Mag-Au@Hg (①), neither the control sample nor the Hg-added sample showed a recognizable color change. The formation rate of the amalgam reduces in urine, and some undesired components of urine (e.g., ascorbic acid) may prohibit the oxidation of TMB.54 Whereas, the purification and concentration of Mag-Au@Hg can improve the colorimetric signal intensity (②). As shown in Fig. 6b (inset), a clear blue color is observed in the Hg-added sample, whereas the color of the solution does not change substantially from that of the control sample. The absorbance intensity of the purified and concentrated Mag-Au@Hg in the Hg-addict-imitation sample (Fig. 6b) shows a considerably higher absorbance than those of the other samples. Thus, the magnetic separation capability of Mag-Au can greatly enhance the sensitivity of colorimetric sensors, where the existence of trace analytes can be detected with the naked eye.
Conclusions
The study developed Mag-Au hybrid nanoparticles as effective mercury probes, with the Au shell forming an HgAu amalgam that accelerates TMB oxidation. Owing to the strong response of Mag-Au to an external magnet, the Mag-Au@Hg can be purified and concentrated via magnetic separation so that the blue color, which originates from the oxidized TMB by Mag-Au@Hg, is clearly observed. The purification and concentration of Mag-Au@Hg can be performed using the Mag-spinner system developed by our group43 without any complex equipment when the conditions are optimized in further studies. The improvement of color intensity through the concentration of Mag-Au@Hg can enhance the accuracy of mercury detection, thus is helpful in on-site detection systems, which are lacked of equipment. In addition, Hg2+ ions are readily recognized using Mag-Au by a visual inspection without interference from other residues in the sample. This separation and concentration capability of Mag-Au can allow for its application in detecting mercury in colored and blood samples. Therefore, Mag-Au can be used as an on-site Hg2+ detection probe for various industrial and healthcare purposes, such as water pollution monitoring, food management, work environment management, and monitoring of mercury accumulation in the living body.Author contributions
Conceptualization, data curation, funding acquisition, investigation methodology, project administration, supervision, writing – review & editing: JC; formal analysis, validation, visualization: MJ and DB; writing – original draft: JC, MJ, and DB.Conflicts of interest
There are no conflicts to declare.Acknowledgements
This work was supported by National Research Foundation of Korea (NRF) grants funded by the Korean government (MSIT) (2019R1G1A109572811, 2020R1C1C101186313, 2020R1A5A801767114 and 2023R1A2C100509111).References
- A. Hasan, N. M. Q. Nanakali, A. Salihi, B. Rasti, M. Sharifi, F. Attar, H. Derakhshankhah, I. A. Mustafa, S. Z. Abdulqadir and M. Falahati, Talanta, 2020, 215, 120939 CrossRef CAS PubMed.
- L. Magos and T. W. Clarkson, Annals of Clinical Biochemistry: International Journal of Laboratory Medicine, 2006, 43, 257–268 CrossRef CAS PubMed.
- A. Alengebawy, S. T. Abdelkhalek, S. R. Qureshi and M.-Q. Wang, Toxics, 2021, 9, 42 CrossRef CAS PubMed.
- J. Briffa, E. Sinagra and R. Blundell, Heliyon, 2020, 6, e04691 CrossRef CAS PubMed.
- X. Li, A. D. Brejnrod, M. Ernst, M. Rykær, J. Herschend, N. M. C. Olsen, P. C. Dorrestein, C. Rensing and S. J. Sørensen, Environ. Int., 2019, 126, 454–467 CrossRef CAS PubMed.
- X. Liu, Y. Yao, Y. Ying and J. Ping, TrAC, Trends Anal. Chem., 2019, 115, 187–202 CrossRef CAS.
- F. Giambò, S. Italia, M. Teodoro, G. Briguglio, N. Furnari, R. Catanoso, C. Costa and C. Fenga, World Academy of Sciences Journal, 2021, 3, 19 CrossRef.
- Y. Hao, Q. Guo, H. Wu, L. Guo, L. Zhong, J. Wang, T. Lin, F. Fu and G. Chen, Biosens. Bioelectron., 2014, 52, 261–264 CrossRef CAS PubMed.
- Z. Chen, C. Zhang, Y. Tan, T. Zhou, H. Ma, C. Wan, Y. Lin and K. Li, Microchim. Acta, 2015, 182, 611–616 CrossRef CAS.
- Y. Ma, L. Jiang, Y. Mei, R. Song, D. Tian and H. Huang, Analyst, 2013, 138, 5338 RSC.
- J. R. Zhang, W. T. Huang, A. L. Zeng, H. Q. Luo and N. B. Li, Biosens. Bioelectron., 2015, 64, 597–604 CrossRef CAS PubMed.
- Y. Fang, Y. Zhang, L. Cao, J. Yang, M. Hu, Z. Pang and J. He, ACS Appl. Mater. Interfaces, 2020, 12, 11761–11768 CrossRef CAS PubMed.
- W. H. Danial, N. A. S. Mohamed and Z. A. Majid, Carbon Lett., 2022, 32, 57–80 CrossRef.
- Y. Jiang, J. Tian, K. Hu, Y. Zhao and S. Zhao, Microchim. Acta, 2014, 181, 1423–1430 CrossRef CAS.
- C. Sun, R. Sun, Y. Chen, Y. Tong, J. Zhu, H. Bai, S. Zhang, H. Zheng and H. Ye, Sens. Actuators, B, 2018, 255, 775–780 CrossRef CAS.
- H. Chen, X. Zhang, H. Sun, X. Sun, Y. Shi, S. Xu and Y. Tang, Analyst, 2015, 140, 7170–7174 RSC.
- H.-H. Deng, B.-Y. Luo, S.-B. He, R.-T. Chen, Z. Lin, H.-P. Peng, X.-H. Xia and W. Chen, Anal. Chem., 2019, 91, 4039–4046 CrossRef CAS PubMed.
- Z.-X. Wang, Y.-X. Guo and S.-N. Ding, Microchim. Acta, 2015, 182, 2223–2231 CrossRef CAS.
- R. S. Lankone, K. E. Challis, Y. Bi, D. Hanigan, R. B. Reed, T. Zaikova, J. E. Hutchison, P. Westerhoff, J. Ranville, H. Fairbrother and L. M. Gilbertson, Environ. Sci.: Nano, 2017, 4, 1784–1797 RSC.
- H. Singh, A. Bamrah, S. K. Bhardwaj, A. Deep, M. Khatri, R. J. C. Brown, N. Bhardwaj and K.-H. Kim, Environ. Sci.: Nano, 2021, 8, 863–889 RSC.
- D. Jiang, D. Ni, Z. T. Rosenkrans, P. Huang, X. Yan and W. Cai, Chem. Soc. Rev., 2019, 48, 3683–3704 RSC.
- Y. Huang, J. Ren and X. Qu, Chem. Rev., 2019, 119, 4357–4412 CrossRef CAS PubMed.
- Q. Wang, H. Wei, Z. Zhang, E. Wang and S. Dong, TrAC, Trends Anal. Chem., 2018, 105, 218–224 CrossRef CAS.
- D. He, M. Yan, P. Sun, Y. Sun, L. Qu and Z. Li, Chin. Chem. Lett., 2021, 32, 2994–3006 CrossRef CAS.
- X. Wang, H. Wang and S. Zhou, J. Phys. Chem. Lett., 2021, 12, 11751–11760 CrossRef CAS PubMed.
- Z. Chen, C. Zhang, Q. Gao, G. Wang, L. Tan and Q. Liao, Anal. Chem., 2015, 87, 10963–10968 CrossRef CAS PubMed.
- P. Borthakur, P. K. Boruah and M. R. Das, ACS Sustainable Chem. Eng., 2021, 9, 13245–13255 CrossRef CAS.
- R. Zhu, Y. Zhou, X.-L. Wang, L.-P. Liang, Y.-J. Long, Q.-L. Wang, H.-J. Zhang, X.-X. Huang and H.-Z. Zheng, Talanta, 2013, 117, 127–132 CrossRef CAS PubMed.
- G.-H. Chen, W.-Y. Chen, Y.-C. Yen, C.-W. Wang, H.-T. Chang and C.-F. Chen, Anal. Chem., 2014, 86, 6843–6849 CrossRef CAS PubMed.
- L. Zhi, S. Zhang, M. Li, J. Tu and X. Lu, ACS Appl. Mater. Interfaces, 2022, 14, 9442–9453 CrossRef CAS PubMed.
- J. Lou-Franco, B. Das, C. Elliott and C. Cao, Nano-Micro Lett., 2021, 13, 10 CrossRef PubMed.
- B. Das, J. L. Franco, N. Logan, P. Balasubramanian, M. I. Kim and C. Cao, Nano-Micro Lett., 2021, 13, 193 CrossRef CAS PubMed.
- Q. Zhao, W. Gou, X. Zhang, M. Zhang, Y. Bu, L. Wang, L. Hu, W. Yao and Z. Yan, Appl. Surf. Sci., 2021, 545, 148973 CrossRef CAS.
- W. Li, B. Chen, H. Zhang, Y. Sun, J. Wang, J. Zhang and Y. Fu, Biosens. Bioelectron., 2015, 66, 251–258 CrossRef CAS PubMed.
- H. Cao, J. Xiao and H. Liu, Biochem. Eng. J., 2019, 152, 107384 CrossRef CAS.
- W. Zou, Y. Tang, H. Zeng, C. Wang and Y. Wu, J. Hazard. Mater., 2021, 417, 125994 CrossRef CAS PubMed.
- M. Zhang, Y. Qu, D. Li, X. Liu, Y. Niu and Y. Xu, Anal. Chem., 2021, 93, 10132–10140 CrossRef CAS PubMed.
- Y. Wang, L. Xu and W. Xie, Microchem. J., 2019, 147, 75–82 CrossRef CAS.
- L. Huang, Q. Zhu, J. Zhu, L. Luo, S. Pu, W. Zhang, W. Zhu, J. Sun and J. Wang, Inorg. Chem., 2019, 58, 1638–1646 CrossRef CAS PubMed.
- K. Yang, M. Zeng, X. Hu, B. Guo and J. Zhou, Analyst, 2014, 139, 4445 RSC.
- R. Tian, X. Chen, N. Jiang, N. Hao, L. Xu and C. Yao, J. Mater. Chem. B, 2015, 3, 4805–4813 RSC.
- M. Jeong, S. Lee, D. Y. Song, S. Kang, T.-H. Shin and J. Choi, ACS Omega, 2021, 6, 31161–31167 CrossRef CAS PubMed.
- S. Lee, M. Jeong, S. Lee, S. H. Lee and J. Choi, Nanoscale Adv., 2022, 4, 792–800 RSC.
- B. Luo, X.-J. Song, F. Zhang, A. Xia, W.-L. Yang, J.-H. Hu and C.-C. Wang, Langmuir, 2010, 26, 1674–1679 CrossRef CAS PubMed.
- W. Qi, Y. Wang, J. Wang and C. Huang, Sci. China: Chem., 2012, 55, 1445–1450 CrossRef CAS.
- J. Li, W. Liu, X. Wu and X. Gao, Biomaterials, 2015, 48, 37–44 CrossRef CAS PubMed.
- X. Guo, M. Li, A. Liu, M. Jiang, X. Niu and X. Liu, Water, 2020, 12, 2105 CrossRef CAS.
- G.-W. Wu, S.-B. He, H.-P. Peng, H.-H. Deng, A.-L. Liu, X.-H. Lin, X.-H. Xia and W. Chen, Anal. Chem., 2014, 86, 10955–10960 CrossRef CAS PubMed.
- J.-Y. Yang, X.-D. Jia, X.-Y. Wang, M.-L. Chen, T. Yang and J.-H. Wang, Analyst, 2020, 145, 5200–5205 RSC.
- I. Ojea-Jiménez, X. López, J. Arbiol and V. Puntes, ACS Nano, 2012, 6, 2253–2260 CrossRef PubMed.
- P. D. Josephy, T. Eling and R. P. Mason, J. Biol. Chem., 1982, 257, 3669–3675 CrossRef CAS PubMed.
- L. Wang, F. Liu, N. Sui, M. Liu and W. W. Yu, Microchim. Acta, 2016, 183, 2855–2860 CrossRef CAS.
- G. Wang, H. Huang, X. Zhang and L. Wang, Biosens. Bioelectron., 2012, 35, 108–114 CrossRef CAS PubMed.
- V.-D. Doan, V.-C. Nguyen, T.-L.-H. Nguyen, A.-T. Nguyen and T.-D. Nguyen, Spectrochim. Acta, Part A, 2022, 268, 120709 CrossRef CAS PubMed.
Footnote |
| † Electronic supplementary information (ESI) available: Synthetic protocols and TEM images of Fe3O4, Fe3O4@SiO2, Au seeds, and Mag-Au, confirmation of amalgam formation on Mag-Au using XPS analysis, detection capability of Fe3O4, Fe3O4@SiO2, Mag-Au, ROS generation test by Mag-Au@Hg, and comparison of catalytic effect of Mag-Au in various condition. See DOI: https://doi.org/10.1039/d3na00129f |
| This journal is © The Royal Society of Chemistry 2023 |


