 Open Access Article
A simple microplasma reactor paired with indirect ultrasonication for aqueous phase synthesis of cobalt oxide nanoparticles†
Sosiawati
Teke
 a,
Md. Mokter
Hossain
b,
Roshan Mangal
Bhattarai
 a,
Shirjana
Saud
 a,
Avik
Denra
a,
Mai Cao
Hoang Phuong Lan Nguyen
a,
Adnan
Ali
a,
Van Toan
Nguyen
c and
Young Sun
Mok
a,
Avik
Denra
a,
Mai Cao
Hoang Phuong Lan Nguyen
a,
Adnan
Ali
a,
Van Toan
Nguyen
c and
Young Sun
Mok
 *a
*a
aDepartment of Chemical Engineering, Jeju National University, Jeju 63243, Republic of Korea. E-mail: smokie@jejunu.ac.kr; Fax: +82-64-755-3670; Tel: +82-64-754-3682
bDepartment of Chemical and Biological Engineering, University of Idaho, Moscow 83844, USA
cFaculty of Mechanical Engineering, Le Quy Don Technical University, Vietnam
First published on 26th June 2023
Abstract
Cobalt oxide nanoparticles are widely used owing to their distinct properties such as their larger surface area, enhanced reactivity, and their superior optical, electronic, and magnetic properties when compared to their bulk counterpart. The nanoparticles are preferably synthesized using a bottom-up approach in liquid as it allows the particle size to be more precisely controlled. In this study, we employed microplasma to synthesize Co3O4 nanoparticles because it eliminates harmful reducing agents and is efficient and cost-effective. Microplasma reactors are equipped with copper wire electrodes to generate plasma and are simple to configure. The product was characterized using UV-Vis spectroscopy, X-ray diffraction (XRD), X-ray photoelectron spectroscopy (XPS), field emission scanning electron microscopy (FESEM), and transmission electron microscopy (TEM). The experimental parameters that were varied for the synthesis were: with or without stirring, with or without indirect ultrasonication, and with or without capping agents (urea and sucrose). The results showed that the microplasma enabled Co3O4 nanoparticles to be successfully synthesized, with particle sizes of 10.9–17.7 nm, depending on the synthesis conditions.
1. Introduction
Transition metal oxide nanoparticles have more advanced characteristics than their bulk forms in various respects; for example they have superior optical, electronic, magnetic, and catalytic properties. In addition, the nanoparticles have a more optimal chemical composition, structure, morphology, dimension, and size distribution with a high surface-to-volume ratio, fewer surface defects, and quantum effects.1–3 Cobalt oxide is one of a number of transition metal oxide nanoparticles that are widely used in various applications owing to its many benefits. The two most stable cobalt oxide phases are Co3O4 and CoO4 and they are suitable for application as catalysts,2,3,5 energy storage,6–8 sensors,9 solar cells,10 bactericidal,11 biomedical agents,12 and pharmaceutics.13Nanoparticles have been synthesized using several methods, which can be divided into two categories: top-down and bottom-up approaches. The top-down approach is useful for reducing bulk material into small particles, whereas the bottom-up approach is appropriate for arranging atoms or very small particles into nanoparticles. Although the top-down approach is simple to use, it is less effective for producing particles with smaller sizes and uniform shapes.14 Cobalt oxide nanoparticles have been produced using various bottom-up approaches, with wet chemical synthesis being the most common method as it allows the shape and size of nanoparticles to be controlled at low temperatures and for processing times ranging from a few seconds to several hours. These approaches include sol–gel,15,16 hydrothermal,17 solvothermal,6 spray pyrolysis,18 and microemulsion methods.19,20 However, these methods utilize toxic organic solvents and reducing agents and require long processing times and expensive equipment.7,21
Synthesizing nanoparticles through plasma interaction with a liquid interface is a method that has been rapidly developed in recent years. Plasma is an ionized gas, which contains photons, energetic electrons, ions, radicals, and neutral gas molecules and its excited states. Consequently, the plasma interacted with a liquid surface (plasma–liquid interface) produces reactive species such as O˙, OH˙, H2O2, and UV radiation, which acts as a reducing agent. Hence, plasma–liquid interface can reduce the possible usage of harmful chemicals in the nanoparticle synthesis process, making it eco-friendly than conventional methods.22–24 Unfortunately, the plasma used for the synthesis of nanoparticles is typically formed and maintained at low pressure, which requires costly vacuum equipment. Additionally, a large reactor is required, making it challenging to control the temperature distribution, concentration, and time uniformity for particle nucleation and growth. As a result, the end product is typically inconsistent because of partial agglomeration and a broad size distribution. These problems can be overcome by resorting to a new development in the field of plasma technology known as microplasma.25
Microplasma, a subclass of plasma with microscale geometry, is still being explored for its potential use in the synthesis of nanomaterial. The advantages of microplasma are its simplicity, affordability, security, operability at atmospheric pressure and, most importantly, its ability to deliver products with high homogeneity.25–28 Previous research has shown that nanoparticles can be successfully synthesized using microplasma discharge to obtain nanoparticles in a range of sizes (1–100 nm) of several compounds such as Mn3O4,29 Au,30 Pt,31 and Au/Ag.32
In our study, we utilized a microplasma reactor (MPR) with a simple configuration to determine the experimental conditions under which microplasma discharge could be used to produce cobalt oxide nanoparticles. In particular, we studied the effect of the concentration of precursor, pH of the precursor, and processing time. In addition, we examined the agitation conditions to determine the effect of coupling the MPR with a magnetic stirrer and ultrasonication bath to control the morphology of the particles in the nanoparticle size range of 1–100 nm. The addition of different capping agents to prevent the agglomeration of nanoparticles was also explored.
2. Experimental
2.1. Chemical
Cobalt nitrate hexahydrate (Co(NO3)2·6H2O) and urea (CO(NH2)2) were purchased from Junsei Chemical Co. Ltd., Japan and, sodium hydroxide (NaOH), sucrose (C12H22O11), and ethanol (C2H5OH) were purchased from Daejung Chemical and Metals, Co. Ltd., South Korea.2.2. Experimental setup
3. Results and discussion
3.1. Electrical characteristics of microplasma
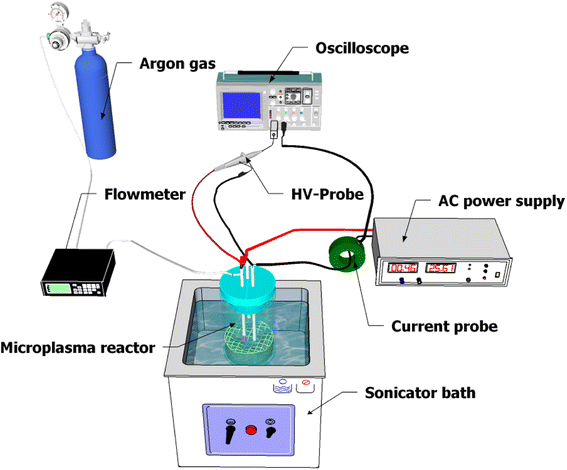
The process of generating microplasma for nanoparticle synthesis is depicted in Fig. 3(a) and the current–voltage characteristics of the microplasma are shown in Fig. 3(b) which is typical of an AC symmetric waveform. Initially, the applied voltage is increased until voltage breakdown occurs at around 1.04 kV. This gives rise to gas conductivity due to ionization, thereby resulting in the production of additional ions and electrons. The resulting electrons have an impact on the current, which gradually increases (peak current: 65.23 mA) while the voltage stabilizes at 0.57 kV. The microplasma is generated using high-voltage AC, which causes the polarity of the electrode to reverse during one cycle. | ||
| Fig. 3 (a) Components of the microplasma reactor for nanoparticle synthesis; (b) current–voltage waveform. | ||
The duration of one complete cycle from positive to negative polarity is less than 80 μs. The electric current flows in accordance with the polarity of the voltage, resulting in the formation of a negative current curve. The peak current during the positive half cycle is higher, measuring 101 and 153 mA, compared to the negative half cycle which records 63 mA. This indicates that the level of ionization is greater during the positive half cycle than the negative half cycle. As the number of ionizations increases, the discharge current also increases, leading to a decrease in voltage (once voltage breakdown transpires). This decrease occurs due to the reduced discharge resistance. Subsequently, the voltage remains constant at 0.57 kV for approximately 23 μs, following which it gradually decreases until a polarity change occurs.33 Fig. S2(a and b)† illustrate the voltage and current profiles of a microplasma reactor operated with air as the input gas, without and with plasma formation. Under the conditions without plasma formation, faint parasitic discharge is formed that generated negligible current. On the other hand, when plasma is formed at the liquid, the discharge current reaches around 50 mA, i.e., the current without plasma was much lower than the discharge current. However, when employing microplasma with air as the gas inlet for treating the precursor for 75 minutes, cobalt nanoparticles did not form, indicated by the absence of any color change in the precursor. The power for one cycle is calculated to be approximately 6.03 W using the following equation (eqn (1)):27
| P = f × ∫P(t)dt = f × ∫V(t) × I(t)dt | (1) |
3.2. Effect of concentration, pH, and reaction time on the number of particles and band gap energy
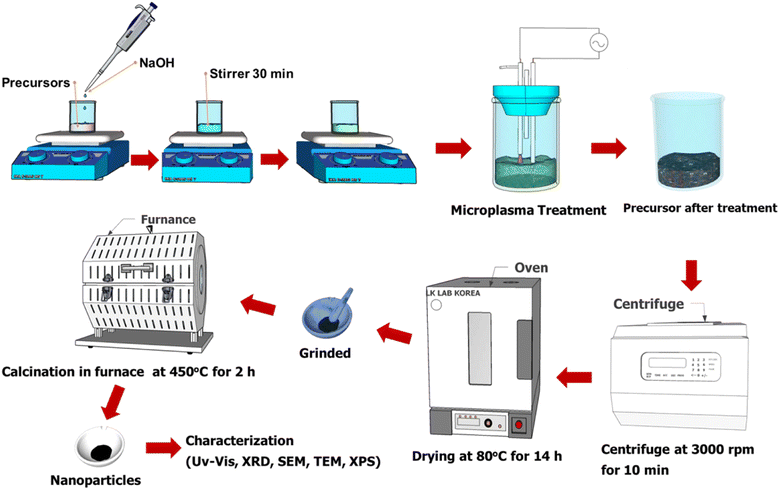
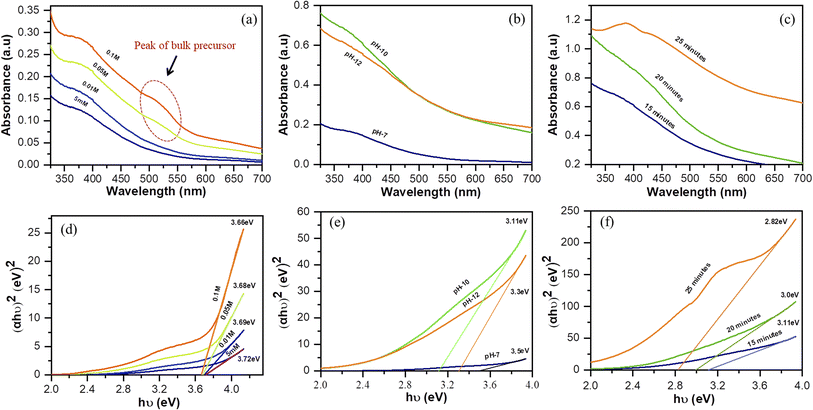
Hydride (H−) and hydrogen peroxide (H2O2), the latter formed from hydroxyl (OH) radicals, are the two reactive species that mostly form when the microplasma and liquid interface interact. These two species serve as reducing agents and react with the bulk precursor solution to transform the bulk particles into nanoparticles.First, we examined the effect of the concentration, pH of the precursor solution, and reaction time using ultraviolet-visible (UV-Vis) spectroscopy. The absorbance spectra enabled the number of particles that formed to be determined and the Tauc plots indicated the direct optical energy of the band gap (Eg) of the sample. The concentration of the solvent affected the number of particles that formed, and the number of particles increased linearly with the concentration of the precursor. However, at higher concentrations of the precursor (0.05 and 0.1 M), the cobalt nitrate hexahydrate was still partially present in the bulk form, as indicated by the broad absorption peak in the range 488–543 nm after exposure to the microplasma for 15 minutes (Fig. 4(a)). This was attributed to the insufficient production of reactive species by the microplasma to react with particles of the bulk metal salt in the high-concentration solution. Apart from this, a higher concentration of the precursor has been shown to increase the size of the nanoparticles.34
Fig. 4(b) shows that the number of particles was affected by the pH of the precursor solution. Initially the precursor was colored pink and the pH was 7. Upon addition of NaOH, the color changed to green and dark green as the pH of the solution changed to 10 and 12, respectively. Finally, the solution turned blackish-brown after being treated with microplasma (Fig. S1†). The discoloration after microplasma treatment indicates the formation of nanoparticles. Compared to the samples at pH 7 and 12, the sample at pH 10 contained the most particles. The particle size is affected by the pH, which is influenced by the addition of hydroxide to the solution. Thus, a precursor solution with a high concentration of hydroxide would result in the particle size becoming smaller.35,36
Fig. 4(c) shows the UV-Vis spectra of the precursor solution (pH 10) recorded at different reaction times. The number of particles increases linearly with the reaction time, while the particle size increases concurrently.36 In addition, Eg can be determined by the Tauc method in direct transition (eqn (3)).
| (αhν)2 = K(hν − Eg) | (2) |
The energy of the optical band gap can be calculated by extrapolating the linear region in the plot of (αhν)2 versus (hν).18Fig. 4(d) shows that the Eg of the four samples with different precursor concentrations are not significantly different from each other. However, the particle size can be affected by the concentration of the solution, with a high concentration leading to an increase in particle size, as shown by the results for the band gap, which narrows as the concentration increases. These findings corroborate those for the samples that were allowed to react for various time periods (Fig. 4(f)), where Eg decreases for longer treatment times. Eg and the particle size are inversely correlated in that the band gap energy increases with decreasing particle size.36 However, as shown in Fig. 4(e), the sample with pH 12 has a wider energy gap than the sample with pH 10. This may be attributable to the particles in the sample with pH 10 being smaller than those in the sample with pH 12. This result is supported by the higher absorbance of the sample with pH 10; however, these particles may have aggregated into a large cluster, resulting in a smaller energy band gap than the sample at pH 12.
3.3. Effect of agitation methods paired with the MPR and capping agent on the number of particles and band gap energy
Based on the findings of our preliminary study, the parameters for the subsequent experiments were a precursor concentration of 0.01 M, pH of 10, and treatment time of 25 min. Fig. 5 shows the UV-Vis spectra and Tauc plots of cobalt oxide nanoparticles formed under different agitation conditions and in the presence of different capping agents.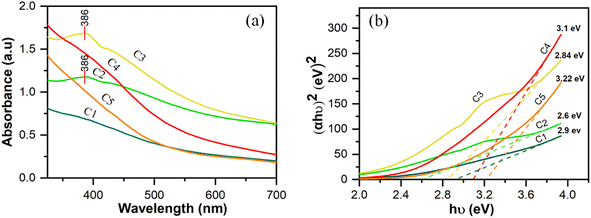 | ||
| Fig. 5 (a) UV-Vis spectra and (b) Tauc plot of cobalt oxide nanoparticles formed by varying the conditions in the microplasma reactor. | ||
The peak absorption wavelength of the cobalt nanoparticles is 386 nm. Absorption at 385 nm is considered characteristic of Co3O4 nanoparticles.35Fig. 5(a) shows that the number of cobalt oxide nanoparticles increased when the MPR was used in combination with a magnetic stirrer (sample C2) or ultrasonication-bath (sample C3) compared with samples C1 for which only the MPR was used without any agitation. The ultrasonication technique promotes the formation of single nanoparticles because it can divide large clusters of nanoparticles into smaller clusters or even disperse them into individual particles.37 For samples C4 and C5, to which urea and sucrose, respectively, were added as capping agents, the lower absorption compared with that of sample C2 is most probably due to the capping agent coating the metal salt. All the samples that were synthesized using microplasma produced stable Co3O4 nanoparticles, as shown in Fig. S3.† This was confirmed by re-recording the UV-Vis spectra of the samples after one month. These spectra indicated that the accrued shift in the peak wavelength of the Co3O4 nanoparticles was negligible. Because the peak wavelength reflects the particle size, an inconspicuous change in the peak wavelength can be assumed to indicate that the particle size did not change substantially.
The optical band gap energy increases when a capping agent is used; however, the difference between samples C4 and C5 is not significant. The band gap energy increases to a greater extent when the particle size decreases.38 Other studies have reported that cobalt oxide nanoparticles with Eg between 2.20 eV and 3.45 eV were applied as photocatalysts,39 and those with Eg ∼ 4 eV as solar cells.10Table 1 provides the band gap energy for all samples.
| Samples | C1 | C2 | C3 | C4 | C5 |
|---|---|---|---|---|---|
| E g (eV) | 2.9 | 2.6 | 2.84 | 3.1 | 3.2 |
3.4. Structural and morphological properties
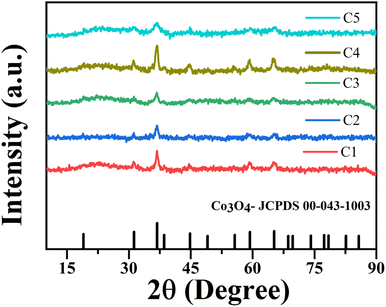
Fig. 6 shows the XRD patterns of nanoparticles that were synthesized using microplasma combined with different agitation conditions and capping agents after calcination. The XRD patterns have well-resolved diffraction peaks at 2θ values of 31.27°, 36.85°, 38.55°, 44.81°, 55.66°, 59.35°, and 65.23°, which are associated with the hkl values (220), (311), (222), (400), (422), (511), and (440), respectively. These results correspond with the 2θ and hkl values obtained from JCPDS card no. 00-043-1003 for cobalt oxide Co3O4. Fig. S4† shows the XRD patterns of all the samples without calcination, which clearly show the peaks of cobalt hydroxide (Co(OH)2) and sodium nitrate (NaNO3). After calcination, Co(OH)2 was converted to Co3O4, whereas NaNO3 was completely removed. The crystallite size (D) of the nanoparticles was determined by using Debye Scherrer's formula (eqn (2)).26 | (3) |
| Samples | C1 | C2 | C3 | C4 | C5 |
|---|---|---|---|---|---|
| Crystallite (nm) | 9.8 | 13.3 | 11.4 | 9.3 | 8.5 |
| Particle size (nm) | 17.7 | 15.2 | 11.7 | 11.1 | 10.9 |
The effect of using a magnetic stirrer and ultrasonication bath to homogenize the particle size distribution is unmistakable (Fig. 7, 8, and Table 2) and is confirmed by the particle size analysis using Image-J software.
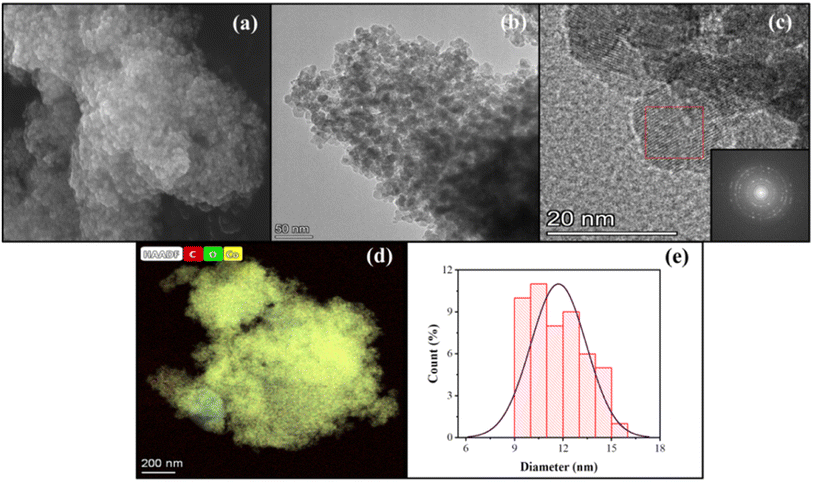 | ||
| Fig. 7 Images of sample C3: (a) SEM, (b) TEM, (c) FFT, (d) TEM-EDS, and (e) particle size distribution. | ||
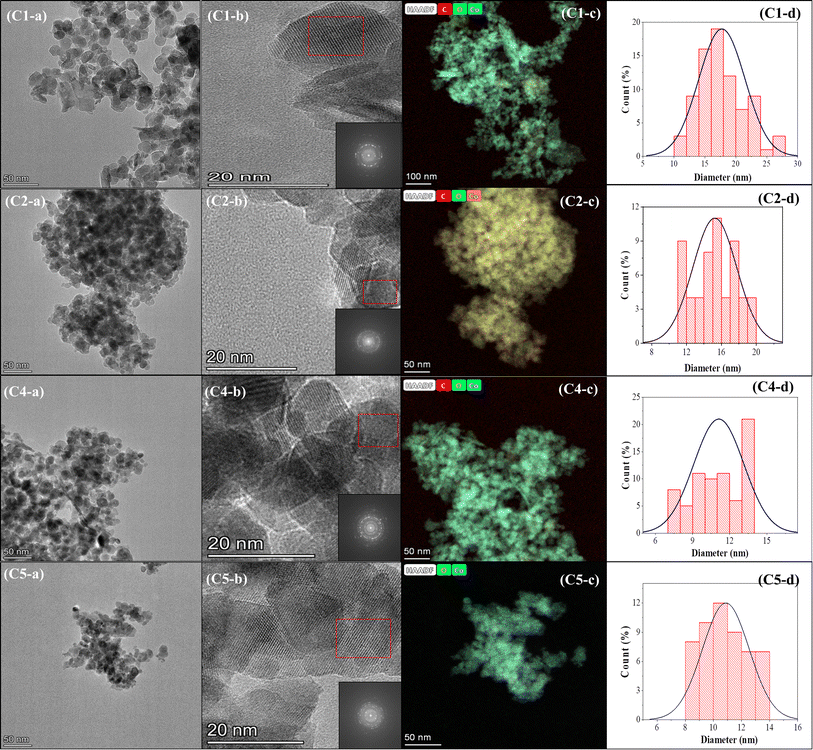 | ||
| Fig. 8 TEM analysis of samples C1, C2, C4, and C5: (a) TEM, (b) FFT, (c) TEM-EDS, and (d) particle size distribution. | ||
The ultrasonication method, which utilizes the physical phenomenon of acoustic cavitation, is capable of influencing the particle morphology and of generating particles of metal oxide materials with a significantly large surface area.40,41Table 2 presents the sizes of crystallites and particles of the Co3O4 samples synthesized using the MPR with or without external agitation and with or without the capping agent. The different sizes in the table indicate that ultrasonication can have an impact on the size and particle size distribution of the nanoparticles. The cobalt nanoparticles produced by combining the MPR with ultrasonication are on average 11.7 nm, which are around 3.5 nm smaller than the particles produced by combining the MPR with magnetic stirring (15.2 nm). However, the cobalt oxide nanoparticles synthesized using the MPR without stirring are slightly larger (17.7 nm) than those synthesized using the MPR in combination with both magnetic stirring and ultrasonication. This is because, without stirring or ultrasonication, the precursor particles experience almost no movement, enabling only those particles around the microplasma discharge to continuously interact with reactive species. This has the effect of widening the particle size distribution of sample C1 (5–25 nm) compared to samples C2 and C3 that have narrow particle size distribution (11–20 nm and 9–15 nm, respectively) (Fig. 7 and 8). The particle size of the samples treated with a capping agent was smaller than that of the other samples because the clusters of individual nanoparticles that formed were covered by the capping agent, which prevented the formation of nanoparticles due to agglomeration. According to the TEM and SEM results, the ratio and type of capping agent did not have any particular effect in terms of preventing agglomeration. Thus, further investigation is needed to determine the ratio of the capping agent to the metal salt precursor or the use of other types of capping agents to improve their ability to prevent agglomeration during the production of cobalt oxide nanoparticles.
3.5. X-ray photoelectron spectroscopy (XPS) analysis
The chemical states and composition of the synthesized cobalt oxide nanoparticles were analyzed using X-ray photoelectron spectroscopy (XPS). As shown in Fig. 9, the Co 2p3/2 and Co 2p1/2 peaks, which are major binding energy (BE) peaks, varied from 779.38 to 779.68 and 794.38 to 794.68 eV, respectively, across all samples. The CoO and Co3O4 spinel phases have similar 2p binding energies, making it challenging to distinguish between them. However, the difference in energy spacing (ΔE) between the Co 2p3/2 and Co 2p1/2 peaks, which is 15.0 eV for Co3O4 and 16.0 eV for CoO, can be used to differentiate between the two. Furthermore, the presence of two shake-up satellites is a characteristic feature of the spinel phase Co3O4.42–44Table 3 presents the results of the analysis, indicating that all samples have a ΔE value of 15.0 and two shake-up satellites, confirming that the samples are in the Co3O4 phase with Co 2p3/2 peaks around 779.38 to 779.68 eV.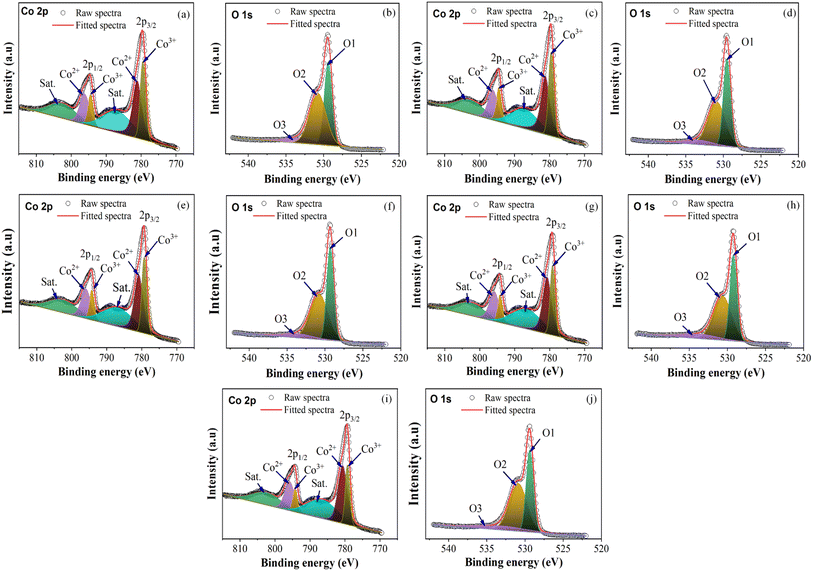 | ||
| Fig. 9 Co 2p and O 1s XPS spectra: (a and b) C1, (c and d) C2, (e and f) C3, (g and h) C4, and (i and j) C5. | ||
| Sample | Co 2p (eV) | ΔE (eV) | Satellite (eV) | O 1s (eV) | ||||
|---|---|---|---|---|---|---|---|---|
| 2p3/2 | 2p1/2 | S1 | S2 | O1 | O2 | O3 | ||
| C1 | 779.68 | 794.68 | 15.0 | 787.18 | 803.48 | 529.38 | 530.78 | 533.48 |
| C2 | 779.68 | 794.68 | 15.0 | 787.48 | 803.68 | 529.48 | 530.88 | 533.68 |
| C3 | 779.48 | 794.48 | 15.0 | 787.28 | 803.58 | 529.28 | 530.78 | 534.08 |
| C4 | 779.38 | 794.38 | 15.0 | 786.98 | 803.48 | 529.18 | 530.68 | 534.38 |
| C5 | 779.48 | 794.48 | 15.0 | 787.18 | 803.48 | 529.38 | 530.88 | 534.68 |
In Fig. 9(b), (c), (f), (g), and (j), the O 1s spectra have peaks corresponding to O1, which represents the peaks of metal oxides (Co–O), O2, which indicates oxygen vacancies, and O3, which denotes surface hydroxyl molecules (Co–OH). Across all samples, the O1, O2, and O3 peaks have binding energy values that vary from 529.18 to 529.48 eV, 530.68 to 530.88 eV, and 533.48 to 534.68 eV, respectively. The presence of oxygen vacancies is a critical factor that must be considered when developing nanoparticle materials for applications such as catalysts, solar cells, sensors, and energy storage.45–47 Additionally, the presence of the O1 peak in the XPS profiles of all the samples confirmed that Co3O4 was successfully synthesized with the microplasma. Table 3 presents the XPS results for all the samples. All the values reported in Table 3 are in agreement with those reported in the literature.48–50
3.6. The comparison of various methods for the synthesis of cobalt oxide nanoparticles
Table 4 presents a comparison of various methods, including the microplasma method (this work), for synthesizing cobalt oxide nanoparticles. The nanoparticles synthesized through this method utilize distillate water as a solvent, which is environmentally friendly. In contrast, other methods employ hazardous solvents such as ethylene glycol, thioglycolic acid, ammonium oxalate, or ethanol. Furthermore, our method enables the synthesis of Co3O4 nanoparticles with a particle size smaller than 20 nm within a treatment time of just 25 minutes. This stands in contrast to other processes that require over 2 hours for nanoparticle synthesis.| Method | Material | Solvent | Treatment time | Temperature (°C) | Sintering/calcination | Size (nm) | Cobalt oxide phase | Ref. | |
|---|---|---|---|---|---|---|---|---|---|
| Temperature (°C) | Time (h) | ||||||||
| Sol gel | Cobalt nitrate hexahydrate | Ethylene glycol | >2 h | 1st step at room temperature, 2nd step at 120 | 700 | 1, 2, & 3 | 60.099, 52.611, & 84.168 | Co3O4 | 15 |
| Cobalt nitrate hexahydrate | Distilled water | >2 h | 1st step at 30 and, 2nd step at 80 | 400 | 4 | 13–15 | Co3O4 | 16 | |
| Hydrothermal | Cobalt nitrate hexahydrate | Ethylene glycol | 6 h | 100 | In N2 gas at 450 and 550 | 3 | 25, 38, and 51 | Co3O4 and Co3O4/CoO | 4 |
| Cobalt nitrate hexahydrate | Distilled water and thioglycolic acid (TGA) | 5–7 h | 100–160 | — | — | 17.5 | Co3O4 | 10 | |
| Cobalt nitrate tetrahydrate | Deionized water | 6 h | 180 | 450 | 5 h (ramp of 10 °C min−1) | 51, 38, & 25 | Co3O4 | 17 | |
| Cobalt nitrate hexahydrate | Deionized water | 30 h | 150 | 100 | Co3O4 | 51 | |||
| Solvothermal | Cobalt acetate tetrahydrate | Ethanol | 1st step at 160 °C for 2 h, supernatant from 1st step standing for 72 h | In air gas at 200, 350, 300, & 350 | 10 (ramp of 1 °C min−1) | 5.5, 7.5, 8.6, 10.5 | Co3O4 | 6 | |
| Cobalt nitrate hexahydrate and cobalt acetate tetrahydrate | Ethanol | 5 h | 250 | 250 | 3, 6, and 16 h | 70 | Co3O4 | 52 | |
| Cobalt(II) and (III) acetylacetonate | Mixed solution between ethanol and distilled water (1![[thin space (1/6-em)]](https://www.rsc.org/images/entities/char_2009.gif) : :![[thin space (1/6-em)]](https://www.rsc.org/images/entities/char_2009.gif) 15) 15) |
8 h | 120, 140, 160, 180, 200 | 500 | 5 h | 40 | Co3O4 | 53 | |
| Spray pyrolysis | Cobalt nitrate | Ethylene glycol | — | — | 500 to 800 in an air atmosphere | — | 12, 27, and 43 | Co3O4 | 18 |
| Microemulsion | Cobalt acetate tetrahydrate | Water and ammonium oxalate | — | — | — | — | 25 and 35 | Co and Co3O4 | 19 |
| Cobalt 2-ethylhexanoate and cobalt nitrate hexahydrate | Water | — | — | — | — | 3–10 | Co3O4 | 20 | |
| Microplasma | Cobalt nitrate hexahydrate | Distilled water | 25 min | — | 450 | 4 | 10–17 | Co3O4 | This work |
4. Conclusion
Based on our findings, we concluded that microplasma in liquid can be used to successfully synthesize Co3O4 nanoparticles within a specific size range. The combination of a MPR with a ultrasonication bath enabled the production of smaller particles than those synthesized without stirring, or with stirring but without ultrasonication, from the precursor without a capping agent. The impact of capping agents, such as urea and sucrose, on the morphology of Co3O4 was inconclusive. Although capping agents can reduce the size of nanoparticles, they can also affect the number of particles generated. Therefore, further research is necessary to determine the appropriate type and concentration of capping agent to use with the metal salt to prevent particle growth and agglomeration and produce nanoparticles with the desired shape.Data availability
The raw/processed data required to reproduce these findings can be shared upon reasonable request to the corresponding author.Author contributions
S. T.: conceptualization, methodology, investigation, visualization, data curation, and writing-original draft; Md. M. H. & R. M. B.: formal analysis, characterization, and validation; S. S., A. D., M. C. H. P. L., A. A., & V. T. N.: validation and writing-review & editing; Y. S. M.: supervision, writing-review & editing, resources, funding acquisition, and validation.Conflicts of interest
The authors declare that they have no known competing financial interests or personal relationships that could have appeared to influence the work reported in this paper.Acknowledgements
This work was supported by the Basic Science Research Program through the National Research Foundation funded by the Korean government (MSIT) (2021R1A2C2011441 & 2021R1A4A2000934).References
- A. V. Nikam, B. L. V. Prasad and A. A. Kulkarni, CrystEngComm, 2018, 20, 5091–5107 RSC.
- A. S. Adekunle, J. A. O. Oyekunle, L. M. Durosinmi, O. S. Oluwafemi, D. S. Olayanju, A. S. Akinola, O. R. Obisesan, O. F. Akinyele and T. A. Ajayeoba, Nano-Struct. Nano-Objects, 2020, 21, 100405 CrossRef CAS.
- J. Y. Choi, C. K. Lim, B. Park, M. Kim, A. Jamal and H. Song, J. Mater. Chem. A, 2019, 7, 15068–15072 RSC.
- S. N. F. Moridon, M. N. I. Salehmin, K. Arifin, L. J. Minggu and M. B. Kassim, Appl. Sci., 2021, 11, 3031 CrossRef CAS.
- R. M. Bhattarai, K. Chhetri, N. Le, D. Acharya, S. Saud, M. C. H. P. L. Nguyen, S. J. Kim and Y. S. Mok, Carbon Energy, 2023, e392 CrossRef.
- F. Liu, H. Su, L. Jin, H. Zhang, X. Chu and W. Yang, J. Colloid Interface Sci., 2017, 505, 796–804 CrossRef CAS PubMed.
- R. M. Bhattarai, K. Chhetri, S. Saud, S. Teke, S. J. Kim and Y. S. Mok, ACS Appl. Nano Mater., 2021, 5, 160–175 CrossRef.
- K. Chhetri, B. Dahal, A. P. Tiwari, T. Mukhiya, A. Muthurasu, G. P. Ojha, M. Lee, T. Kim, S.-H. Chae and H. Y. Kim, ACS Appl. Energy Mater., 2020, 4, 404–415 CrossRef.
- D. Han, Y. Ji, F. Gu and Z. Wang, J. Colloid Interface Sci., 2018, 531, 320–330 CrossRef CAS PubMed.
- S. Ambika, S. Gopinath, K. Saravanan, K. Sivakumar, C. Ragupathi and T. A. Sukantha, Energy Rep., 2019, 5, 305–309 CrossRef.
- N. Arsalan, E. Hassan Kashi, A. Hasan, M. Edalat Doost, B. Rasti, B. Ahamad Paray, M. Zahed Nakhjiri, S. Sari, M. Sharifi, K. Shahpasand, K. Akhtari, S. Haghighat and M. Falahati, Int. J. Nanomed., 2020, 15, 4607–4623 CrossRef PubMed.
- E. Bossi, D. Zanella, R. Gornati and G. Bernardini, Sci. Rep., 2016, 6, 22254 CrossRef CAS PubMed.
- H. Huang, J. Wang, J. Zhang, J. Cai, J. Pi and J. F. Xu, Pharmaceutics, 2021, 13, 1599 CrossRef CAS PubMed.
- N. Abid, A. M. Khan, S. Shujait, K. Chaudhary, M. Ikram, M. Imran, J. Haider, M. Khan, Q. Khan and M. Maqbool, Adv. Colloid Interface Sci., 2022, 300, 102597 CrossRef CAS PubMed.
- S. A. Sardjono and P. Puspitasari, Presented in part at the Proceedings of the 3rd International Seminar on Metallurgy and Materials (ISMM2019): Exploring New Innovation in Metallurgy and Materials, 2020 Search PubMed.
- C. I. Priyadharsini, G. Marimuthu, T. Pazhanivel, P. M. Anbarasan, V. Aroulmoji, V. Siva and L. Mohana, J. Sol-Gel Sci. Technol., 2020, 96, 416–422 CrossRef CAS.
- X. Xia, Z. Qiang, G. Bass, M. L. Becker and B. D. Vogt, Colloid Polym. Sci., 2018, 297, 59–67 CrossRef.
- D. Y. Kim, S. H. Ju, H. Y. Koo, S. K. Hong and Y. C. Kang, J. Alloys Compd., 2006, 417, 254–258 CrossRef CAS.
- J. Ahmed, T. Ahmad, K. V. Ramanujachary, S. E. Lofland and A. K. Ganguli, J. Colloid Interface Sci., 2008, 321, 434–441 CrossRef CAS PubMed.
- G. Carlo, M. Lualdi, A. Venezia, M. Boutonnet and M. Sanchez-Dominguez, Catalysis, 2015, 5, 442–459 Search PubMed.
- P. G. Jamkhande, N. W. Ghule, A. H. Bamer and M. G. Kalaskar, J. Drug Delivery Sci. Technol., 2019, 53, 101174 CrossRef CAS.
- M. K. Mun, W. O. Lee, J. W. Park, D. S. Kim, G. Y. Yeom and D. W. Kim, Appl. Sci. Converg. Technol., 2017, 26, 164–173 CrossRef.
- P. J. Bruggeman, M. J. Kushner, B. R. Locke, J. G. E. Gardeniers, W. G. Graham, D. B. Graves, R. C. H. M. Hofman-Caris, D. Maric, J. P. Reid, E. Ceriani, D. Fernandez Rivas, J. E. Foster, S. C. Garrick, Y. Gorbanev, S. Hamaguchi, F. Iza, H. Jablonowski, E. Klimova, J. Kolb, F. Krcma, P. Lukes, Z. Machala, I. Marinov, D. Mariotti, S. Mededovic Thagard, D. Minakata, E. C. Neyts, J. Pawlat, Z. L. Petrovic, R. Pflieger, S. Reuter, D. C. Schram, S. Schröter, M. Shiraiwa, B. Tarabová, P. A. Tsai, J. R. R. Verlet, T. von Woedtke, K. R. Wilson, K. Yasui and G. Zvereva, Plasma Sources Sci. Technol., 2016, 25, 053002 CrossRef.
- Q. Chen, J. Li and Y. Li, J. Phys. D: Appl. Phys., 2015, 48, 424005 CrossRef.
- L. Lin and Q. Wang, Plasma Chem. Plasma Process., 2015, 35, 925–962 CrossRef CAS.
- V. Gamaleev, K. Kajikawa, K. Takeda and M. Hiramatsu, C, 2018, 4, 65 CAS.
- H. Yuan, J. Feng, D.-Z. Yang, X.-F. Zhou, J.-P. Liang, L. Zhang, Z.-L. Zhao and W.-C. Wang, J. Appl. Phys., 2020, 128, 093303 CrossRef CAS.
- C. Du and M. Xiao, Sci. Rep., 2014, 4, 7339 CrossRef CAS PubMed.
- E. R. Kavitha, S. Meiyazhagan, S. Yugeswaran, P. Balraju and K. Suresh, Int. J. Energy Res., 2020, 45, 7038–7056 CrossRef.
- X. Li, C.-X. Zhao and L. Lin, Chem. Eng. Sci., 2022, 260, 117849 CrossRef CAS.
- I. G. Koo, M. S. Lee, J. H. Shim, J. H. Ahn and W. M. Lee, J. Mater. Chem., 2005, 15, 4125–4128 RSC.
- T. Yan, X. Zhong, A. E. Rider, Y. Lu, S. A. Furman and K. K. Ostrikov, Chem. Commun., 2014, 50, 3144–3147 RSC.
- Y. Zhou, Y. Hong, Z. Li, Z. Bi, J. Zhang, J. Niu, J. Pan, J. Li and Y. Wu, Vacuum, 2019, 162, 121–127 CrossRef CAS.
- P. N. Sibiya and M. J. Moloto, Chalcogenide Lett., 2014, 11, 577–588 Search PubMed.
- O. I. Medvedeva, S. S. Kambulova, O. V. Bondar, A. R. Gataulina, N. A. Ulakhovich, A. V. Gerasimov, V. G. Evtugyn, I. F. Gilmutdinov and M. P. Kutyreva, J. Nanotechnol., 2017, 2017, 1–9 CrossRef.
- M. Singh, M. Goyal and K. Devlal, J. Taibah Univ. Sci., 2018, 12, 470–475 CrossRef.
- A. Asadi, F. Pourfattah, I. Miklos Szilagyi, M. Afrand, G. Zyla, H. Seon Ahn, S. Wongwises, H. Minh Nguyen, A. Arabkoohsar and O. Mahian, Ultrason. Sonochem., 2019, 58, 104701 CrossRef CAS PubMed.
- S. A. Makhlouf, Z. H. Bakr, K. I. Aly and M. S. Moustafa, Superlattices Microstruct., 2013, 64, 107–117 CrossRef CAS.
- S. Farhadi, M. Javanmard and G. Nadri, Acta Chim. Slov., 2016, 335–343, DOI:10.17344/acsi.2016.2305.
- Z. L. Goh, N. M. Saidi, N. K. Farhana, S. Bashir, J. Iqbal, K. Ramesh, S. Ramesh, S. Wageh and A. Kalam, Sustain. Energy Technol. Assess., 2022, 49, 101746 Search PubMed.
- N. M. Saidi, F. S. Omar, A. Numan, D. C. Apperley, M. M. Algaradah, R. Kasi, A. J. Avestro and R. T. Subramaniam, ACS Appl. Mater. Interfaces, 2019, 11, 30185–30196 CrossRef CAS PubMed.
- P. W. Menezes, A. Indra, V. Gutkin and M. Driess, Chem. Commun., 2017, 53, 8018–8021 RSC.
- C. Alex, S. C. Sarma, S. C. Peter and N. S. John, ACS Appl. Energy Mater., 2020, 3, 5439–5447 CrossRef CAS.
- R. M. Bhattarai, S. Moopri Singer Pandiyarajan, S. Saud, S. J. Kim and Y. S. Mok, Dalton Trans., 2020, 49, 14506–14519 RSC.
- G. L. Kabongo, T. N. Y. Khawula, T. Thokozani, E. G. Nyongombe, K. Ozoemena and S. Dhlamini, J. Nanosci.: Curr. Res., 2018, 3, 1000125 Search PubMed.
- Q. Ma, F. Cui, J. Zhang, X. Qi and T. Cui, Appl. Surf. Sci., 2022, 578, 152001 CrossRef CAS.
- S. Xie, Y. Liu, J. Deng, J. Yang, X. Zhao, Z. Han, K. Zhang and H. Dai, J. Catal., 2017, 352, 282–292 CrossRef CAS.
- J. Yang, H. Liu, W. N. Martens and R. L. Frost, J. Phys. Chem. C, 2009, 114, 111–119 CrossRef.
- J. L. Gautier, E. Rios, M. Gracia, J. F. Marco and J. R. Gancedo, Thin Solid Films, 1997, 311, 51–57 CrossRef CAS.
- R. Guo, R. Wang, Z. Ni and X. Liu, Appl. Phys. A: Mater. Sci. Process., 2018, 124, 623 CrossRef.
- X. Zhao, Y. Liu, J. Wang, L. Qian, L. Yao, Z. Chen, Q. Cai, X. Xing and Z. Wu, Inorg. Chem., 2019, 58, 7054–7061 CrossRef CAS PubMed.
- Q. Yuanchun, Z. Yanbao and W. Zhishen, Mater. Chem. Phys., 2008, 110, 457–462 CrossRef.
- A. UmaSudharshini, M. Bououdina, M. Venkateshwarlu, C. Manoharan and P. Dhamodharan, Surf. Interfaces, 2020, 19, 100535 CrossRef CAS.
Footnote |
| † Electronic supplementary information (ESI) available. See DOI: https://doi.org/10.1039/d3na00249g |
| This journal is © The Royal Society of Chemistry 2023 |

