 Open Access Article
The effects of calcination on the electrochemical properties of manganese oxides
Xinyu
Dong
 ab,
Haifeng
Wang†
abc,
Jiawei
Wang
*abc,
Yue
He
ab,
Pan
Yang
ab,
Haifeng
Wang†
abc,
Jiawei
Wang
*abc,
Yue
He
ab,
Pan
Yang
 ab,
Song
Wang
ab,
Xiaoliang
Chen
ab,
Chunyuan
Yang
ab and
Fanghai
Lu
d
ab,
Song
Wang
ab,
Xiaoliang
Chen
ab,
Chunyuan
Yang
ab and
Fanghai
Lu
d
aSchool of Materials and Metallurgy, Guizhou University, Guiyang, Guizhou 550025, China. E-mail: jwwang@gzu.edu.cn
bGuizhou Provincial Engineering Technology Research Center of Manganese Materials for Batteries, Tongren 554300, Guizhou, China
cGuizhou Provincial Key Laboratory of Metallurgical Engineering and Energy Saving, Guiyang, 550025, China
dSchool of Materials and Energy Engineering, Guizhou Institute of Technology, Guiyang, Guizhou 550002, China
First published on 31st August 2023
Abstract
Three different crystalline forms of Mn3O4 were successfully prepared by a liquid phase method with different additives. Using XRD, SEM, EDS, BET, compacted density and electrochemical analysis, the effects of different additives on the morphology, phase composition, surface characteristics, specific surface area, electrochemical and other physical and chemical properties of manganese oxides were investigated. The results showed that the rod type Mn3O4 was prepared by mixing ammonia water and anhydrous ethanol in a 1![[thin space (1/6-em)]](https://www.rsc.org/images/entities/char_2009.gif) :
:![[thin space (1/6-em)]](https://www.rsc.org/images/entities/char_2009.gif) 1 ratio and an appropriate amount of cetylmethyl ammonium bromide as the additive. The rod-type Mn3O4 showed a maximum specific surface area of 63.87 m2 g−1 and has the advantages of low compaction density, no introduction of other impurities, and high adsorption potential. It also has excellent electrochemical performance and an impedance of 240 Ω. The specific capacity was as high as 666.5 mA h g−1 at 1C current density and 382.2 mA h g−1 after 200 cycles. The results also showed that the electrochemical performance of Mn2O3 prepared at 700 °C from the rod-type Mn3O4 was the best. When it was used as the anode material of a lithium-ion battery, it showed a high specific capacity of 712.1 mA h g−1 after 200 cycles. Therefore, the rod-type Mn2O3 material has the characteristics of high capacity, low cost and environmental friendliness and is a promising candidate anode material for lithium-ion batteries.
1 ratio and an appropriate amount of cetylmethyl ammonium bromide as the additive. The rod-type Mn3O4 showed a maximum specific surface area of 63.87 m2 g−1 and has the advantages of low compaction density, no introduction of other impurities, and high adsorption potential. It also has excellent electrochemical performance and an impedance of 240 Ω. The specific capacity was as high as 666.5 mA h g−1 at 1C current density and 382.2 mA h g−1 after 200 cycles. The results also showed that the electrochemical performance of Mn2O3 prepared at 700 °C from the rod-type Mn3O4 was the best. When it was used as the anode material of a lithium-ion battery, it showed a high specific capacity of 712.1 mA h g−1 after 200 cycles. Therefore, the rod-type Mn2O3 material has the characteristics of high capacity, low cost and environmental friendliness and is a promising candidate anode material for lithium-ion batteries.
1 Introduction
Over the past two decades, rechargeable lithium-ion batteries (LIB) have become the main power source for portable electronic devices and they play an important role in the power supply of pure electric or hybrid electric vehicles.1 Due to the continuous increase in the demand for batteries in recent years, in-depth research on new electrode materials with high energy density and good safety has become the current research trend. To meet the requirements of the rapidly growing energy storage market for high-power and energy storage systems, many attempts have been made to develop high-capacity anode materials to replace graphite.2,3 Nanostructured metal oxides have been studied widely as anode materials for new-generation lithium-ion batteries because of their higher specific capacity than graphite.4,5 Compared with iron, cobalt and nickel-based oxides, manganese oxides have lower discharge voltage and charging voltage and higher energy density.6 Manganese oxide, as a new cheap anode material for lithium-ion batteries, is gradually attracting attention. Its many valence states and complex oxide structure lead to the diversity of its surface properties and corresponding electrochemical properties.7,8 At present, a large number of studies have reported that MnO2, Mn2O3 and Mn3O4 are used as anode materials for lithium-ion batteries, and their theoretical capacities are 937 mA h g−1, 1018 mA h g−1 and 1223 mA h g−1, respectively, which are much higher than the theoretical capacity of commercial fossil ink (372 mA h g−1); thus, they have good application prospects.9–11 It is well known that the size and morphology of electrode materials have a significant impact on the electrochemical performance of batteries.12 Micron-sized spherical materials with a suitable porous structure can not only increase their energy density but also improve their rate performance. It is currently a trend to synthesize heat treatment precursors by high-temperature solid-state methods.13,14Manganese oxide is readily available, environmentally friendly, and is an excellent electrode material for supercapacitors. However, the specific capacitance of manganese oxide is not ideal due to its low conductivity and large internal resistance. Improving the conductivity of manganese oxide, reducing its internal resistance and improving its electrochemical performance are the focus of its research.15–17 The synthesis method affects the crystal structure type, micromorphology and electrochemical performance of manganese oxide, and Mn2O3 is no exception. Liu et al. have done some preliminary work on the application of Mn2O3 in lithium-ion batteries. They found that when the current density is 0.25 mA cm−2 and the voltage window is 0.2–3.0 V (vs. Li/Li+), the discharge specific capacity and charge specific capacity of Mn2O3 can reach 1080 mA h g−1 and 480 mA h g−1 respectively, but there is a significant capacity degradation after 20 cycles.18–20 Qiu et al. synthesized multistage structure Mn2O3 with different morphologies (olive and straw bundle) and calcined it to obtain manganous oxide with a porous structure. Compared with commercial Mn2O3, the two mesoporous Mn2O3 nanomaterials have higher reversible specific capacity and excellent cycling performance. After 150 cycles at a current density of 200 mA h g−1, the reversible specific capacities of rice straw bundle-like and olive-like Mn2O3 nanostructures are 380 and 320 mA h g−1, respectively.21 The rice straw bunched Mn2O3 has a good capacity retention rate because it has a relatively high specific surface area and a unique nano ribbon structure that reduces the transmission distance of lithium ions.21 Li et al. reported copper-doped Mn2O3 microspheres, providing a new method for improving the lithium storage performance of Mn2O3. The specific capacity of the Mn2O3 electrode material doped with copper was up to 642 mA h g−1 after 100 cycles at a current density of 100 mA h g−1.22 They believe that the substantial improvement in the electrochemical lithium storage performance is mainly due to the improvement of the material conductivity and lithium-ion diffusion rate.
From the methods above, it can be seen that Mn2O3 is mostly synthesized by calcining the precursor, and different morphology, particle size, and pore size distributions will significantly affect the electrochemical performance.23,24 However, there are few reports on how the morphology and particle size affect the electrochemical performance of montmorillonite, which is also one of the problems to be solved at present.25,26 Porous microsphere Mn2O3, nano-cone Mn2O3, porous nano-slice Mn2O3, cube Mn2O3, and spindle Mn2O3 have been synthesized, successively.27–31 Although the electrochemical performance of Mn2O3 has been improved to a certain extent through morphology optimization, the systematic research in this area is not deep enough. Therefore, in this study, we prepared Mn2O3 by the air oxidation of manganese sulfate solution and studied its performance to obtain manganese-based anode materials with higher discharge specific capacity and better cycling performance. This method has the advantages of simple operation, low cost, good economic benefits, and good product crystal structure with uniform size and particle size.
2 Experimental
2.1 Raw materials and equipment
Analytically pure manganese sulfate monohydrate (MnSO4·H2O, AR), sodium hydroxide (NaOH, AR), hydrogen peroxide (H2O2, AR) and absolute ethanol (C2H5OH, AR) were obtained from Sinopharm Chemical Reagent Co., Ltd. Ammonia (25–28% AR) was obtained from Tianjin Kemio Chemical Reagent Co., Ltd. Isopropyl alcohol (C3H8O, AR) was obtained from Tianjin Fuyu Fine Chemical Co., Ltd.The equipment used included a digital pH meter (AZ8601), thermostatic water bath (HH-3), thermostatic drying oven (DHG-9005A), vacuum suction pump (P4Z), electronic analytical balance (PL2002), and precision booster electric agitator (JJ-1).
2.2 Preparation of Mn3O4
Firstly, analytically pure manganese sulfate monohydrate was used to prepare a manganese sulfate solution with a Mn2+ concentration of 30 g L−1. Secondly, 500 ml of manganese sulfate solution was added to a beaker and heated in a water bath at a stirring speed of 200 rpm, followed by the addition of 10 ml isopropyl alcohol when the temperature reached 45 °C. Air washed with lime water was introduced into the beaker to blow the solution, and the airflow was 2 L h−1. Three pH regulators were slowly added into the beaker and when the pH reached 8, the mixing was stopped. These three pH regulators were ammonia water, sodium hydroxide, and compound formula additives (ammonia water and anhydrous ethanol were mixed at a 1![[thin space (1/6-em)]](https://www.rsc.org/images/entities/char_2009.gif) :
:![[thin space (1/6-em)]](https://www.rsc.org/images/entities/char_2009.gif) 1 ratio and then 2 g of cetylmethyl ammonium bromide was added). Finally, the solid product of the reaction was washed with ethanol several times and then filtered. It was dried at 80 °C for 12 h and then ground for subsequent performance analysis. The Mn3O4 was prepared with different additives (ammonia water, sodium hydroxide, and compound formula additive: ammonia water and anhydrous ethanol). Finally, the solid product of the reaction was washed several times with ethanol, filtered, dried at 80 °C for 12 h and then ground for sample preparation for subsequent performance analysis. The Mn3O4 samples prepared with three pH regulators (ammonia water, sodium hydroxide and compound additives) were named Mn3O4NH, Mn3O4NA and Mn3O4AD, respectively.
1 ratio and then 2 g of cetylmethyl ammonium bromide was added). Finally, the solid product of the reaction was washed with ethanol several times and then filtered. It was dried at 80 °C for 12 h and then ground for subsequent performance analysis. The Mn3O4 was prepared with different additives (ammonia water, sodium hydroxide, and compound formula additive: ammonia water and anhydrous ethanol). Finally, the solid product of the reaction was washed several times with ethanol, filtered, dried at 80 °C for 12 h and then ground for sample preparation for subsequent performance analysis. The Mn3O4 samples prepared with three pH regulators (ammonia water, sodium hydroxide and compound additives) were named Mn3O4NH, Mn3O4NA and Mn3O4AD, respectively.
2.3 Preparation of Mn2O3
Mn3O4AD powder prepared by a composite pH regulator was used as the raw material. Here, 3 g of the powder was weighed and placed in a muffle furnace and calcined for 8 hours under a certain temperature and air atmosphere to prepare Mn2O3. When the calcination temperature was 400 °C, 500 °C, 600 °C, 700 °C and 800 °C, the prepared Mn2O3 was named Mn2O3-400 °C, Mn2O3-500 °C, Mn2O3-600 °C, Mn2O3-700 °C and Mn2O3-800 °C, respectively.2.4 Characterization of material properties
![[thin space (1/6-em)]](https://www.rsc.org/images/entities/char_2009.gif) :
:![[thin space (1/6-em)]](https://www.rsc.org/images/entities/char_2009.gif) 2
2![[thin space (1/6-em)]](https://www.rsc.org/images/entities/char_2009.gif) :
:![[thin space (1/6-em)]](https://www.rsc.org/images/entities/char_2009.gif) 1 and mixed and ground to produce a black paste slurry. The black paste slurry was uniformly coated on copper foil and dried in a vacuum drying oven (110 °C) for 12 h. Next, the copper foil was taken out and cut into a positive membrane with a diameter of 16 mm. Finally, the CR2032 button battery was assembled in a dry glove box filled with high-purity argon (99.999%) (H2O ≤ 0.5 ppm); manganese oxide was the positive electrode, lithium metal sheet was as the negative electrode, polypropylene microporous membrane (Celgard2400) was the diaphragm, and 1 mol L−1 LiPF6 solution was the electrolyte. The volume ratio of ethylene carbonate (EC), 1,2-dimethylcarbonate (DMC), and ethyl methyl carbonate (EMC) in the electrolyte solvent was 1
1 and mixed and ground to produce a black paste slurry. The black paste slurry was uniformly coated on copper foil and dried in a vacuum drying oven (110 °C) for 12 h. Next, the copper foil was taken out and cut into a positive membrane with a diameter of 16 mm. Finally, the CR2032 button battery was assembled in a dry glove box filled with high-purity argon (99.999%) (H2O ≤ 0.5 ppm); manganese oxide was the positive electrode, lithium metal sheet was as the negative electrode, polypropylene microporous membrane (Celgard2400) was the diaphragm, and 1 mol L−1 LiPF6 solution was the electrolyte. The volume ratio of ethylene carbonate (EC), 1,2-dimethylcarbonate (DMC), and ethyl methyl carbonate (EMC) in the electrolyte solvent was 1![[thin space (1/6-em)]](https://www.rsc.org/images/entities/char_2009.gif) :
:![[thin space (1/6-em)]](https://www.rsc.org/images/entities/char_2009.gif) 1
1![[thin space (1/6-em)]](https://www.rsc.org/images/entities/char_2009.gif) :
:![[thin space (1/6-em)]](https://www.rsc.org/images/entities/char_2009.gif) 1. The constant current charge–discharge performance, magnification performance and cycle performance of the battery were tested using the CT-4008T-5V battery test system, and the voltage range was 0.01–3.0 V. The charge–discharge experiment was carried out at a constant temperature of 25 °C. The cyclic voltammetry study of the battery was done using a CH1660D electrochemical workstation, the test voltage range was 0.01–3.0 V, and the scanning speed was 0.1 mV s−1. The AC impedance spectrum, fitting circuit, AC impedance and other parameters of the battery were tested, the test voltage range was 0.01–3.0 V, and the frequency range was 0.01 Hz−100 kHz.
1. The constant current charge–discharge performance, magnification performance and cycle performance of the battery were tested using the CT-4008T-5V battery test system, and the voltage range was 0.01–3.0 V. The charge–discharge experiment was carried out at a constant temperature of 25 °C. The cyclic voltammetry study of the battery was done using a CH1660D electrochemical workstation, the test voltage range was 0.01–3.0 V, and the scanning speed was 0.1 mV s−1. The AC impedance spectrum, fitting circuit, AC impedance and other parameters of the battery were tested, the test voltage range was 0.01–3.0 V, and the frequency range was 0.01 Hz−100 kHz.
3 Results and discussion
3.1 Physical and chemical properties of Mn3O4
The phase diagram of manganese trioxide prepared with different pH regulators is shown in Fig. 1.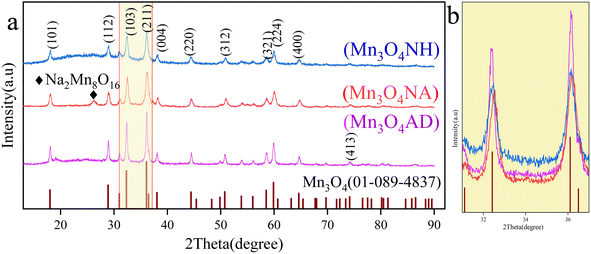 | ||
| Fig. 1 XRD patterns of Mn3O4 prepared with different pH regulators. (a) XRD patterns of Mn3O4; (b) partial enlarged view (2θ = 31–37°). | ||
Fig. 1 shows that the X-ray diffraction patterns of three samples are consistent with those of Mn3O4, with 2θ of 18.0°, 28.9°, 32.3°, 36.1°, 38.0°, 44.4°, 50.7° and 59.8°, corresponding to the (101), (112), (102), (103), (211), (220), (312) and (224) crystal planes of Mn3O4 (PDF # 01-089-4837), respectively. There was a small amount of sodium ion complex (Na2Mn8O16) in the Mn3O4NA sample at 2θ = 17.2°. This was caused by the use of sodium hydroxide. The Mn3O4NH sample has a serious burr, poor crystallinity and unstable structure. From the XRD pattern of the Mn3O4AD sample, the diffraction peak was significant, the baseline was stable, the crystallinity was good, and there were no other impurity diffraction peaks. Fig. 1(b) shows a magnified XRD pattern (2θ = 31.5–36.5°), in which the peak strength of the Mn3O4AD sample was the highest and the peak was sharp and narrow, indicating that the content of Mn3O4 was high. The peaks of Mn3O4NH and Mn3O4NA were not very high, the peaks were blunt (widened), and the crystallinity of the samples was low, so the grains were small. The addition of anhydrous ethanol and surfactant was helpful in the formation of crystals and improved crystallinity.
To further observe the structure and micromorphology of the prepared Mn3O4, they were tested by scanning electron microscopy. The SEM images of Mn3O4NH, Mn3O4NA and Mn3O4AD samples are shown in Fig. 2.
From the microscopic morphology in Fig. 2, it can be seen that Mn3O4NH material was formed by the agglomeration of irregular spherical particles. The particles were uniformly distributed, the particle size was small, about 80 nm, and the pores were large. The Mn3O4NA resulted from the agglomeration of regular spherical particles. The agglomeration was significant, the particle size was uneven, about 50–200 nm, and the pores were rich. The Mn3O4AD material was obtained by the stacking of regular rods; it had good dispersion, uniform distribution and small pores, which were conducive to the cycle penetration of lithium ions and reduced the ion diffusion resistance, resulting in good electrochemical potential. The addition of anhydrous ethanol and surfactant was conducive to adjusting the dispersion and morphology of the materials.
The oxygen and manganese elements and their ratios of Mn3O4NH, Mn3O4NA and Mn3O4AD are shown in Table 1.
| Product | Proportion of elements | The ratio of manganese to oxygen |
|---|---|---|
| Mn3O4NH | O: 33.19 | 1.36 |
| Mn: 45.15 | ||
| Mn3O4NA | O: 36.82 | 1.31 |
| Mn: 48.31 | ||
| Mn3O4AD | O: 43.12 | 1.29 |
| Mn: 55.82 |
From Table 1, the hydrolysis ability of Mn3O4NH, Mn3O4NA and Mn3O4AD materials could be judged; the smaller the ratio of manganese to oxygen, the greater the hydrolysis ability of the material. The hydrolysis ability of Mn3O4AD material was better, which was conducive to the formation of manganese hydroxide in solution, thus improving the precipitation efficiency of manganese oxides.
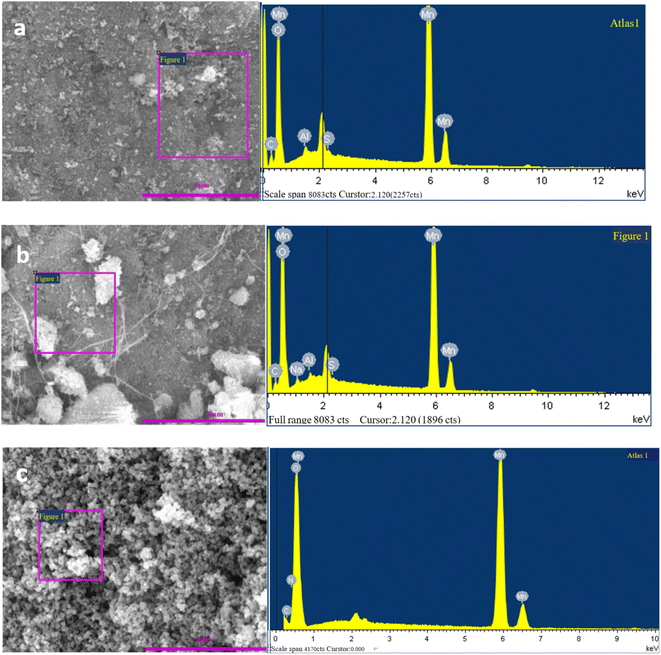
EDS images of Mn3O4 prepared by different pH regulators are shown in Fig. 3.
The main elements of the three materials were Mn and O, and there were small amounts of C, Al, S and other elements. A small amount of C may come from the filter paper on which manganese oxide was taken from the filter cake, while Al, S and other elements may come from the manganese sulfate raw materials. The EDS spectrum of the Mn3O4AD material showed that there was no other impurity diffraction peak, and the diffraction peaks of Al, S and other elements were small, indicating that the contents of Al, S and other elements were low. The oxygen content was 45.10%, and the manganese content was 53.51%; the ratio of manganese to oxygen was 1.18.
The specific surface area and tap density of different manganese tetroxides are shown in Table 2.
| Product | Mn3O4NH | Mn3O4NA | Mn3O4AD |
|---|---|---|---|
| Specific area/m2 g−1 | 30.88 | 46.43 | 60.47 |
| Tap density/g cm−3 | 1.38 | 1.12 | 1.11 |
The specific surface areas of Mn3O4NH, Mn3O4NA and Mn3O4AD materials were 30.88 m2 g−1, 46.43 m2 g−1 and 60.47 m2 g−1, respectively. The large specific surface area is conducive to increasing the contact area and efficiency of the lithium ions and materials, reducing the internal resistance of battery materials, thus improving the battery capacity and magnification performance. According to the compaction density analysis, the compaction density of Mn3O4AD was the smallest, indicating that its particles were fluffy and the gap between particles was large. This structure was conducive to the diffusion of lithium ions in solution, and the removal and insertion of lithium ions between Mn3O4AD molecules.
The nitrogen adsorption–desorption curves and pore size distribution of Mn3O4 prepared by different pH regulators are shown in Fig. 4.
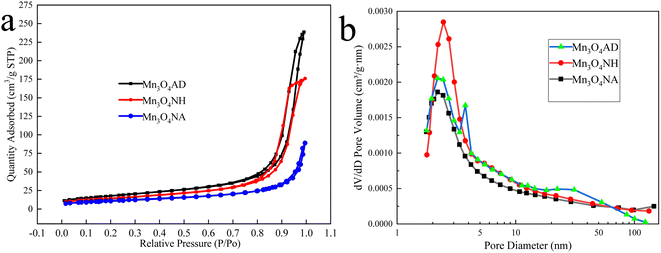 | ||
| Fig. 4 Preparation of Mn3O4 with different additives: (a) nitrogen adsorption and desorption curves, (b) pore size distribution. | ||
Fig. 4 shows that the N2 adsorption–desorption curves of the three materials all have hysteresis loops because the products had a pore structure, and there was a capillary shrinkage phenomenon in the structure, resulting in the non-coincidence of the isotherms obtained in the adsorption process and the desorption process. According to the comparison of IUPAC classification, the isotherms of the three manganese oxides belong to Class V, and the hysteresis ring type of Mn3O4NH, Mn3O4NA, and Mn3O4AD materials was H4, indicating that the pores of the products were slit pores generated by the layered structure, the pore structure was uniform, which was conducive to the interaction between the adsorbate and the adsorbent. The Mn3O4AD material has a better adsorption effect, indicating that it has more voids. Fig. 4(b) shows that the pore sizes of the three materials were mainly between 2 nm and 10 nm, indicative of a mesoporous structure.
3.2 Electrochemical properties of Mn3O4
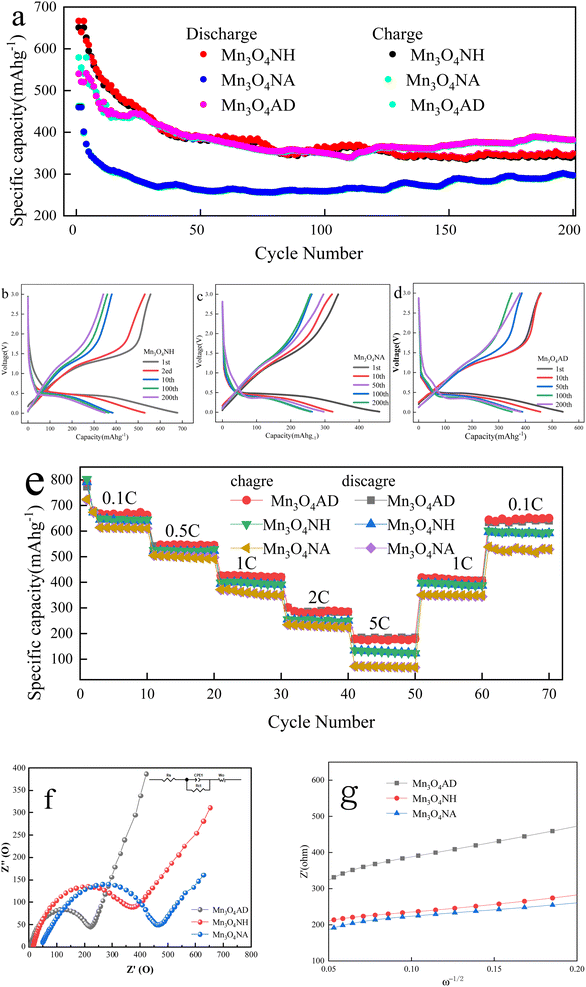
The electrochemical characterization of Mn3O4 prepared by different pH regulators is shown in Fig. 5.Fig. 5(a) shows that the first charge specific capacities of Mn3O4NH, Mn3O4NA and Mn3O4AD were 666.5 mA h g−1, 459.9 mA h g−1 and 579 mA h g−1, respectively, and the specific charging capacities were 349.2 mA h g−1, 296.1 mA h g−1 and 382.239 mA h g−1 after 200 cycles. The first discharge specific capacities of Mn3O4NH, Mn3O4NA and Mn3O4AD were 650 mA h g−1, 462 mA h g−1 and 540 mA h g−1, respectively. The specific discharge capacities were 341.9 mA h g−1, 297.0 mA h g−1 and 380.4 mA h g−1, respectively after 200 cycles. On comparing the above results, it was found that the specific capacity of Mn3O4AD for the first charge and discharge was slightly lower than that of Mn3O4NA but its specific capacity performance was better than that of Mn3O4NH and Mn3O4NA after 200 cycles so it had good cycle stability. The surface area of Mn3O4AD prepared with the composite pH regulator was large, which could reduce the diffusion distance of lithium ions and result in good electrochemical stability.
The constant current charge–discharge curves of Mn3O4NH, Mn3O4NA and Mn3O4AD are shown in Fig. 5(b)–(d) after 1, 10, 50, 100 and 200 cycles when the current density was 1C and the voltage range was 0.01–3.0 V. There was a long and relatively flat platform at about 0.4 V in the charging and discharging process of all three materials, corresponding to the insertion of lithium ions. The voltage platform appeared at 1.3 V in the first cycle and disappeared in the subsequent cycles. The appearance of the platform may be due to the formation of an irreversible solid electrolyte passivation film (SEI film) between the electrolyte and the electrode, which consumed some lithium ions and increased the irreversible capacity of the first charge, thus reducing the charge–discharge efficiency of the electrode, reducing the specific capacity of the second cycle, and reducing part of Mn3O4 to MnO. The reaction formula was as follows: Mn3O4 + 2Li + 2e− = 3MnO + LiO2.
Fig. 5(e) shows the multiplying performance curve of Mn3O4NH, Mn3O4NA and Mn3O4AD materials when the voltage range was 0.01–3.0 V. As the charge–discharge ratio increased from 0.1C to 5C, the charge–discharge specific capacities of the three samples showed a stepwise decline. This may be because the increase in current density enhanced the polarization effect of Li-ion migration in the electrode, which caused the migration rate of lithium ions to decrease. The specific capacities of Mn3O4AD materials were 689 mA h g−1, 546 mA h g−1, 432 mA h g−1, 283 mA h g−1 and 176 mA h g−1 after 10 cycles when the current densities were 0.2C, 0.5C, 1C, 2C and 5C. The specific capacities of Mn3O4AD materials were still as high as 662 mA h g−1 when the current density was adjusted back to 0.2C. It showed that this electrode material had excellent high current charge–discharge performance and cycle stability, and had certain advantages over the other two materials.
The equivalent circuit diagrams and AC impedance spectra (EIS) of Mn3O4NH, Mn3O4NA and Mn3O4AD are shown in Fig. 5(f). The frequency range of the test was 100 kHz–0.01 Hz, and the amplitude of the sinusoidal alternating wave was 5 mV. The curves were composed of a diagonal line in the low-frequency area and a semicircle in the high-frequency area. The diagonal line in the low-frequency area corresponded to the solid lithium-ion diffusion process, and the semicircle in the high-frequency area corresponded to the charge transfer process reaction and SEI film formation. The charge transfer resistance (Rct) of the material could be obtained from the semicircle. Based on the original data, the Zview fitting results showed that the impedances of Mn3O4NH, Mn3O4NA and Mn3O4AD were 462 Ω, 367 Ω and 240 Ω in the high-frequency region. The electrode linear slope of Mn3O4AD was the largest in the low-frequency region and the diffusion rate of lithium ions in the bulk phase was the largest. It could be seen that the Mn3O4AD material prepared with anhydrous ethanol dispersant and cetylmethyl ammonium bromide as the pH regulator reduced the resistance of lithium-ion migration at the interface, enhanced the reversibility of lithium-ion insertion and removal, and improved the electronic conductivity and ion diffusion rate.
The curve made according to EIS data W1/2 and Z′ is shown in Fig. 5(g). Using the formula DLi+ = 0.5(RT/nAF2Cσ)2, the diffusion coefficient of lithium ions could be calculated. The R is the gas constant, T is the absolute temperature, A is the electrode surface area, F is the Faraday constant, C is the Li+ concentration, n is the number of transferred charges, and σ is the Warburg factor related to Z′. From Fig. 5(g), Mn3O4AD had the largest diffusion rate among the three materials.
3.3 Physical and chemical properties of Mn2O3
The XRD diffraction patterns of Mn2O3 prepared with Mn3O4AD as the raw material, with a roasting time of 6 h at different temperatures, are shown in Fig. 6.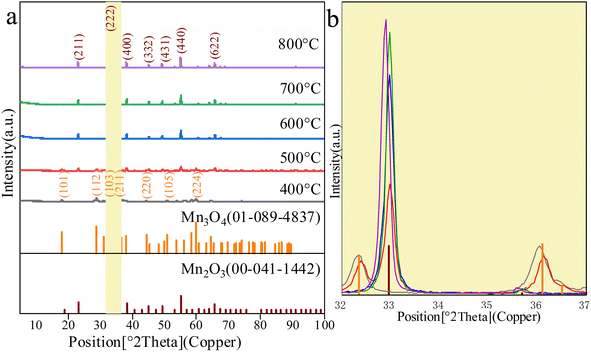 | ||
| Fig. 6 The XRD diffraction patterns of different Mn2O3. (a) XRD patterns of Mn2O3. (b) Partial enlarged view when 2θ = 32–37°. | ||
As shown in Fig. 6, when the roasting temperature exceeded 500 °C, the peaks at 2θ of 23.3°, 32.9°, 55.1° and 65.8° corresponded to the characteristic peaks and the (211), (222), (440) and (622) crystal planes of Mn2O3. When the roasting temperature was lower than 500 °C, the peaks at 2θ of 18.0°, 28.9°, 32.3°, 36.1°, 44.4° and 50.7° corresponded to the characteristic peaks of Mn3O4. This indicated that Mn2O3 was formed only when the temperature was higher than 500 °C. From Fig. 6(b), when the calcination temperature exceeded 500 °C, the XRD pattern of the prepared Mn2O3 material had an obvious broad peak corresponding to the characteristic peak of Mn2O3 at the angle of 32.9°. With the increase in the calcination temperature, the peak strength increased gradually, and the peak width narrowed slightly, indicating that the crystal phase content was high. Large grains and relatively light burrs indicated high crystallinity. However, it should be noted that when the temperature was 800 °C, the corresponding characteristic peak of Mn2O3 had a deviation. The angle deviation indicated that the phase was changing, which may be because Mn2O3 was dissolving.
The TG-DTG curves of Mn3O4AD for differential thermogravimetric analyses under an air atmosphere are shown in Fig. 7.
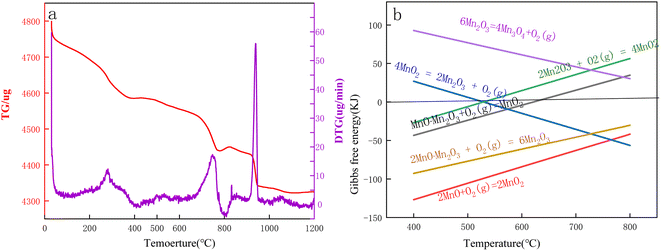 | ||
| Fig. 7 (a) TG-DTG curves of Mn3O4AD in an air atmosphere. (b). Gibbs free energy calculated by HSC software. | ||
Fig. 7(a) shows that the Mn3O4 powder lost weight at room temperature. The Rüetsch vacancy theory distinguished the protons from OH4x+y. The proton associated with the vacancy fraction x was called the Rüetsch proton, and the proton associated with the Mn3+ fraction y was called the Coleman proton. Rüetsch protons were the main part of the bound water. When the sample was heated to 150–400 °C, these protons diffused to the surface of the crystal and combined with the excess oxygen on the surface to form water, and then they lost manganese ions and jumped into empty lattice points. When Coleman protons were heated in the presence of oxygen, Mn2+ was oxidized to Mn4+ protons, which were lost by forming water with oxygen. The formula (1) can be expressed as follows:32–38
| (Mn1−x−y4+Mn3+O2−4x−y2−OH4x+y−+0.25yO2) → (1 − x)MnO2 + (2x + 0.5y)H2O | (1) |
| MnO·Mn2O3 + O2 = MnO2 (ΔG = 0.225 kJ, T = 622 °C) | (2) |
| 4MnO2 = 2Mn2O3 + O2 (g) (ΔG = −0.307 kJ, T = 529 °C) | (3) |
| 4MnO·Mn2O3 + O2 (g) = 6Mn2O3 (ΔG = 0.050 kJ, T = 1000 °C) | (4) |
Fig. 8 shows the SEM images of Mn2O3 prepared with Mn3O4AD as the raw material and the roasting time of 6 h at different temperatures.
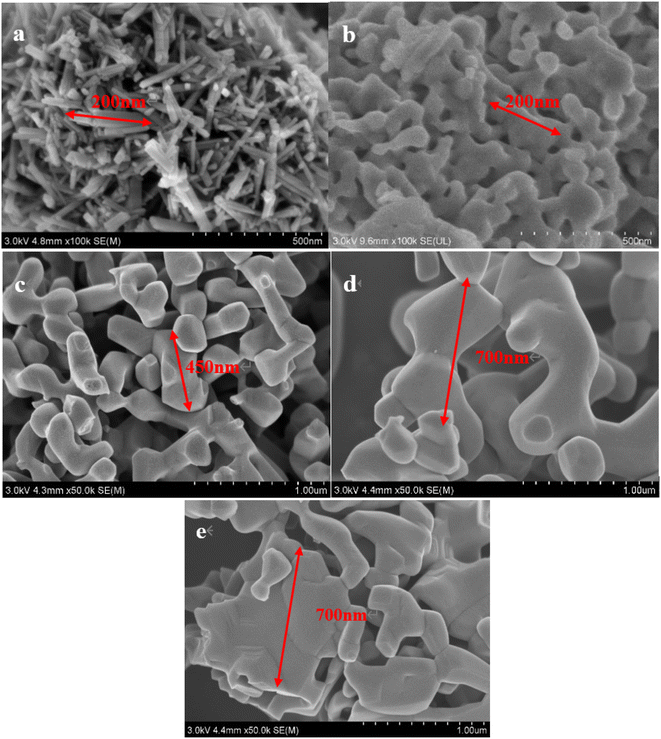 | ||
| Fig. 8 SEM images of Mn2O3 at different roasting temperatures: (a) 400 °C, (b) 500 °C, (c) 600 °C, (d) 700 °C, (e) 800 °C. | ||
Fig. 8(a) shows that the micro-morphology of Mn2O3 prepared by calcination at 400 °C was mainly rod-shaped and the agglomeration phenomenon was significant. When the roasting temperature was 500 °C, the bell-shaped manganese trioxide began to gather and form, which corresponded to the formation of some Mn2O3 at 500 °C in Fig. 8. With the increase in the temperature, the particles of the formed bar-type Mn2O3 gradually grew. However, when the temperature exceeded 800 °C, the formed Mn2O3 showed a large amount of agglomeration. The gaps between them were small, resulting in sieve stacking and affecting the electrochemical reaction.
3.4 Electrochemical properties of Mn2O3
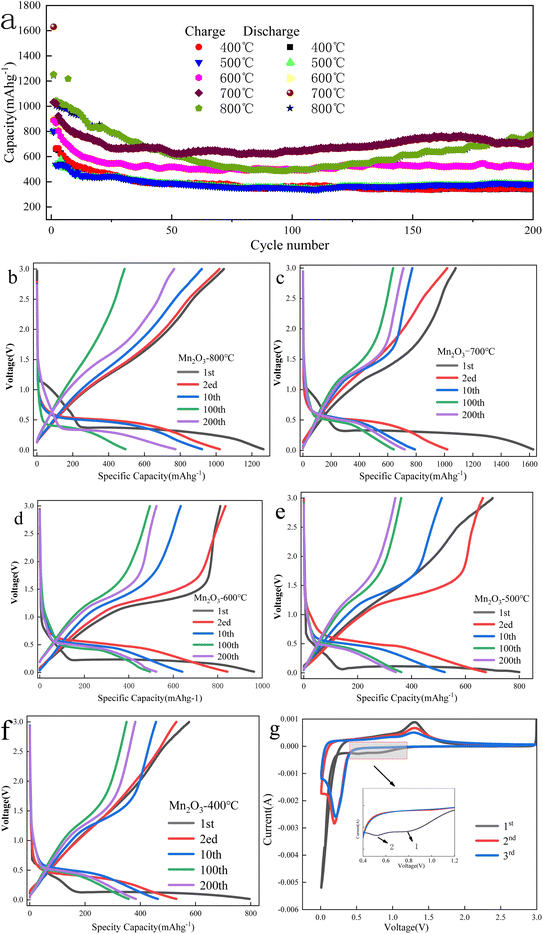
The electrochemical characterization of Mn2O3 prepared at different roasting temperatures is shown in Fig. 9.Fig. 9(a) shows that the specific capacity of Mn2O3 prepared at 700 °C had the best performance as a function of the number of cycles. The specific capacity of the first discharge was 1630.7 mA h g−1, and the specific capacity of the discharge was 712.1 mA h g−1 after 200 cycles. The specific capacity of the first charge was 1031.9 mA h g−1, and the coulomb efficiency was 63%. The loss of the specific capacity was due to an irreversible process, such as the formation of the SEI layer and the irreversible change between Mn3+ and Mn2+. The specific capacity of Mn2O3 prepared at 800 °C was lower than that of Mn2O3 prepared at 700 °C after 50 cycles. Because the particle agglomeration of Mn2O3 prepared at 800 °C was significant, the contact between the electrode material and collector fluid was insufficient, and even the volume expansion in the process of charging and discharging became larger, resulting in its falling off and affecting its electrochemical performance. When the calcination temperature of Mn3O4AD was lower than 700 °C, the electrochemical performance of Mn2O3 material decreased gradually with the decreasing temperature. There was little difference in the electrochemical properties of Mn2O3 prepared at 500 °C and Mn2O3 prepared at 400 °C, and the specific capacity retention rate was poor. Their specific discharge capacities were 341.9 mA h g−1 and 382.2 mA h g−1 after 200 cycles, which were much lower than that of Mn2O3 prepared at 700 °C. Therefore, the increase in calcination temperature made the grain spacing larger, promoted grain development, reduced the lithium-ion diffusion path, improved the lithium-ion transport rate of the material, and the electrochemical performance was improved.
From Fig. 9(b)–(f), with the reduction of calcination temperature, the first discharge voltage platform of the formed Mn2O3 material decreased gradually. When the calcination temperature was 800 °C, 700 °C, 600 °C, 500 °C and 400 °C, the first discharge voltage platform was 1.2 V, 1.1 V, 0.9 V, 0.7 V, and 0.6 V, respectively. This was because the irreversible change between Mn3+ and Mn2+ may have occurred when the voltage dropped to the first voltage platform during the first discharge. For example, for the Mn2O3 prepared at 700 °C, a new voltage platform appeared when the voltage dropped from 1.1 V to 0.4 V, which was attributed to the possible reduction of Mn3O4 to MnO and the irreversible reaction between lithium ion and acetylene black.
When the discharge reached the 0.01 V platform, the phase transformation reaction occurred and MnO was completely reduced to Mn and amorphous Li2O was formed. The total specific capacity of discharge was 1450 mA h g−1, which may be related to the irreversible decomposition of solvent in the electrolyte to form a gel-like film and the formation of a solid electrolyte interface on the surface.
Fig. 9(g) shows the electrode CV curve of Mn2O3 prepared at 700 °C in a 0.01–3.0 V potential window when the scanning rate was 0.1 mV s−1. As shown in the figure, three reduction peaks were found in the cathode process of the first cycle. The first reduction peak appeared at 0.95 V because Mn3+ was reduced to Mn2+. The weak and small peaks at about 0.75 V could be attributed to the formation of a solid electrolyte interface (SEI) resulting from the irreversible decomposition of the solvent in the electrolyte. There was a strong peak at 0.13 V, attributed to the further reduction of Mn2+ to Mn0. Only one oxidation peak was observed at 1.3 V during the anodic process, which was related to the oxidation of Mn0 to Mn2+. In the subsequent cycle, only one pair of redox peaks caused by the conversion of Mn2+/Mn0 was observed. The difference from the first cycle was that the main reduction peak shifted from 0.33 V to 0.35 V. This phenomenon was not uncommon for transition metal oxides, which meant that some irreversible reactions occurred in the first cycle.
With Mn3O4AD as the raw material, Mn2O3 was prepared at different calcination temperatures and its magnification performance at different current densities was studied. The results are shown in Fig. 10.
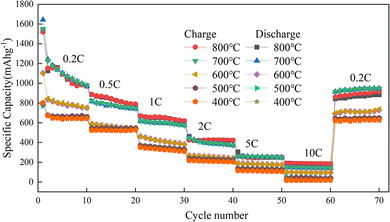 | ||
| Fig. 10 Charge–discharge ratio performance diagram of Mn2O3 prepared at different calcination temperatures. | ||
Fig. 10 shows that the magnification performance of Mn2O3 prepared at 700 °C was relatively good. When the current density changes were 0.2C, 0.5C, 1C, 2C, 5C, and 10C, the specific capacities were 1170 mA h g−1, 880 mA h g−1, 676 mA h g−1, 472 mA h g−1, 260 mA h g−1 and 187 mA h g−1, respectively. The capacity increased to 1080 mA h g−1 when the current density recovered to 0.2C. Therefore, Mn2O3 prepared at 700 °C had good structural stability when charged and discharged at different current densities. The order of average capacity from high to low was as follows: Mn2O3 prepared at 700 °C > Mn2O3 prepared at 800 °C > Mn2O3 prepared at 600 °C > Mn2O3 prepared at 500 °C > Mn2O3 prepared at 400 °C. With the increase in current density, the capacity of micro-sized Mn2O3 decreased sharply because the polarization of the electrode became more serious under higher current density. Compared with Mn2O3 prepared at 800 °C, Mn2O3 prepared at 700 °C contained a lot of voids. This was equivalent to reducing particle size and polarization so better electrochemical performance could be achieved.
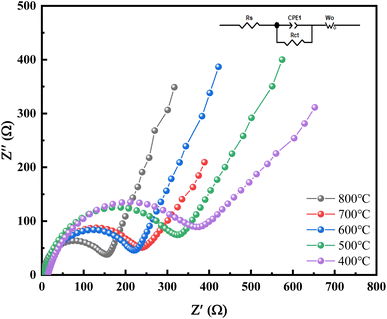
The equivalent circuit diagrams and alternating impedance spectroscopy (EIS) of Mn2O3 prepared at different temperatures with Mn3O4NA as the raw material are shown in Fig. 11. The frequency range of the test was 100–0.01 kHz, and the amplitude of the sinusoidal alternating wave was 5 mV.
The curve in Fig. 11 is composed of the oblique line in the low-frequency area and the semicircle in the high-frequency area. The oblique line in the low-frequency area corresponds to the solid lithium-ion diffusion process, and the semicircle in the high-frequency area corresponds to the charge transfer process reaction and SEI film formation. The charge transfer resistance (Rct) of the material could be obtained from the semicircle. Based on the original data, the Zview fitting results showed that the impedance of Mn2O3 was 230.7 Ω, 129.2 Ω, 267.3 Ω, 362.8 Ω and 382.0 Ω when calcination temperature was 800 °C, 700 °C, 600 °C, 500 °C and 400 °C. The electrode linear slope of Mn2O3 prepared at 700 °C was the largest in the low-frequency range, and the lithium-ion diffusion rate in its bulk phase was the largest. The Mn2O3 prepared at 700 °C had the following characteristics: it could reduce the resistance of lithium-ion migration at the interface, enhance the reversibility of lithium-ion insertion and removal in the material, and improve the electronic conductivity and ion diffusion rate.
4 Conclusion
Mn3O4 was prepared by a hydrothermal method with different pH regulators. The physicochemical and electrochemical properties of the product were analyzed. When it was used as the anode of the LIB, the rod-type Mn3O4 material prepared with the composite pH regulator showed good cycle performance and magnification performance, lower impedance and higher specific surface area. The electrode prepared with it still had a capacity of 382 mA h g−1 after 200 cycles at a current density of 0.5C. With Mn3O4AD prepared by the composite pH regulator as the raw material, the bell-shaped Mn2O3 was prepared by a hydrothermal method, which improved its electrochemical performance greatly. Mn2O3 prepared at 700 °C still had a capacity of 712.1 mA h g−1 after 200 cycles at a current density of 0.5C because calcination could make its structure more stable, and a large specific surface area structure could effectively buffer the negative effects of volume changes and provide more active points, which was conducive to improving the electrochemical performance. The bell-shaped Mn2O3 material has the advantages of stable morphology, uniform particles, and low impurity content, and can be used as a manganese-based material with excellent electrochemical performance, which is of great significance for upgrading and optimizing lithium-ion battery materials.Conflicts of interest
There are no conflicts to declare.Acknowledgements
The funding supports for this study were obtained from Key projects supported by science and technology in Guizhou Province ([2022]key020), Projects supported by science and technology in Guizhou Province ([2023]243), Major special projects in Guizhou Province ([2022]003), Tongren Science and Technology Plan Project ([2021]13). The authors sincerely thanks the reviewers for their views and suggestions to further improve the quality of the manuscript.References
- Z. Cai, S. Wang, H. Zhu, X. Tang, Y. Ma, D. Y. W. Yu, S. Zhang, G. Song, W. Yang, Y. Xu and C. Wen, Improvement of stability and capacity of Co-free, Li-rich layered oxide Li1.2Ni0.2Mn0.6O2 cathode material through defect control, J. Colloid Interface Sci., 2023, 630, 281–289 CrossRef CAS PubMed.
- H. Xiao, Y. Li, R. Chen, T. Xie, P. Xu, H. Zhu, J. He, W. Zheng and S. Huang, Integrative design of laser-induced graphene array with lithiophilic MnOx nanoparticles enables superior lithium metal batteries, eScience, 2023, 100134 CrossRef.
- S. Ecer, S. Altundag, S. Altin and S. Avci, Na0.67Mn0.33Ni0.33Co0.33O2: Effect of synthesis technique on competing P3 and P2 phases br, Mater. Sci. Eng., B, 2023, 287, 116106 CrossRef CAS.
- H. Guo, Z. Wang, B. Xing, H. Zeng, R. Gao, G. Huang, J. Jia, Y. Cao and C. Zhang, Carbon nanosheets prepared with a vermiculite template for high-performance lithium-ion batteries via space-confined carbonization strategy, J. Alloys Compd., 2023, 933, 167721 CrossRef CAS.
- P. Chahal, S. L. Madaswamy, S. C. Lee, S. M. Wabaidur, V. Dhayalan, V. K. Ponnusamy and R. Dhanusuraman, Novel manganese oxide decorated polyaniline/graphitic carbon nitride nanohybrid material for efficient supercapacitor application, Fuel, 2022, 330, 125531 CrossRef CAS.
- N. Fernandez-Pampin, J. J. Gonzalez Plaza, A. Garcia-Gomez, E. Pena, C. Rumbo, R. Barros, S. Martel-Martin, S. Aparicio and J. A. Tamayo-Ramos, Toxicology assessment of manganese oxide nanomaterials with enhanced electrochemical properties using human in vitro models representing different exposure routes, Sci. Rep., 2022, 12, 20991 CrossRef CAS PubMed.
- J. Khajonrit, T. Sichumsaeng, O. Kalawa, S. Chaisit, A. Chinnakorn, P. Kidkhunthod and S. Maensiri, Hierarchical assembled Ag2CuMnO4 nanoflakes as a novel electrode material for energy storage applications, J. Alloys Compd., 2023, 934, 167738 CrossRef.
- F. Matsumoto, M. Yamada, M. Tsuta, S. Nakamura, N. Ando and N. Soma, Review of the structure and performance of through-holed anodes and cathodes prepared with a picosecond pulsed laser for lithium-ion batteries, Int. J. Extreme Manuf., 2023, 5, 012001 CrossRef.
- J. Ling, A. Gao, Y. Huang, F. Yi, Q. Li, G. Wang, Y. Liu and D. Shu, Self-templated and triethanolamine-induced hollow MnO2 nanoboxes with abundant active Mn3+and oxygen vacancies for high-performance Na-ion pseudocapacitors, Chem. Eng. J., 2023, 452, 139661 CrossRef CAS.
- Z. Bai, Y. Zhang, Y. Zhang, C. Guo, B. Tang and D. Sun, MOFs-derived porous Mn2O3 as high-performance anode material for Li-ion battery, J. Mater. Chem. A, 2015, 3, 5266–5269 RSC.
- J. Gao, M. A. Lowe and H. D. Abruña, Spongelike Nanosized Mn3O4 as a High-Capacity Anode Material for Rechargeable Lithium Batteries, Chem. Mater., 2011, 23, 3223–3227 CrossRef CAS.
- A. R. Mule, B. Ramulu and J. S. Yu, Tri-metallic core-shell structures by confining crystalline nanorod and amorphous nanosheet architectures for high-performance hybrid supercapacitors, Chem. Eng. J., 2023, 451, 139018 CrossRef.
- S. Saadi-motaallegh, M. Javanbakht, H. Omidvar and S. Habibzadeh, Pulsed electro-synthesized tunable crystallite sizes ZnMn2O4/Mn2O3 nanocomposite as high-performance cathode material for aqueous zinc-ion batteries, J. Alloys Compd., 2022, 914, 165249 CrossRef CAS.
- T. Shahanas, J. Yesuraj, G. Harichandran, B. Muthuraaman and K. Kim, Inverse spinel cobalt manganese oxide nanosphere materials as an electrode for high-performance asymmetric supercapacitor, J. Alloys Compd., 2023, 933, 167645 CrossRef CAS.
- S. Bhowmick, A. Sarangi, C. T. Moi, S. Chakraborty and M. Qureshi, Diffusion-Mediated Morphological Transformation in Bifunctional Mn2O3/CuO-(VO)3(PO4)2middot6H2O for Enhanced Electrochemical Water Splitting, ACS Appl. Mater. Interfaces, 2022, 14, 52204–52215 CrossRef CAS PubMed.
- C. Guo, Y. N. Meng, D. Yu, L. Liu, X. Zhao and X. Liu, Synthesis of the sandwich-type MnMoO4@NiMoO4@Mn2O3 core-shell nanostructured materials and their application in the high-performance battery-supercapacitor hybrid devices, J. Alloys Compd., 2023, 932, 167686 CrossRef CAS.
- J. Wei, J. Wang, X. Wang, W. Jiang, N. Hu, L. Wang, M. Li, R. Xu and L. Yang, Modifying acidic oxygen production properties of PbO2 by porous Mn2O3 microspheres for boosting stability, Electrochim. Acta, 2022, 432, 141221 CrossRef CAS.
- Y. Liu, S. Guo, W. Ling, M. Cui, H. Lei, J. Wang, W. Li, Q. Liu, L. Cheng and Y. Huang, In-situ oriented oxygen-defect-rich Mn-N-O via nitridation and electrochemical oxidation based on industrial-scale Mn2O3 to achieve high-performance aqueous zinc ion battery, J. Energy Chem., 2023, 76, 11–18 CrossRef CAS.
- Z. Yang, J. Zhu, W. Tang and Y. Ding, An Fe2O3/Mn2O3 Nanocomposite Derived from a Metal-Organic Framework as an Anode Material for Lithium-ion Batteries, Chemistryselect, 2022, 7, 42 Search PubMed.
- X. Zhang, W. Du, Z. Lin, X. Tan, Y. Li, G. Ou, X. Xu, X. Lin, Y. Wu, A. Zeb and Z. Xu, Templated formation of Mn2O3 derived from metal-organic frameworks with different organic ligands as anode materials for enhanced lithium- ion storage, J. Alloys Compd., 2022, 927, 166977 CrossRef CAS.
- Y. Qiu, G.-L. Xu, K. Yan, H. Sun, J. Xiao, S. Yang, S.-G. Sun, L. Jin and H. Deng, Morphology-conserved transformation: synthesis of hierarchical mesoporous nanostructures of Mn2O3 and the nanostructural effects on Li-ion insertion/deinsertion properties, J. Mater. Chem., 2011, 21, 6346–6353 RSC.
- Q. Li, L. Yin, Z. Li, X. Wang, Y. Qi and J. Ma, Copper Doped Hollow Structured Manganese Oxide Mesocrystals with Controlled Phase Structure and Morphology as Anode Materials for Lithium Ion Battery with Improved Electrochemical Performance, ACS Appl. Mater. Interfaces, 2013, 5, 10975–10984 CrossRef CAS PubMed.
- R. D. Apostolova, A. V. Markevich and I. V. Kirsanova, Electrochemical Properties of Electrodes Based on Mn3O4, Mn2O3 in Non-Aqueous Electrolytes with Magnesium or Lithium Perchlorate, 19th International Conference on Advanced Batteries, Accumulators and Fuel Cells (ABAF), Brno, Czech Republic, 2018, pp. 133–144 Search PubMed.
- L. He, C. Xu, P. Ma and Q. Wang, Synthesis and Characterization of Mn2O3 nanorods as Anode Materials for Lithium Ion Batteries, Int. J. Electrochem. Sci., 2020, 15, 5908–5915 CrossRef CAS.
- S. Li, B. Li, Y. Zhong, Z. Pan, M. Xu, Y. Qiu, Q. Huang and W. Li, Mn2O3@C yolk-shell nanocubes as lithium-storage anode with suppressed surface electrolyte decomposition, Mater. Chem. Phys., 2019, 222, 256–262 CrossRef CAS.
- Q. Sun, T. L. Leung, K. C. Sing, A. B. Djurisic, M. H. Xie, A. M. C. Ng, H. Li and K. Shin, Cycling Performance of Mn2O3 Porous Nanocubes and Hollow Spheres for Lithium-ion Batteries, 8th Conference on Oxide-Based Materials and Devices VIII, San Francisco, CA, 2017 Search PubMed.
- F. Wang, T. Li, Y. Fang, Z. Wang and J. Zhu, Heterogeneous structured Mn2O3/Fe2O3 composite as anode material for high performance lithium ion batteries, J. Alloys Compd., 2021, 857, 157531 CrossRef CAS.
- J. Yoon, W. Choi, H. Kim, Y. S. Choi, J. M. Kim and W.-S. Yoon, The effects of nanostructures on lithium storage behavior in Mn2O3 anodes for next-generation lithium-ion batteries, J. Power Sources, 2021, 493, 229682 CrossRef CAS.
- Y. Zhang, Y. Yan, X. Wang, G. Li, D. Deng, L. Jiang, C. Shu and C. Wang, Facile Synthesis of Porous Mn2O3 Nanoplates and Their Electrochemical Behavior as Anode Materials for Lithium Ion Batteries, Chem. - Eur. J., 2014, 20, 6126–6130 CrossRef CAS PubMed.
- Y.-C. Zhang, J.-T. Li, Z.-G. Wu, L. Huang and S.-G. Sun, Synthesis of hierarchical spindle-like Mn2O3 for lithium ion batteries with enhanced lithium storage properties, J. Alloys Compd., 2017, 721, 229–235 CrossRef CAS.
- H. Zheng, Q. Liu, T. Wang, J. Chen, R. Zhao and L. Li, Hexagonal Mn2O3 nanoplates as anode materials for lithium ion batteries, International Forum on Energy, Environment and Sustainable Development (IFEESD), Shenzhen, P. R. China, 2016, pp. 418–421 Search PubMed.
- Q. Hao, B. Liu, J. Ye and C. Xu, Well encapsulated Mn3O4 octahedra in graphene nanosheets with much enhanced Li-storage performances, J. Colloid Interface Sci., 2017, 504, 603–610 CrossRef CAS PubMed.
- X. Xia, The relationship between the physical and chemical properties of manganese dioxide and its electrochemical activity (1), Battery, 2005, 433–436 CAS.
- X. Xia, Crystal structure, preparation and discharge performance of manganese dioxide and related manganese oxides (5), Batteries, 2005, 362–363 Search PubMed.
- X. Xia, Crystal structure, preparation and discharge performance of manganese dioxide and related manganese oxides (4), Batteries, 2005, 199–203 CAS.
- X. Xia, Crystal structure, preparation and discharge performance of manganese dioxide and related manganese oxides (3), Batteries, 2005, 105–108 CAS.
- X. Xia, The relationship between the physical and chemical properties of manganese dioxide and its electrochemical activity (3), Battery, 2006, 118–121 CAS.
- X. Xia, The relationship between the physical and chemical properties of manganese dioxide and its electrochemical activity (2), Battery, 2006, 37–40 CAS.
Footnote |
| † Contributed equally to this work. |
| This journal is © The Royal Society of Chemistry 2023 |


