 Open Access Article
Rapid and sensitive detection of alkaline phosphatase and glucose oxidase activity through fluorescence and colorimetric dual-mode analysis based on CuO NPs@ZIF-8 mediated enzyme-cascade reactions†
Guo-Ying
Chen
a,
Mao-Ling
Luo
a,
Li
Chen
b,
Tong-Qing
Chai
a,
Jia-Li
Wang
a,
Ling-Xiao
Chen
a and
Feng-Qing
Yang
 *a
*a
aSchool of Chemistry and Chemical Engineering, Chongqing University, Chongqing 401331, China. E-mail: fengqingyang@cqu.edu.cn; Tel: +8613617650637
bCollege of Optoelectronic Engineering, Key Laboratory of Optoelectronic Technology and Systems, Ministry of Education, Key Disciplines Lab of Novel Micro-Nano Devices and System Technology, Chongqing University, Chongqing 400044, China
First published on 16th August 2023
Abstract
The combined application of nanozymes and natural enzymes has received widespread attention in recent years. In this work, a simple and efficient method was used to synthesize a composite material of CuO nanoparticle-modified zeolitic imidazolate framework-8 (CuO NPs@ZIF-8) with multiple enzyme activities (glucose oxidase-like and hydrolase-like activities) to detect the activity of natural enzymes through fluorescence and colorimetric (UV-vis) dual-mode detection. The hydrolase- and oxidase-like activities of CuO NPs@ZIF-8 show an acceptable affinity with L-ascorbic acid 2-phosphate trisodium (AAP) and o-phenylenediamine (OPD). Using the developed sensor, highly sensitive detection of natural enzymes glucose oxidase (GOX) and alkaline phosphatase (ALP) was achieved through both fluorescent and colorimetric analyses with a wide linear range (fluorescence for GOX: 0.86–1.23 × 10⁵ mU mL−1, UV-vis for GOX: 0.081–1.62 × 10⁵ mU mL−1; fluorescence for ALP: 0.042–1.20 × 10⁴ mU mL−1, UV-vis for ALP: 0.0046–1.23 × 10⁴ mU mL−1) and low LOQs (fluorescence for GOX: 0.86 mU mL−1, UV-vis for GOX: 0.081 mU mL−1; fluorescence for ALP: 0.042 mU mL−1, UV-vis for ALP: 0.0046 mU mL−1). Compared to the other fluorescent and colorimetric sensors, this sensor has better catalytic activity due to the addition of GOX and ALP, which can amplify the detection signal and improve the sensitivity. This is the first time that composite material CuO NPs@ZIF-8 with “tandem enzyme” activity was synthesized and applied in the detection of enzyme activity. Additionally, the proposed fluorescent and UV-vis platforms exhibit the capability to detect GOX and ALP in serum samples with satisfactory recovery, indicating potential application prospects in biochemical analysis.
Introduction
Enzymes are high-performance biocatalysts with high specificity for substrates, participating in various reactions in organisms, and closely related to several biological activities such as body balance, growth and development, and individual reproduction.1 Enzymatic catalysis has the characteristics of high efficiency, specificity, adjustability, and simplicity.2 Enzyme-mediated cascade reactions play an important role in the field of biosensing, usually between different natural enzymes, as well as natural and simulated enzymes (usually nanozymes). In cascade catalysis, the natural enzyme specifically interacts with the substrate to generate a product that serves as a substrate of nanozymes.3 The integration effectively exploits the selectivity of natural enzymes and the stability of nanozymes.4 However, the practical applications of natural enzymes are limited by their vulnerable nature, which includes low resistance of acid and bases, low thermal stability, and lack of recyclability.5 To overcome these obstacles, a concept of “tandem nanozyme” was presented, which is defined as nanomaterial possessing multiple enzyme-like activities.6In particular, tandem enzyme refers to a unique kind of multifunctional nanozymes with more than one enzyme-like characteristics, which can catalyze cascade reactions.7 There are two strategies usually used in the design of tandem enzymes. One is to directly prepare a simple nanozyme for catalytic cascade reactions.8 The other one is the preparation of a nanocomposite material with different components, which can be used to catalyze individual reactions in cascade reactions,9 respectively. Accurately developing tandem nanozymes through the first method is relatively difficult, but it will be more feasible through the second strategy as it aims to design each component to undergo its own reaction in a cascade reaction, and then combine them into a unique nanocomposite material. For example, Gao et al.10 integrated ultra-small and highly dispersed gold nanoparticles (Au NPs) and Fe3O4 NPs successively into the large pore channels of dendritic mesoporous silica NPs (DMSN NPs) to construct a biomimetic dual inorganic composite nanomaterial (DMSN-Au-Fe3O4). Au NPs in the composite material have the mimic performance of glucose oxidase (GOX) that can convert glucose into hydrogen peroxide (H2O2). In the presence of H2O2, DMSN-Fe3O4 NPs can catalyze the oxidation of TMB to form the oxidized and blue-colored TMB, featuring characteristic absorbances at 370 and 652 nm. In addition, Fenton nanocatalysts produce high-toxic hydroxyl radicals, which can substantially induce tumor-cell death afterward. Zhao et al.11 designed ultra-small Ag2−xCuxS NPs with tandem enzyme-like activity and photothermal performance for the detection of glucose. The as-prepared Ag2−xCuxS NPs simultaneously exhibit both peroxidase-like and GOX-like activities within a similar pH range, and the tandem enzyme-like activity of Ag2−xCuxS NPs can be optimized by changing the doped content of Cu.
Inspired by these ideas, a sensor combining nanozymes with natural enzymes was developed in this study for fluorescence and UV-vis dual channel detection of the activity of GOX and alkaline phosphatase (ALP). The simultaneous fluorescence and UV spectroscopy analysis can realize mutual correction to get more reliable results for the same target analyte.12 The CuO nanoparticles (CuO NPs) have peroxidase and oxidase enzyme-like activities,13 and ZIF-8 has carbonic anhydrase, acetylcholinesterase, and ALP enzyme-like activities.14 The composite material of CuO NPs modified zeolitic imidazolate framework-8 (CuO NPs@ZIF-8), having hydrolase and oxidase enzyme-like activities, was synthesized through a hydrothermal method (Fig. 1A, process 2). It can react with L-ascorbic acid 2-phosphate trisodium (AAP) and o-phenylenediamine (OPD) to the product a (Fig. 1A, process 1, 3, and 4), OPD dimer, trimer, and tetramer (Fig. 1A, process 5), respectively, which further mutual reactions to generate final products of (b), (c), (d), and (e) (Fig. 1B), showing an obvious fluorescence intensity at 580 nm and a UV-vis absorbance at 416 nm. The additions of different concentrations of the two enzymes (GOX and ALP) will lead to different main reactions in the solution, resulting in different signals. Accordingly, a sensor with fluorescence and colorimetric dual-mode analysis was established for detecting the activity of ALP and GOX. The interesting points of this study are that the nanomaterial of CuO NPs@ZIF-8 exhibits both ALP and GOX enzyme-like activities, and the addition of natural enzymes (ALP and GOX) can promote the reaction and amplify the detection signal, thereby improving the detection sensitivity.
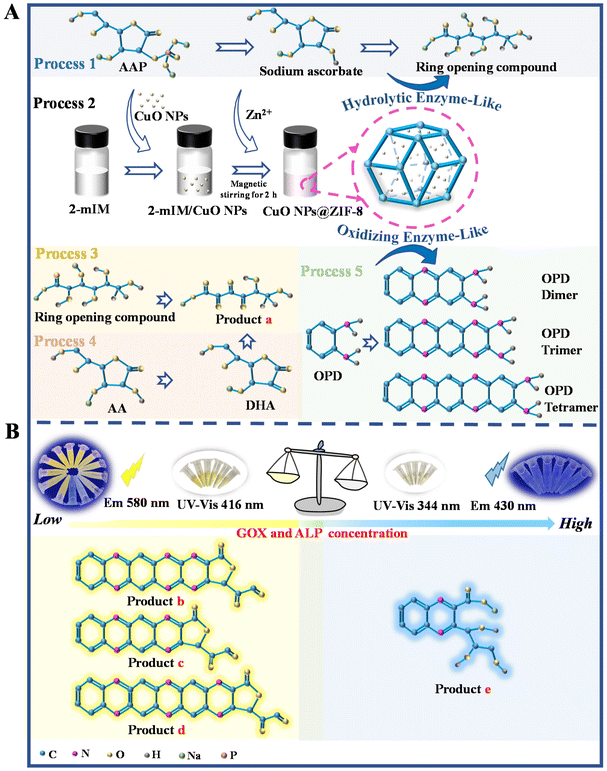 | ||
| Fig. 1 Schematic illustration of the synthesis of CuO NPs@ZIF-8 and main catalytic reaction processes (A), and the detection of GOX and ALP (B). | ||
Experimental
Materials and chemicals
MgSO4·7H2O, KCl, NaOH, MnSO4·H2O, Al (NO3)3, ascorbic acid (AA), isopropyl alcohol (IPA), sodium edetate (EDTA-2Na), and NaCl were purchased from Chengdu Chron Chemicals Co., Ltd. (Chengdu, China). p-Benzoquinone was purchased from Shanghai Merrill Chemical Technology Co., Ltd. (Shanghai, China). L-Histidine (His), L (+)-arginine (Arg), and L-lysine (Lys) were obtained from Chengdu Huaxia Chemical Reagent Co., Ltd. (Chengdu, China). CaCl2 and FeCl3·6H2O were purchased from Tianjin Damao Chemical Reagent Factory (Tianjin, China). CH3COOH was purchased from Chongqing Chuandong Chemical Group Co., Ltd. (Chongqing, China). OPD (99%) and inositol (99%+) were purchased from Adamas-beta Co., Ltd. (Shanghai, China). C4H6O4Zn·2H2O, NiCl3·6H2O, and GOX (263 U mg−1) were purchased from Macklin Biochemical Technology Co., Ltd. (Shanghai, China). The rabbit plasma (a biological product with sodium citrate as anticoagulant), 2-methylimidazole (2-mIM), vitamin B1 (VB1), ALP (60 U μL−1), nicotinamide, sarcosine (Sar), pyridoxamine, vitamin B4 (VB4), and vitamin B5 (VB5) were purchased from Shanghai YuanYe Biological Technology Co., Ltd. (Shanghai, China). AAP, L-glutamic acid (Glu), L-asparagine (Asn), and Co(NO3)2 were purchased from Shanghai Aladdin Bio-chemical Technology Co., Ltd. (Shanghai, China). NaH2PO4 was purchased from Shanghai Titanchem Co. Ltd. (Shanghai, China). Copper(II) acetate was purchased from Tianjin Ruijinte Chemicals Co., Ltd. (Tianjin, China). LiOH·H2O was purchased from Chongqing Boyi Chemical Reagents Co., Ltd. (Chongqing, China). The normal human serum (a biological product) used in this study was purchased from Beijing Solarbio Science & Technology Co., Ltd. (Beijing, China). All the samples were deposited at the Pharmaceutical Engineering Laboratory in the School of Chemistry and Chemical Engineering, Chongqing University, Chongqing, China.Instrumentation
Fluorescence analysis was carried out using an F-7100 fluorescence spectrophotometer (Hitachi, Tokyo, Japan). UV-vis analysis was carried out on a UV-5500 PC spectrophotometer (Shanghai Metash Instruments Co., Ltd., Shanghai, China). The tabletop low-speed centrifuge L420 was obtained from Hunan Xiang Yi Laboratory Instrument Development Co., Ltd. (Hunan, China). A tabletop high-speed centrifuge TGL-20M was purchased from Changsha Weierkang Xiangying Centrifuge Co., Ltd. (Changsha, China). A drying oven (DHG-9146A, Longyue Instrument Equipment, Shanghai, China) was used in the temperature-controlling process. The field-emission scanning electron microscopy (SEM) (JSM-7600F, JEOL Ltd., Tokyo, Japan) was used to characterize the synthesized materials. The Fourier-transform infrared (FT-IR) spectra were recorded using a Nicolet iS50 (Thermo Scientific Inc., USA). The sample's X-ray diffraction (XRD) patterns were acquired through an X’ pert Powder diffractometer (Malvern Panalytical Ltd., the Netherlands) with secondary beam graphite monochromated Cu Kα radiation. The images and element composition of materials were obtained through transmission electron microscopy (TEM) (Thermo Fisher Scientific, Czechia). The ultrapure water used throughout this study was purified by a water purification system (ATSelem 1820A, Antesheng Environmental Protection Equipment, Chongqing, China). An FE28 pH meter (Mettler-Toledo Instruments, Shanghai, China) was used for measuring the pH of solutions. The ultrasonic cleaner was purchased from Kunshan Jielimei Ultrasonic Instrument Co., Ltd. (Jiangsu, China).Preparation of CuO NPs
The CuO NPs were prepared according to the reported method.13 Firstly, 150 mL of copper(II) acetate solution (0.20 M) and 0.5 mL of CH3COOH were mixed into a glass vial, and followed by continuous ultrasonication to completely dissolve the solutes. Then, the above solution was heated to boiling on a water bath, and 10 mL of NaOH aqueous solution (0.04 g mL−1) was added rapidly, a large amount of black precipitate was formed immediately. The black precipitate was purified by centrifugation for 5 min at 3800 rpm (2259×g) and rinsed with absolute ethanol twice, followed by drying in an oven at 35 °C overnight.Preparation of CuO NPs@ZIF-8
A portion of 8 mg CuO NPs was added to 20 mL of 2-mIM (0.80 M) with continuous stirring to make it disperse evenly. Then, 2 mL of C4H6O4Zn·2H2O (0.40 M) was added into the above solution and allowed to magnetically stir for 2 h at room temperature (about 25 °C) to complete the synthesis of CuO NPs@ZIF-8. Finally, the suspension after the reaction was centrifugation for 10 min at 3800 rpm (2259×g), and the precipitate was rinsed with water once. Finally, the obtained CuO NPs@ZIF-8 was dispersed in 4 mL ultra-pure water and stored at a 4 °C refrigerator before use.Catalytic kinetics of CuO NPs@ZIF-8
Under the optimal conditions, the steady-state kinetic assays were conducted by changing AAP or OPD concentrations and recording their absorption spectra. The 50 μL of CuO NPs@ZIF-8, 200 μL of AAP with different concentrations (0.096–9.23 mM), and 200 μL of phosphate buffer (5.00 mM, pH 7) were added into a 1.5 mL centrifuge tube, respectively. After incubation at 55 °C for 3 min, 200 μL of OPD with different concentrations (0.19–6.15 mM) were added into the above solution and incubated for another 7 min. Then, the UV-vis absorption spectra at 330–600 nm were measured and the color changes of solutions (photos) under daylight were recorded. The kinetic parameters (Km and Vmax) can be determined by the Lineweaver–Burk double reciprocal plot: 1/v = Km/(Vmax [S]) + 1/Vmax, where v and Vmax are the initial and maximal reaction rate, respectively, [S] is the substrate concentration (AAP or OPD) and Km is the Michaelis–Menten constant.Catalytic mechanism investigation
To explore the role of reactive oxygen species (ROS) during the catalysis process, different radical scavengers, including IPA, AA, His, EDTA-2Na, and p-benzoquinone that can be respectively utilized to scavenge ˙OH, O2, 1O2, electron holes, and O2˙−, were added into the reaction mixture, respectively. The 50 μL of CuO NPs@ZIF-8, 200 μL of AAP (6.15 mM), and 200 μL of radical scavengers (0.15 mM) were added into a 1.5 mL centrifuge tube, respectively. After incubation at 55 °C for 3 min, 200 μL of OPD (4.62 mM) was added into the above solution and incubated for another 7 min. Then, the UV-vis absorption spectra at 330–600 nm were measured.Detection of GOX
For the fluorescent detection of GOX, 100 μL of CuO NPs@ZIF-8, 1 μL of ALP (3.33 U mL−1), 600 μL of AAP (4.00 mM), 100 μL of GOX with different concentrations (8.56 × 10⁻⁴–122.73 U mL−1), and 99 μL of phosphate buffer (5.00 mM, pH 7) were added into a 1.5 mL centrifuge tube, respectively. After incubation at 50 °C for 3 min, 600 μL of OPD (2.00 mM) was added into the above solution and incubated for another 10 min. Finally, the fluorescence intensity was measured at 430 and 580 nm with excitation of 350 nm and the fluorescence changes of solutions (photos) under the ultraviolet light (365 nm) were recorded. For the colorimetric detection of GOX, 50 μL of CuO NPs@ZIF-8, 1 μL of ALP (13.85 U mL−1), 200 μL of AAP (6.15 mM), 100 μL of GOX with different concentrations (8.09 × 10⁻⁵–161.85 U mL−1), and 99 μL of phosphate buffer (5.00 mM, pH 7) were added into a 1.5 mL centrifuge tube, respectively. After incubation at 55 °C for 3 min, 200 μL of OPD (4.62 mM) was added into the above solution and incubated for another 7 min. Then, the UV-vis absorption at 330–600 nm was measured and the color changes of solutions (photos) under daylight were recorded.Detection of ALP
For the fluorescent detection of ALP, 100 μL of CuO NPs@ZIF-8, 1 μL of ALP with different concentrations (4.17 × 10⁻⁵–12.00 U mL−1), 600 μL of AAP (4.00 mM), 100 μL of GOX (17.53 U mL−1), and 99 μL of phosphate buffer (5.00 mM, pH 7) were added into a 1.5 mL centrifuge tube, respectively. After incubation at 50 °C for 3 min, 600 μL of OPD (2.00 mM) was added into the above solution and incubated for another 10 min. Finally, the fluorescence intensity was measured at 430 and 580 nm with excitation of 350 nm and the fluorescence changes of solutions (photos) under the ultraviolet light (365 nm) were recorded. For the colorimetric detection of ALP, 50 μL of CuO NPs@ZIF-8, 1 μL of ALP with different concentrations (4.62 × 10⁻⁶–12.31 U mL−1), 200 μL of AAP (6.15 mM), 100 μL of GOX (40.46 U mL−1), and 99 μL of phosphate buffer (5.00 mM, pH 7) were added into a 1.5 mL centrifuge tube, respectively. After incubation at 55 °C for 3 min, 200 μL of OPD (4.62 mM) was added into the above solution and incubated for another 7 min. Then, the UV-vis absorption at 330–600 nm was measured and the color changes of solutions (photos) under daylight were recorded.Results and discussion
Characterization of synthesized materials
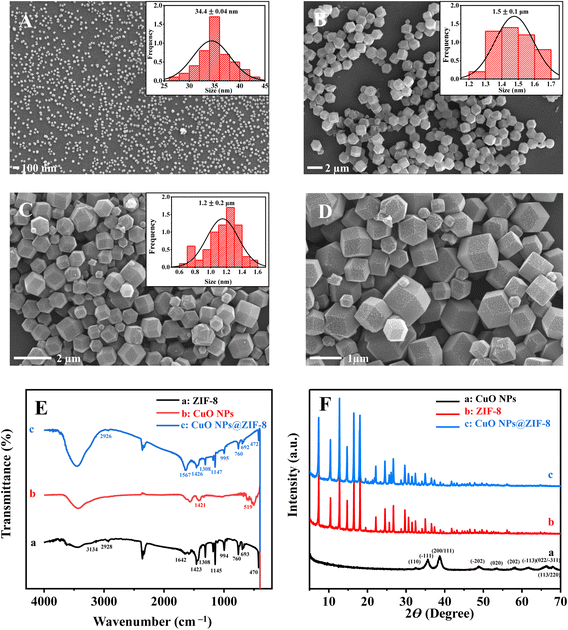
The morphology of the synthesized materials was characterized by SEM (Fig. 2). As exhibited in Fig. 2A, the morphology of CuO NPs is spherical-shaped with an average particle size of about 34.4 ± 0.04 nm. ZIF-8 presents a good rhombus dodecahedron shape with a smooth and flat surface, and its mean size is approximately 1.5 ± 0.1 μm (Fig. 2B). However, the size of CuO NPs@ZIF-8 becomes slightly smaller (Fig. 2C and D) than ZIF-8 with the mean size of 1.2 ± 0.2 μm, and its surface is uneven with obvious anchored particles. FT-IR results suggest that the absorption peaks of ZIF-8 at 3134 cm−1 and 2928 cm−1 are attributed to the N–H and C–H stretching vibrations, respectively. The peak at 1642 cm−1 is assigned to the C–N stretching vibration. The peaks at 1145 cm−1 and 1308 cm−1correspond to the bending signals of the imidazole ring, and the peak at 470 cm−1 is attributed to the Zn–N stretching vibration15 (Fig. 2E(a)). For CuO NPs, the peaks at 519 cm−1 and 1421 cm−1 are assigned to Cu–O and C–O stretching vibrations, respectively16 (Fig. 2E(b)). In addition, these absorption peaks can be observed in the FT-IR spectrum of CuO NPs@ZIF-8 (Fig. 2E(c)).
Fig. 2F shows the XRD patterns of CuO NPs, ZIF-8, and CuO NPs@ZIF-8. The typical diffraction peaks (2θ = 32.4, 35.6, 38.8, 48.7, 53.5, 58.4, 61.7, 66.2, 68.2, and 72.7°) of CuO NPs are consistent with JCPDS NO. 48-1548![[thin space (1/6-em)]](https://www.rsc.org/images/entities/char_2009.gif) 17 (Fig. 2F(a)). The characteristic peaks (2θ = 011°, 002°, 112°, 022°, and 222°) of the ZIF-8 sodalite topology are consistent with the previous report18 (Fig. 2F(b)). The diffraction peaks of the as-prepared CuO NPs@ZIF-8 are identical to those of ZIF-8 and CuO NPs, confirming its high crystallinity (Fig. 2F(c)).
17 (Fig. 2F(a)). The characteristic peaks (2θ = 011°, 002°, 112°, 022°, and 222°) of the ZIF-8 sodalite topology are consistent with the previous report18 (Fig. 2F(b)). The diffraction peaks of the as-prepared CuO NPs@ZIF-8 are identical to those of ZIF-8 and CuO NPs, confirming its high crystallinity (Fig. 2F(c)).
TEM results illustrate that ZIF-8 shows a uniform size. The EDS energy spectra show that it contains C, N, O, and Zn elements (Fig. 3A and D). The spherical CuO NPs consist of Cu and O (Fig. 3B and E). The morphology of CuO NPs@ZIF-8 likes ZIF-8 (Fig. 3C) and several important elements, including C, O, N, Cu, and Zn, are all distributed in the CuO NPs@ZIF-8 (Fig. 3F). All these results demonstrate that the high-dispersion CuO NPs@ZIF-8 is successfully prepared.
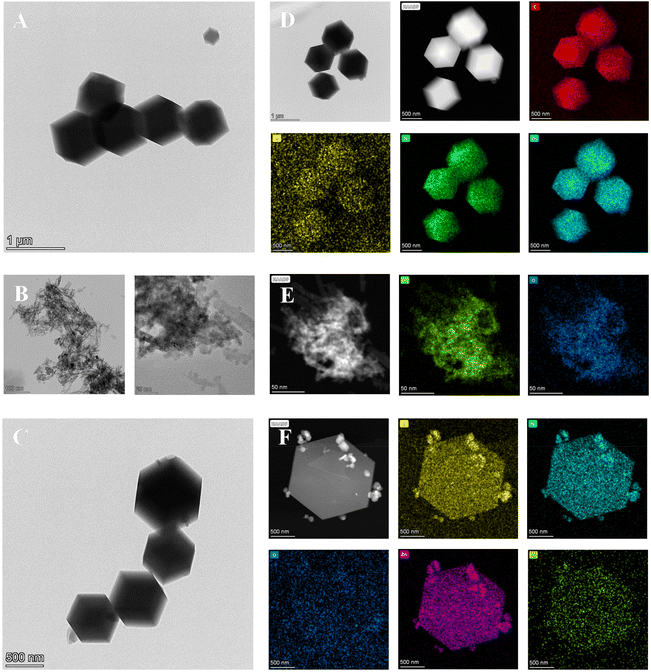 | ||
| Fig. 3 TEM images of ZIF-8 (A), CuO NPs (B) and CuO NPs@ZIF-8 (C). EDS mapping of ZIF-8 (D), CuO NPs (E) and CuO NPs@ZIF-8 (F). | ||
Sensing mechanism and the feasibility study
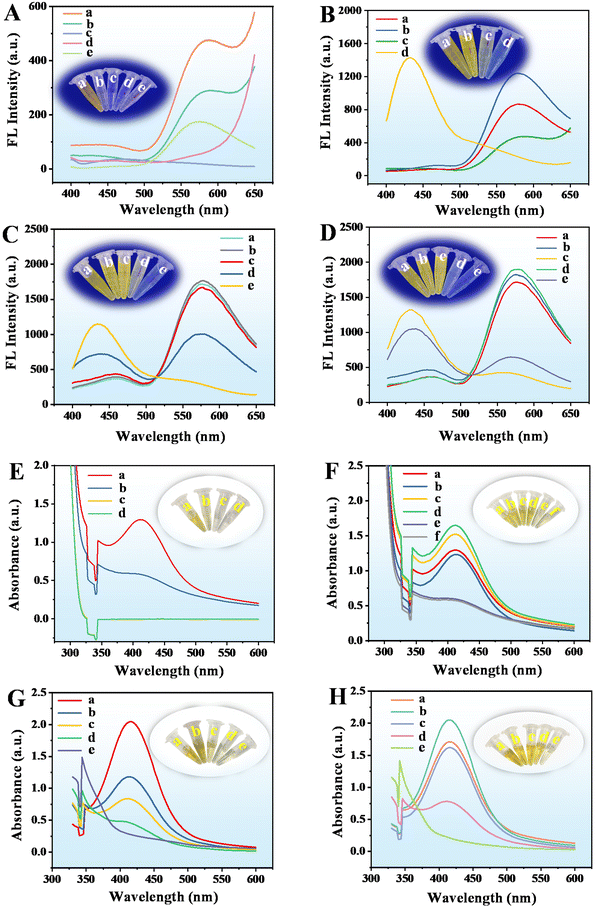
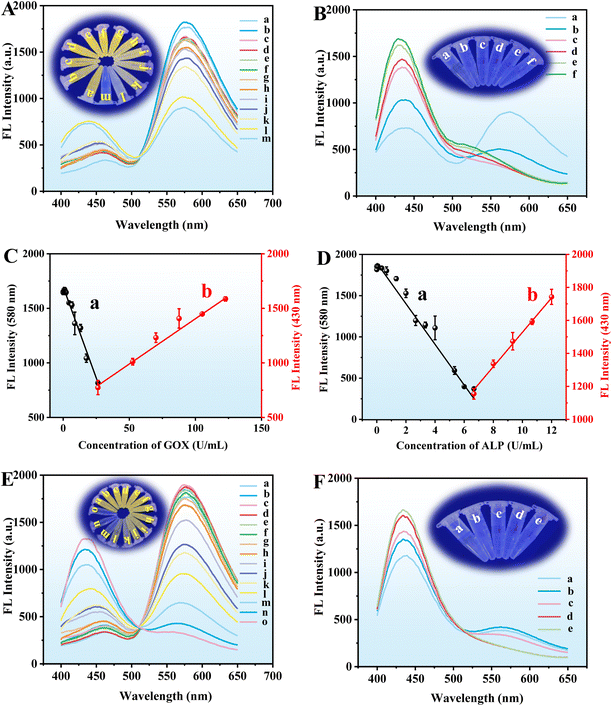
The sensing mechanism and feasibility for the detection of GOX and ALP were investigated. When the CuO NPs@ZIF-8, AAP, and OPD were mixed and reacted for a period, the reaction solution is bright yellow and its fluorescence intensity at 580 nm (Fig. 4A(a)) and UV-vis absorbance at 416 nm (Fig. 4E(a)) are obvious. CuO NPs@ZIF-8 has the enzyme-like activity of ZIF-8 and CuO NPs, which can hydrolyze AAP to produce sodium ascorbate and Na3PO4.14,19 In addition, the sodium ascorbate can be further hydrolyzed to form a ring-opening substance. At the same time, CuO NPs@ZIF-8 with oxidase activity can oxidize OPD and AA to produce oxidized OPD (CuO NPs@ZIF-8 + OPD/CuO NPs + AAP + OPD, Fig. 4A(b) and (e), E(b)) and dehydroascorbic acid (DHA), respectively. Moreover, AA or DHA may react with oxidized OPD to produce corresponding products.13 To identify the chemical reactions catalyzed by CuO NPs@ZIF-8, the reaction solutions of CuO NPs@ZIF-8 + AAP + OPD, CuO NPs@ZIF-8 + ALP + AAP + OPD, CuO NPs@ZIF-8 + AAP + GOX + OPD, and CuO NPs@ZIF-8 + ALP + AAP + GOX + OPD were analyzed by mass spectrometry (MS), the positive ion mode of ESI† was used to tentatively identify the products. From the results of the MS spectra (Fig. S1†), the structures of the main compounds were tentatively identified based on their [M + H]+ and shown in Fig. S2.† It was inferred that the structures of the products at m/z 213, 397, 345, 487, and 287 in the MS spectra are the products (a)–(e), respectively. And the m/z 109, 211, 185, 175, and 165 are OPD, oxOPD, AA, DHA, and Na3PO4, respectively. When a certain concentration of GOX (52.6 U mL−1) and ALP (20.00 U mL−1) was added to the system (CuO NPs@ZIF-8 + AAP + OPD), respectively, the fluorescence intensity at 580 nm (Fig. 4B(a) and (b)) and UV-vis absorbance at 416 nm (Fig. 4F(a) and (c)) are significantly increased. It is worth noting that when the high concentrations of GOX and ALP are added simultaneously in the reaction system, the fluorescence intensity at 580 nm decreases, but a new strong peak appears at 430 nm (Fig. 4B(d)), which is also confirmed from the MS results. As shown in Fig. S1D,† a new ion at m/z 287 is appeared in the MS signal, which is tentatively identified as product e (Fig. S2†). As shown in Fig. 4C and G, when the ALP concentrations are kept at 3.33, and 13.85 U mL−1, respectively, adding different concentrations of GOX (low, L, 3.25 × 10⁻⁵ and 3.08 × 10⁻⁶ U mL−1; medium, M, 17.53 and 4.05 U mL−1; high, H, 87.67 and 121.38 U mL−1), the fluorescence intensity at 580 nm and UV-vis absorbance at 416 nm of the reaction system are decreased, but the fluorescence intensity at 430 nm and UV-vis absorbance at 344 nm are increased, respectively.On the other hand, as shown by the results in Fig. 4D and H, when the GOX concentrations are kept at 17.53 and 40.46 U mL−1, adding different concentrations of ALP (low, L, 4.17 × 10⁻⁵ and 4.62 × 10⁻⁵ U mL−1; medium, M, 5.33 and 3.08 U mL−1; high, H, 12.00 and 12.31 U mL−1), the fluorescence intensity at 580 nm and UV-vis absorbance at 416 nm of the reaction system are decreased, but the fluorescence intensity at 430 nm (the fluorescence color changes from yellow to blue) and UV-vis absorbance at 344 nm (the solution color changes from yellow to colorless) are increased, respectively. The reasons for these phenomena may be as follows. Firstly, when CuO NPs@ZIF-8, AAP, and OPD are mixed together, there are four main reaction processes occurred in the solution. (A), CuO NPs in the composite material can oxidize OPD to the OPD dimer, trimer, and tetramer (Fig. S3A†);20 (B), ZIF-8 in the composite material can hydrolyze AAP to AA, and CuO NPs in the composite material can oxidize AA to DHA (Fig. S3B†); (C), the product a further react with the OPD dimer, trimer, and tetramer to generate the products (b), (c), and (d) (Fig. S3C†); (D), OPD can react with the product a to generate the product e (Fig. S3D†). The addition of ALP can promote the production of AA from AAP, and GOX can further oxidize hydroxyl groups to aldehyde groups.21 Therefore, adding GOX or ALP to the system, or simultaneously adding GOX and ALP within a certain concentration (GOX, 17.53 U mL−1; ALP, 3.33 U mL−1), the main reactions in the solution are (A), (B), and (C). When the concentration of GOX and ALP added simultaneously is higher than a specific concentration (GOX, 26.30 U mL−1; ALP, 6.67 U mL−1), the main reactions in the solution are (B) and (D). So, based on the different reactions, and the corresponding fluorescence intensity (580 and 430 nm) and UV-vis (416 and 344 nm) absorption changes, the developed method can achieve the quantitative detection of GOX and ALP. Moreover, the semi-quantitative detection of them can be realized by the corresponding changes in fluorescence and solution color. Interestingly, simulated enzymes (CuO NPs@ZIF-8) and natural enzymes (GOX and ALP) have similar catalytic effects. Adding both GOX and ALP simultaneously can greatly improve the sensitivity of their detection. As shown in Fig. 4B, when adding GOX (curve (a)) or ALP (curve (b)) to the reaction system (the reaction between CuO NPs@ZIF-8 + AAP + OPD), respectively, the fluorescence intensities at 580 nm are significantly enhanced compared to the basic reaction (the reaction between CuO NPs@ZIF-8 + AAP + OPD) (curve (c)). However, there are few reports using fluorescence and UV-vis dual-mode analysis to achieve enzyme activity detection based on this strategy.
Optimization of experimental parameters
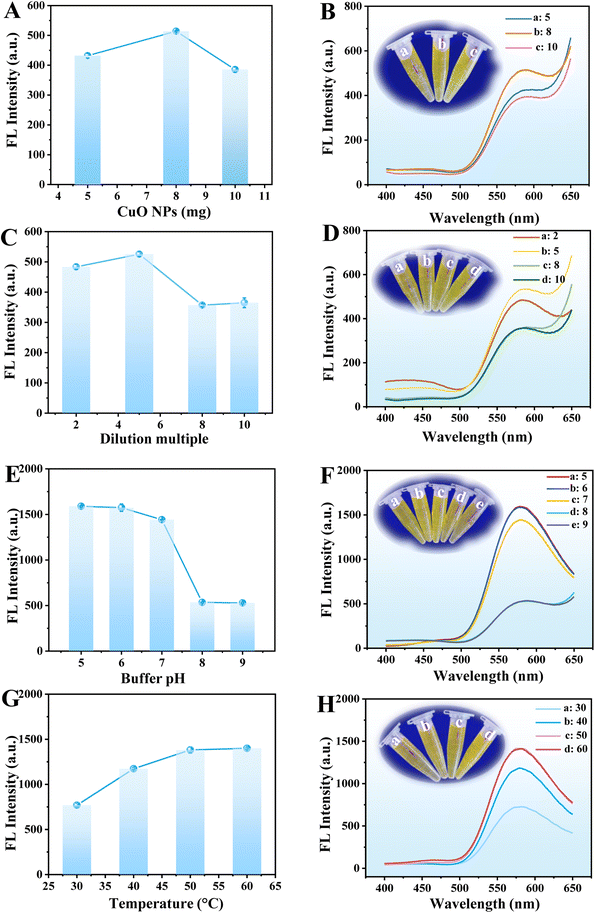
To obtain the best response towards GOX and ALP through fluorescence analysis, several experimental conditions, including the amount of CuO NPs, dilution multiple of CuO NPs@ZIF-8, buffer pH, incubation temperature, the AAP and OPD concentrations, and reaction time were optimized. Fig. 5A and B shows the fluorescence intensity at 580 nm and emission spectra of CuO NPs@ZIF-8 reaction system with the amount of CuO NPs ranging from 5 to 10 mg, respectively. The maximum fluorescence intensity at 580 nm is obtained at 8 mg of CuO NPs, which was chosen for further study. When the amount of CuO NPs is 5 mg, the morphology is not significantly different from when it is 8 mg (Fig. S4A†), although there is a difference in the enzyme catalytic activity. However, when the amount of CuO NPs is 10 mg, the structure of CuO NPs@ZIF-8 becomes slightly irregular (Fig. S4B†), which may affect the enzyme catalytic activity of ZIF-8. The dilution multiple of CuO NPs@ZIF-8 is another important factor that affects its catalytic activity. The maximum fluorescence intensity at 580 nm is obtained at a dilution multiple of 5 within the test range of 2–10 (Fig. 5C and D).The fluorescence emission spectra of the CuO NPs@ZIF-8/AAP/OPD system decrease with the increase in buffer pH from 5 to 9 (Fig. 5F). According to the previous report, the maximum catalytic activity of GOX can be obtained in a weak acid environment (4.5–7),22 but the maximum activity of ALP can be obtained in an alkaline environment (pH 8–10).23 The mild neutral condition (buffer pH at 7) is not only beneficial for the oxidation of OPD,24 but also can maximize the activity of both GOX and ALP. Thus, the buffer pH at 7 is chosen for further study (Fig. 5E). Temperature is another key factor that affects the nanozyme activity. The fluorescence intensity of the reaction system increases with the reaction temperature is increased from 30 °C to 60 °C and keeps steady at 50 °C, which was selected for the subsequent experiments (Fig. 5G and H).
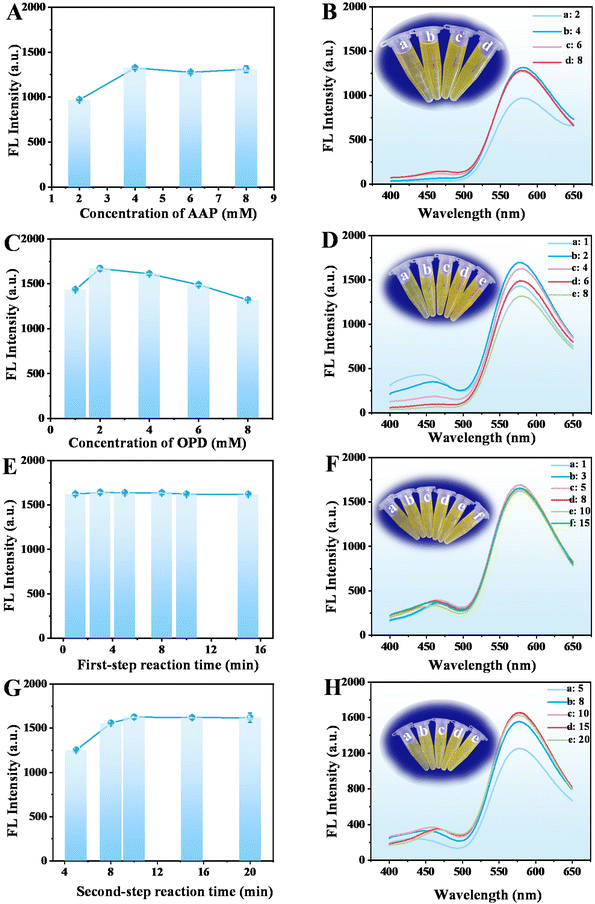
The fluorescence intensity at 580 nm of the reaction system increases with the AAP concentration increased from 2.00 mM to 4.00 mM, but keeps steady with the further increase in the concentration, which was selected for the following study (Fig. 6A and B). In addition, the fluorescence intensity changes with the increase in the concentration of OPD from 1.00 to 8.00 mM and is the highest at 2.00 mM. Thus, 2.00 mM of OPD was chosen for further experiments (Fig. 6C and D). The fluorescence intensity at 580 nm decreases when a high concentration of OPD was added, probably because too much OPD will affect the contact between AA, DHA, and the product a and the oxidized OPD (OPD dimer, trimer, and tetramer).
In addition, during the entire reaction process, the order of adding substrates is different, and there are different reaction times, including the first-step (the reaction between CuO NPs@ZIF-8 and AAP) and second-step reaction (the reaction between CuO NPs@ZIF-8, AAP, and OPD) time. The results showed that the first-step reaction time (CuO NPs@ZIF-8 + AAP) (1 to 15 min) has little impact on the reaction, thus, 3 min was selected for further study for time-saving and facilitate operation (Fig. 6E and F). However, the fluorescence intensity increases with the increasing second-step reaction time (CuO NPs@ZIF-8 + AAP + OPD) from 5 to 10 min and keeps stable after 10 min, which was used in the next experiments (Fig. 6G and H).
In summary, the optimum conditions for the detection of GOX and ALP through fluorescence analysis are: CuO NPs of 8 mg, dilution multiple of 5, buffer pH at 7, incubation temperature at 50 °C, AAP and OPD concentrations of 4.00 and 2.00 mM, respectively, and first- and second-step reaction time of 3 and 10 min, respectively.
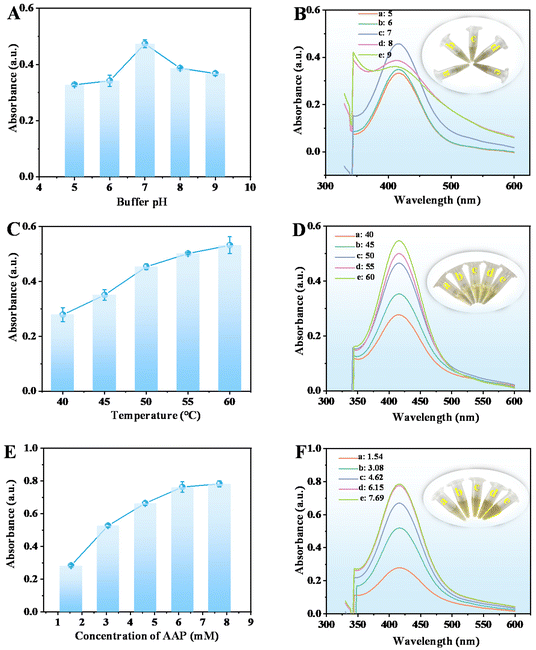
To obtain the best response towards GOX and ALP through UV-vis analysis, the effects of buffer pH, temperature, the concentrations of AAP and OPD, and reaction time were investigated. The maximum absorbance of the reaction solution at 416 nm is obtained at buffer pH 7 within the test range of pH 5–9 (Fig. 7A and B). Furthermore, the absorbance increases obviously with the increasing incubation temperature from 40 °C to 60 °C and keeps steady at 55 °C (Fig. 7C and D), which was selected for further study. The concentrations of substrates AAP and OPD were also investigated. The maximum absorbance of the reaction solution is obtained at the concentration of AAP of 6.15 mM (initial concentration is 20.00 mM) within the test range from 1.54 mM to 7.69 mM (initial concentration from 5.00 to 25.00 mM), which was selected for further experiments (Fig. 7E and F).
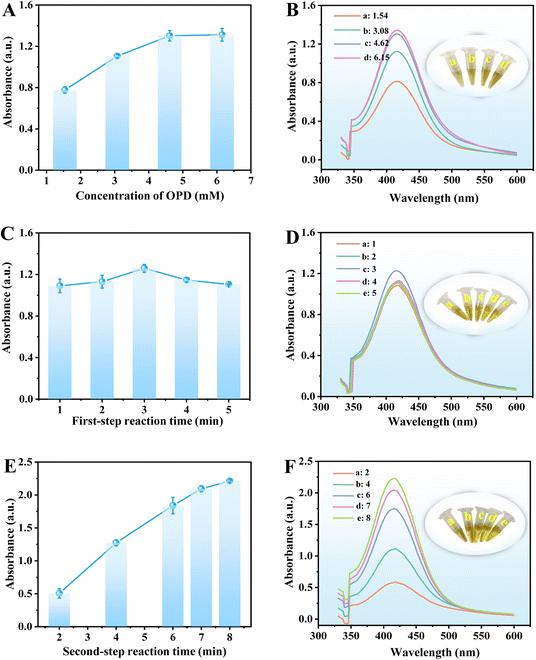
Similarly, the absorbance of the reaction solution increases with the increase in OPD concentration in the range of 1.52–6.15 mM (initial concentration from 5.00 to 20.00 mM). The maximum absorbance is obtained at 4.62 mM, which was chosen for the following studies (Fig. 8A and B). Finally, the first- and second-step reaction time was investigated in the range of 1–6 min and 2–8 min, respectively. The results show that the first-step reaction time (CuO NPs@ZIF-8 + AAP) has little effect on the reaction, and 3 min was selected for further study (Fig. 8C and D). However, the second-step reaction time (CuO NPs@ZIF-8 + AAP + OPD) has a significant effect on the absorbance of the reaction solution at 416 nm and keeps steady at 7 min, which was selected for subsequent studies (Fig. 8E and F).
In summary, the optimum conditions for the detection of GOX and ALP through UV-vis analysis are: buffer pH of 7, incubation temperature at 55 °C, AAP and OPD concentrations of 6.15 and 4.62 mM, respectively, and first- and second-step reaction time of 3 and 7 min, respectively.
Kinetic analysis
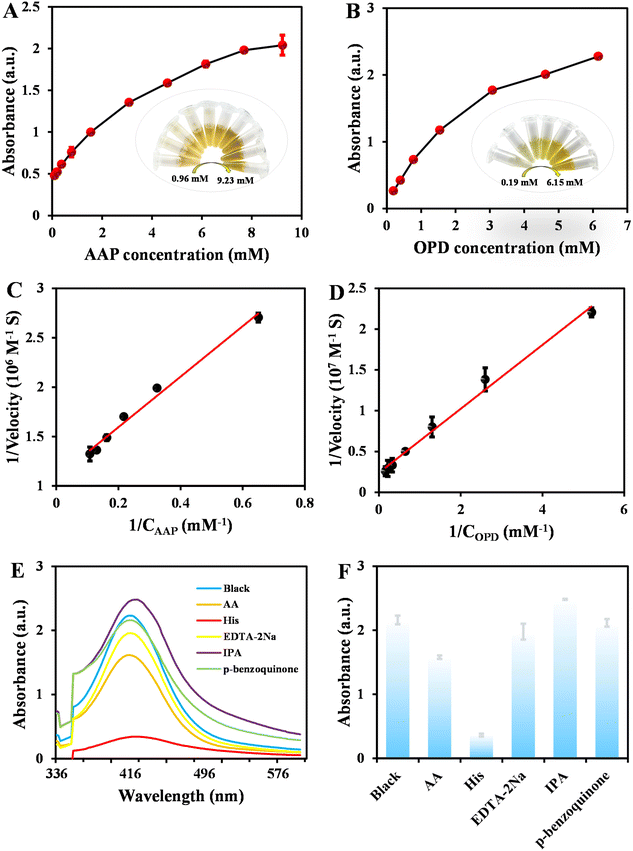
The hydrolase- and oxidase-like properties of CuO NPs@ZIF-8 were further investigated by a steady-state kinetics study. By fixing the concentrations of OPD with varying AAP concentrations or vice versa, the typical Michaelis–Menten curves were obtained (Fig. 9A and B). According to Lineweaver–Burk double reciprocal plots (Fig. 9C and D), the obtained linear regression equations are y = 2.5440x + 1.0838 (R2 = 0.9883) (AAP) and y = 0.3918x + 0.2396 (R2 = 0.9912) (OPD). The Km and Vmax values of CuO NPs@ZIF-8 with AAP are calculated to be 2.36 mM and 0.92 × 10⁻⁶ M s−1, respectively, which is similar to that of ZIF-8 (Km of 11.16 mM).19 In addition, the Km and Vmax values of CuO NPs@ZIF-8 with OPD are 1.63 mM and 4.17 × 10⁻⁷ M s−1, respectively. At present, TMB is one of the most widely used substrates in the study of oxidase-mimicking nanozymes. In reality, the Km and Vmax values obtained by this method with OPD are equivalent to that of selenium nanoparticles synthesized with bovine serum albumin (substrate: TMB, 0.86 mM and 0.53 × 10⁻⁸ M s−1).25Catalytic mechanism
Different quenching agents were introduced to scavenge the relevant reactive species in the reaction system, such as ˙OH, O2, 1O2, electron holes, and O2˙−.26 As demonstrated in Fig. 9E and F, there are negligible changes in the absorbance when IPA, p-benzoquinone, and EDTA-2Na are added, which indicate that ˙OH, O2˙−, and electron holes are not the main reactive species in the catalytic reaction. The absorbance exhibits a slight change when adding AA to the system, which shows that O2 may play a certain role in the catalytic reactions. However, the absorbance shows an obvious change when His is added, which proves that the 1O2 is the main active species of the catalytic reaction between OPD and CuO NPs@ZIF-8.Storage stability of CuO NPs@ZIF-8
A batch of CuO NPs@ZIF-8 was synthesized and stored in a 4 °C refrigerator for 30 days. The fluorescence intensity and UV-vis absorbance of the reaction solution (CuO NPs, AAP, and OPD) were measured at different times (0, 5, 10, 15, 20, 25, and 30 days) to determine the storage stability of the material. As shown in Fig. S5A and B,† there are no significant changes in fluorescence intensity and UV-vis absorbance within 30 days. The results show that the synthesized CuO NPs@ZIF-8 is stable, which can be used for the detection of GOX and ALP by fluorescence and UV-vis analysis.Detection of GOX
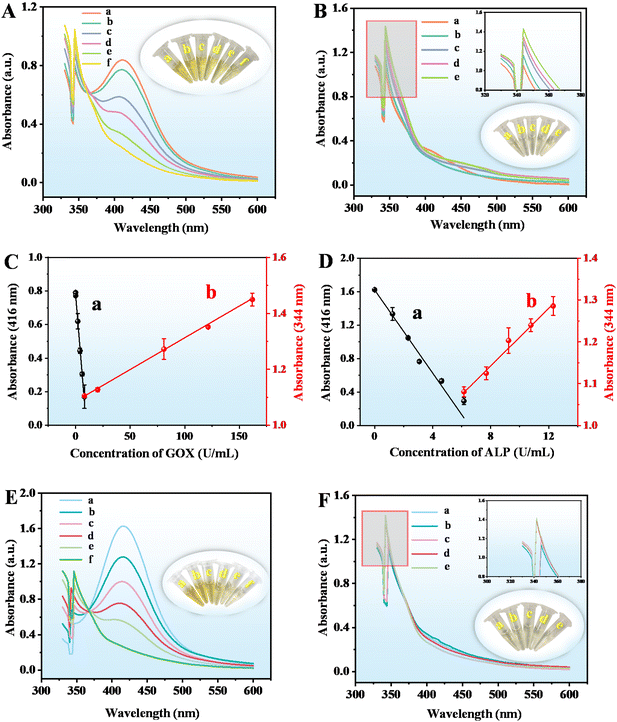
GOX can react with glucose and O2 within cells to generate H2O2 and gluconic acid, cutting off the nutritional source of cancer cells and inhibiting their proliferation,27 which plays an important role in the treatment of cancer.28 Therefore, establishing a fast, simple, and highly sensitive method for detecting GOX activity is of great significance. Under the optimized conditions, a fluorescence and UV-vis dual-mode analysis through adding ALP (concentrations are 3.33 and 13.85 U mL−1, respectively) to enhance its sensitivity was developed for the detection of GOX. As the GOX concentration increases, the emission intensities at 580 and 430 nm of the reaction solution decrease and increase, respectively. The fluorescence intensity at 580 nm decreases with the concentration of GOX increases within the range of 8.56 × 10⁻⁴–26.30 U mL−1 (Fig. 10A). The obtained linear equation is y = −33.4066x + 1696.8149 (R2 = 0.9994) with the LOQ of 0.86 mU mL−1 (Fig. 10C(a)). Furthermore, the fluorescence intensity at 430 nm increases with the increase in the high GOX concentration (26.30–122.73 U mL−1) (Fig. 10B), and the obtained linear equation is y = 8.2970x + 574.6665 (R2 = 0.9969) (Fig. 10C(b)). In addition, as shown in Fig. 10A and B (the insert picture), the color change of the solution fluorescence can be obviously observed by the naked eye within the range of yellow to blue.The UV-vis detection of GOX was established within the two concentration ranges of 8.09 × 10⁻⁵–8.09 (absorption at 416 nm) and 8.09–161.85 U mL−1 (absorption at 344 nm), their linear equations are y = −0.07882x + 0.7782 (R2 = 0.9993) (Fig. 11C(a)) and y = 0.0027x + 1.0860 (R2 = 0.9952) (Fig. 11C(b)), respectively, with the LOQ of 0.081 mU mL−1. The yellow color of the reaction solution gradually weakens to colorless (the insert picture of Fig. 11A and B). As compared with other methods for the detection of GOX, this method demonstrates excellent performance, comparable or even superior to some reports (Table 1), which allows the detection of GOX and ALP not only using fluorescence spectroscopy but also using UV-vis absorption spectroscopy, and has a wider linear range and lower LOQ. This obvious advantage is mainly due to the synergistic effect of simulated enzymes and natural enzymes. The addition of ALP amplifies the detection signal.
| Sample | Probe | Method | Linear range (mU mL−1) | LOD/LOQ (mU mL−1) | Ref. |
|---|---|---|---|---|---|
| a FCP, ratiometric fluorescent probe; PDA NPs, polydopamine nanoparticles; NH2–Cu-MOFs, amino-functionalized copper(II)-based metal–organic frameworks; Au NR@Ag, gold/silver core/shell nanorod; CuO NPs, copper oxide nanoparticles; ZIF-8, zeolitic imidazolate framework-8; CuNCs, copper nanoclusters; CSNCPs, core–shell nanocomposites; ALP, alkaline phosphatase; GOX, glucose oxidase. | |||||
| ALP | FCP | Fluorescent | 0–10 | 0.006/— | 31 |
| ALP | PDA NPs | Fluorescent | 0–10 | 0.4/— | 32 |
| ALP | NH2–Cu-MOFs | Fluorescent | 2–180 | 0.35/— | 33 |
| ALP | MIL-53 (Fe) | Fluorescent | 2–80 | 0.7/— | 34 |
| ALP | Cu@Eu-BTC | Fluorescent | 0.3–24 | 0.02 | 35 |
| ALP | MnO2 nanosheets | Colorimetric | 0.05–10 | 0.05 | 36 |
| ALP | Fe(II)-phenanthroline complex | Colorimetric | 0–220 | 0.94 | 30 |
| ALP | Cu(II)-phenanthroline complex | Colorimetric | 0–200 | 1.25 | 37 |
| ALP | Au NR@Ag | Colorimetric | 5–100 | 3.3 | 38 |
| ALP | Ce(IV) ions | Colorimetric | 0–50; 50–250 | 2.3 | 39 |
| ALP | CuO NPs@ZIF-8 | Fluorescent | 0.042–6.67 × 10³; 6.67 × 10³–1.20 × 10⁴ | —/0.042 | This work |
| ALP | CuO NPs@ZIF-8 | Colorimetric | 0.0046–6.15 × 10³; 6.15 × 10³–1.23 × 10⁴ | —/0.0046 | This work |
| GOX | CdTe@ZIF-8 CSNCPs | Fluorescent | 1–100 | 0.26/— | 40 |
| GOX | CuNCs@ZIF-8 | Fluorescent | 0.001–0.01 | 0.001/— | 41 |
| GOX | Dual-emission carbon nanodots | Fluorescent | 0.1–2500 | 0.035/— | 42 |
| GOX | CdS quantum dots | Colorimetric | 0.025–50 mg L−1 | 6.6 μg L−1 | 43 |
| GOX | CuO NPs@ZIF-8 | Fluorescent | 0.86–2.63 × 10⁴; 2.63 × 10⁴–1.23 × 10⁵ | —/0.86 | This work |
| GOX | CuO NPs@ZIF-8 | Colorimetric | 0.081–8.09 × 10³; 8.09 × 10³–1.62 × 10⁵ | —/0.081 | This work |
Detection of ALP
ALP plays an important role in the metabolism of organisms, with high catalytic efficiency and wide substrate specificity.29 It is commonly used as an enzyme marker in immunoassays, histochemical staining, and gene assays, and biomarkers for bone and hepatobiliary diseases.30 Thus, a sensitive ALP activity measurement method is of great significance for diagnostic and analytical applications. Under the optimum conditions, a fluorescence and UV-vis dual-mode analysis through adding GOX (concentrations are 17.53 and 40.46 U mL−1, respectively) to the system to enhance its sensitivity was established for the detection of ALP. With the increasing concentration of ALP, the fluorescence intensities of the reaction solution at 580 nm and 430 nm decrease and increase (Fig. 10E and F), respectively, and have obvious fluorescence changes (the insert picture of Fig. 10E and F). The good linear equation obtained at 580 nm is y = −246.4492x + 1894.81 (R2 = 0.9948) with the ALP concentration in the range of 4.17 × 10⁻⁵–6.67 U mL−1 (Fig. 10D(a)) and the LOQ is 0.042 mU mL−1. Moreover, another linear equation was obtained at 430 nm with the ALP concentration of 6.67–12.00 U mL−1, which is y = 108.7669x + 433.9091 (R2 = 0.9990) (Fig. 10D(b)).For the detection of ALP through UV-vis analysis, as shown in Fig. 11E and F, the absorbance decreases and increases at 416 nm and 344 nm with the increase in ALP concentration, respectively. The calibration curves were established based on the absorption at 416 nm and 344 nm versus ALP concentrations of 4.62 × 10⁻⁶–6.15 U mL−1 and 6.15–12.31 U mL−1, respectively. As shown in Fig. 11D, the linear equations are y = −0.2486x + 1.6216 (R2 = 0.9963) (curve (a)) and y = 0.03441x + 0.8674 (R2 = 0.9939) (curve (b)), respectively, with the LOQ of 0.0046 mU mL−1. As compared with the other report's methods for the detection of ALP, the proposed approach in this study has a wider linear range and a lower LOQ (Table 1). The material synthesis process is easy and facile. More importantly, this method can detect both GOX and ALP, and both fluorescence and UV-vis detection modes can be used.
Selectivity of the method and determination of GOX and ALP in biological samples
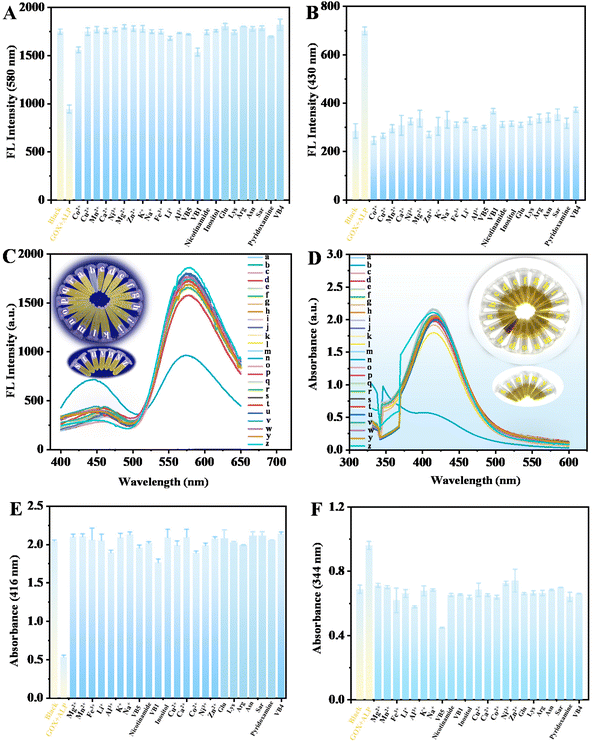
To test the selectivity of this dual-mode analysis assay, control experiments were performed using potential interferences in human serum and rabbit plasma, including metal ions (Co2+, Cu2+, Mn2+, Zn2+, K+, Na+, Fe3+, Li+, and Al3+), vitamin (VB5, VB4, pyridoxamine, and VB1), amino acids (Glu, Lys, Arg, Asn, and Sar), nicotinamide and inositol. As exhibited in Fig. 12, it is found that only GOX + ALP triggers a significant fluorescence (580 nm and 430 nm) (Fig. 12A and B) and UV-vis (416 nm and 344 nm) (Fig. 12E and F) signal, while other interfering substances have a negligible effect on the fluorescence and UV-vis response. This can also be confirmed by fluorescence (the insert picture of Fig. 12C) and color changes (the insert picture of Fig. 12D) of the solutions. These results demonstrate that this assay possesses good selectivity towards GOX and ALP.To confirm the feasibility of the developed dual-mode analysis platform for practical applications, the GOX and ALP in human serum and rabbit plasma samples were analyzed under the optimum conditions using the standard addition method. Table 2 shows that no GOX and ALP are detected in rabbit plasma and human serum, and the spiked recoveries are in the range of 81.1–116.7% with the RSDs less than 5.0%. The results show that the method is accurate and holds great potential in real sample analysis.
| Analyte | Sample | Fluorescent sensor | UV-vis sensor | ||||||||
|---|---|---|---|---|---|---|---|---|---|---|---|
| Detected (U mL−1) | Added (U mL−1) | Found (U mL−1) | Recovery (%) | RSD (%, n = 3) | Detected (U mL−1) | Added (U mL−1) | Found (U mL−1) | Recovery (%) | RSD (%, n = 3) | ||
| a “—”, not detected. | |||||||||||
| GOX | Rabbit plasma | — | 0.00086 | 0.00090 | 104.7 | 1.1 | — | 0.00081 | 0.00085 | 104.9 | 0.4 |
| 17.53 | 20.90 | 119.2 | 0.1 | 80.92 | 85.40 | 105.6 | 4.6 | ||||
| 122.73 | 109.14 | 88.8 | 5.0 | 161.85 | 138.22 | 85.4 | 0.7 | ||||
| Human serum | — | 0.00086 | 0.00087 | 101.0 | 1.4 | — | 0.00081 | 0.00084 | 103.7 | 0.9 | |
| 17.53 | 20.01 | 114.1 | 0.4 | 80.92 | 92.60 | 114.4 | 2.8 | ||||
| 122.73 | 104.32 | 85.00 | 0.6 | 161.85 | 149.87 | 92.6 | 4.1 | ||||
| ALP | Rabbit plasma | — | 0.000042 | 0.000041 | 97.6 | 1.0 | — | 0.00046 | 0.00052 | 113.0 | 1.0 |
| 2.67 | 3.19 | 119.5 | 0.6 | 6.15 | 5.01 | 81.5 | 5.0 | ||||
| 12.00 | 9.61 | 80.0 | 3.1 | 12.31 | 14.36 | 116.7 | 4.9 | ||||
| Human serum | — | 0.000042 | 0.000042 | 100.00 | 0.2 | — | 0.00046 | 0.00040 | 87.0 | 0.7 | |
| 2.67 | 3.18 | 119.1 | 2.4 | 6.15 | 4.99 | 81.1 | 0.4 | ||||
| 12.00 | 9.60 | 80.00 | 0.4 | 12.31 | 13.72 | 111.5 | 1.4 | ||||
Conclusions
In summary, a sensor is established for the first time to detect enzyme activity using the multiple enzyme-like activities of CuO NPs@ZIF-8, which exhibits both ALP and GOX enzyme-like activity. During the reaction process, there are four main reactions, and the additions of different concentrations of GOX and ALP can amplify the detection signal accordingly. Different concentrations of GOX and ALP can lead to different main reaction processes in the solution and produce different main products, resulting in different signal intensities. This is one of the interesting points of this study. Most importantly, both fluorescent and colorimetric methods can be used for the quantitative detection of GOX and ALP activity and semi-quantitative detection can be achieved through the changes in fluorescence and solution color with the fluorescence of the solution changes from yellow to blue under ultraviolet light (365 nm) and the color of the solution changes from yellow to colorless under daylight. The dual-mode detection strategy can improve the accuracy and reliability of the sensing system, which exhibits excellent detection performance. To the best of our knowledge, it is the first time to use this strategy to monitor natural enzymes' activity, which also provides a reference for the combined application of natural and simulated enzymes in sensing detection. In addition, the established method may also be used to detect metal ions, organic phosphorus pesticides, small molecule compounds, etc.Author contributions
Guo-Ying Chen: conceptualization, methodology, investigation, writing – original draft. Mao-Ling Luo, Tong-Qing Chai, Jia-Li Wang and Ling-Xiao Chen: investigation. Li Chen: funding acquisition. Feng-Qing Yang: supervision, project administration, funding acquisition, and writing – review and editing.Conflicts of interest
The authors all have read and approved the present manuscript and declared that they have no conflicts of interest.Acknowledgements
This work was supported by the National Key Research and Development Program of China (no. 2021YFC2103300).References
- L. L. Lei, D. H. Song, L. H. Fan, B. Liu, M. Z. He, X. H. Sun, W. J. Xu, K. Tao, H. Huang and Y. X. Li, Microchim. Acta, 2022, 189, 61 CrossRef CAS PubMed
.
- J. H. Chang, X. R. Qin, S. Y. Li, F. He, S. L. Gai, H. Ding and P. P. Yang, ACS Appl. Mater. Interfaces, 2022, 14, 45217–45228 CrossRef CAS PubMed
.
- I. Schomburg, A. Chang, S. Placzek, C. Söhngen, M. Rother, M. Lang, C. Munaretto, S. Ulas, M. Stelzer, A. Grote, M. Scheer and D. Schomburg, Nucleic Acids Res., 2012, 41, D764–D772 CrossRef PubMed
.
- L. Qin, X. Y. Wang, Y. F. Liu and H. Wei, Anal. Chem., 2018, 90, 9983–9989 CrossRef CAS PubMed
.
- H. Zhang, Z. Y. Wu, Y. Y. Yang, F. Q. Yang and S. P. Li, J. Chromatogr. A, 2019, 1603, 216–230 CrossRef CAS PubMed
.
- Z. H. Zhao, Y. J. Huang, W. R. Liu, F. G. Ye and S. L. Zhao, ACS Sustainable Chem. Eng., 2020, 8, 4481–4488 CrossRef CAS
.
- G. Darabdhara, J. Bordoloi, P. Manna and M. R. Das, Sens. Actuators, B, 2019, 285, 277–290 CrossRef CAS
.
- H. Zhang, X. Liang, L. Han and F. Li, Small, 2018, 14, 1803256 CrossRef PubMed
.
- Y. S. Cui, X. Lai, K. Liu, B. Liang, G. L. Ma and L. G. Wang, RSC Adv., 2020, 10, 7012–7018 RSC
.
- S. Gao, H. Lin, H. Zhang, H. Yao, Y. Chen and J. Shi, Adv. Sci., 2019, 6, 1801733 CrossRef PubMed
.
- Y. Y. Zhao, J. Yang, G. Y. Shan, Z. Y. Liu, A. N. Cui, A. L. Wang, Y. W. Chen and Y. C. Liu, Sens. Actuators, B, 2020, 305, 127420 CrossRef CAS
.
- R. Li, X. Huang, G. Lu and C. Feng, RSC Adv., 2018, 8, 24346–24354 RSC
.
- W. Chen, J. Chen, Y. B. Feng, L. Hong, Q. Y. Chen, L. F. Wu, X. H. Lin and X. H. Xia, Analyst, 2012, 137, 1706–1712 RSC
.
- J. X. Chen, L. Huang, Q. Q. Wang, W. W. Wu, H. Zhang, Y. X. Fang and S. J. Dong, Nanoscale, 2019, 11, 5960–5966 RSC
.
- H. A. Yurtsever and A. E. çetin, Colloids Surf., A, 2021, 625, 126980 CrossRef CAS
.
- L. Y. He, Y. X. Lu, X. Y. Gao, P. S. Song, Z. X. Huang, S. Liu and Y. Y. Liu, ACS Sustainable Chem. Eng., 2018, 6, 12132–12139 CrossRef CAS
.
- K. Wang, J. Liu, X. Wang, X. Y. Liu, J. S. Hu, E. S. Li, Y. S. Zhao, R. S. Zhao and S. H. Yang, Microchem. J., 2022, 172, 106921 CrossRef CAS
.
- G. Y. Chen, X. Zhou, T. Tian, C. Y. Zhang, S. J. Yin, H. Chen, Y. Xu and F. Q. Yang, Anal. Biochem., 2022, 652, 114748 CrossRef CAS PubMed
.
- G. Y. Chen, S. J. Yin, L. Chen, X. Zhou and F. Q. Yang, Biosensors, 2022, 12, 1049 CrossRef CAS PubMed
.
- H. L. Yu, F. Q. Dong, B. W. Li and F. S. Riehle, Sens. Actuators, B, 2019, 299, 126983 CrossRef CAS
.
- J. Anzai, H. Takeshita, Y. Kobayashi, T. Osa and T. Hoshi, Anal. Chem., 1998, 70, 811–817 CrossRef CAS PubMed
.
- T. T. Li, D. L. Deng, D. D. Tan, S. Chen, Y. B. Ji and R. J. Li, Anal. Bioanal. Chem., 2022, 414, 6247–6257 CrossRef CAS PubMed
.
- H. Zhang, G. Y. Chen, Z. M. Qian, W. J. Li, C. H. Li, Y. J. Hu and F. Q. Yang, Anal. Bioanal. Chem., 2021, 413, 2457–2466 CrossRef CAS PubMed
.
- X. E. Zhao, Y. N. Zuo, Y. H. Xia, J. Sun, S. Y. Zhu and G. B. Xu, Sens. Actuators, B, 2022, 371, 132548 CrossRef CAS
.
- H. Cao, J. Y. Xiao and H. M. Liu, Biochem. Eng. J., 2019, 152, 107384 CrossRef CAS
.
- S. J. Yin, G. Y. Chen, C. Y. Zhang, J. L. Wang and F. Q. Yang, Microchim. Acta, 2023, 190, 25 CrossRef CAS PubMed
.
- J. Mu, L. C. He, W. P. Fan, W. Tang, Z. T. Wang, C. Jiang, D. Y. Zhang, Y. J. Liu, H. Z. Deng, J. H. Zou, O. Jacobson, J. L. Qu, P. Huang and X. Y. Chen, Small, 2020, 16, 2004016 CrossRef CAS PubMed
.
- K. L. Fan, J. Q. Xi, L. Fan, P. X. Wang, C. H. Zhu, Y. Tang, X. D. Xu, M. M. Liang, B. Jiang, X. Y. Yan and L. Z. Gao, Nat. Commun., 2018, 9, 1440 CrossRef PubMed
.
- N. Xia, Y. J. Zhang, X. Wei, Y. P. Huang and L. Liu, Anal. Chim. Acta, 2015, 878, 95–101 CrossRef CAS PubMed
.
- Q. Hu, B. J. Zhou, P. Y. Dang, L. Z. Li, J. M. Kong and X. J. Zhang, Anal. Chim. Acta, 2017, 950, 170–177 CrossRef CAS PubMed
.
- J. R. Cao, Q. Wu, X. Chang, H. Y. Chu, H. Zhang, X. D. Fang and F. F. Chen, Spectrochim. Acta, Part A, 2022, 281, 121615 CrossRef CAS PubMed
.
- J. X. Tian, Y. Z. Fang, R. Yu, Z. Y. Zhang, Y. T. Zhuo, J. Y. He, S. Wu, Q. Xiao and X. J. Kong, Anal. Methods, 2021, 13, 322–326 RSC
.
- L. Hou, Y. X. Qin, J. Y. Li, S. Y. Qin, Y. L. Huang, T. R. Lin, L. Q. Guo, F. G. Ye and S. L. Zhao, Biosens. Bioelectron., 2019, 143, 111605 CrossRef CAS PubMed
.
- K. Ye, L. J. Wang, H. W. Song, X. Li and X. H. Niu, J. Mater. Chem. B, 2019, 7, 4794–4800 RSC
.
- L. Xiong, L. Yu, S. Li, L. X. Feng and Y. X. Xiao, Mikrochim. Acta, 2021, 188, 236 CrossRef CAS PubMed
.
- F. Y. Tian, J. Zhou, J. Ma, S. Y. Liu, B. N. Jiao and Y. He, Mikrochim. Acta, 2019, 186, 408 CrossRef PubMed
.
- Q. Hu, M. H. He, Y. Q. Mei, W. J. Feng, S. Jing, J. M. Kong and X. J. Zhang, Talanta, 2017, 163, 146–152 CrossRef CAS PubMed
.
- Z. Q. Gao, K. C. Deng, X. D. Wang, M. Miró and D. P. Tang, ACS Appl. Mater. Interfaces, 2014, 6, 18243–18250 CrossRef CAS PubMed
.
- H. W. Song, H. Y. Wang, X. Li, Y. X. Peng, J. M. Pan and X. H. Niu, Anal. Chim. Acta, 2018, 1044, 154–161 CrossRef CAS PubMed
.
- K. Wang, N. Li, J. Zhang, Z. Q. Zhang and F. Q. Dang, Biosens. Bioelectron., 2017, 87, 339–344 CrossRef CAS PubMed
.
- X. Hu, X. D. Liu, X. D. Zhang, H. X. Chai and Y. M. Huang, Biosens. Bioelectron., 2018, 105, 65–70 CrossRef CAS PubMed
.
- F. Qu, X. Y. Guo, D. Y. Liu, G. Chen and J. M. You, Sens. Actuators, B, 2016, 233, 320–327 CrossRef CAS
.
- G. X. Cao, X. M. Wu, Y. M. Dong, Z. J. Li and G. L. Wang, Molecules, 2016, 21, 902 CrossRef PubMed
.
Footnote |
| † Electronic supplementary information (ESI) available. See DOI: https://doi.org/10.1039/d3na00427a |
| This journal is © The Royal Society of Chemistry 2023 |

