 Open Access Article
Novel preparation of metal-free carbon xerogels under acidic conditions and their performance as high-energy density supercapacitor electrodes†
Karim Ahmed
Abbas
ab,
Abdalla
Abdelwahab
 *bc,
Hesham S.
Abdel-Samad
 a,
Sayed Sabet
Abd-El Rehim
a and
Hamdy H.
Hassan
 *ab
*ab
aChemistry Department, Faculty of Science, Ain-Shams University, Abassia, Cairo 11566, Egypt. E-mail: hamdihh@sci.asu.edu.eg
bFaculty of Science, Galala University, Sokhna, Suez 43511, Egypt
cMaterials Science and Nanotechnology Department, Faculty of Postgraduate Studies for Advanced Sciences (PSAS), Beni-Suef University, 62511 Beni-Suef, Egypt. E-mail: aabdelwahab@psas.bsu.edu.eg
First published on 20th September 2023
Abstract
The development of metal-free supercapacitor electrodes with a high energy density is a crucial requirement in the global shift towards sustainable energy sources and industrial pursuit of an optimal supercapacitor. Indeed, from an industrial perspective, time assumes a paramount role in the manufacturing process. A majority of synthesis methods employed for the fabrication of carbon xerogel-based supercapacitor electrodes are characterized by prolonged durations, and result in relatively poor energy and power density. These limitations hinder their practical applications and impede their widespread manufacturing capabilities. In this study, carbon xerogel-based supercapacitor electrodes were made in the shortest time ever reported by making the condition highly acidic with hydrochloric acid (HCl). Furthermore, the investigation of the effect of HCl concentrations (0.1 M, 0.05 M, and 0.01 M) on the morphology and electrochemical behavior of the prepared samples is reported herein. Interestingly, the highest concentration of HCl developed the highest BET surface area, 1032 m2 g−1, which enforced the capacitive behavior to deliver a specific capacitance of 402 F g−1 at 1 A g−1 and a capacitance retention of 80.8% at a current density of 2 A g−1 in an electrolyte containing 0.5 M H2SO4 + 0.5 M Na2SO4. Moreover, an impressive energy density of 45 W h kg−1 at a power density of 18.2 kW kg−1 was achieved. Interestingly, as the HCl concentration increased, the equivalent series resistance decreased to 3.9 W with carbon xerogel 0.1 M HCl (CX0.1). The superior performance of CX0.1 may be attributed to its enlarged BET surface area, pore volume, pore diameter, and smaller particle size. This work provides a facile approach for the large-scale production of metal-free carbon supercapacitor electrodes with improved performance and stability and opens novel horizons to explore the impacts of many types of catalysts during the carbon xerogel preparation.
1. Introduction
High-powered and reliable electrochemical energy storage (EES) devices have gained significant interest in recent decades due to the rapid growth of green energy technologies.1 Supercapacitors (SCs), which are considered to be one of the strongest candidates for EES devices, have been known for their fascinating features such as a high power density and an outstanding retention rate for more than 106 cycles.1,2 SCs are also considered to have more potential as storage devices than batteries.3 However, SCs have a critical drawback of low energy density.4 This problem can be solved by the continuous development of surface morphology to enable high adsorption for charges and develop electrodes and/or electrolytes with a high operating voltage window.Carbon-based electroactive materials are characterized by their high surface area, which upgrades their electrochemical performance in supercapacitor applications. For example, graphene,5 graphite,6 carbon nanotubes,7 and carbon gels.8,9 The latter category consists of interconnected porous networks between two organic monomers, which are formed by a sol–gel polycondensation reaction. The high surface area (up to 3000 m2 g−1),10 the magnificent electrical conductivity (up to 240 S m−1),11 and the possibility of tailoring their textural surface by modifying the conditions of the synthesis12 are the main powers of carbon gels. The synthesis of carbon gels includes five core steps: (i) polymerization reaction to enable the formation of colloidal particles, (ii) gelation, at which the hydrogel is made and networking structure is established, (iii) curing, to strengthen the networking structure, (iv) drying step, to get rid of the solvent, and (v) pyrolysis, to improve the porosity of the surface.13 The choice of the drying method will determine the type of carbon gel produced, as evaporative drying, supercritical drying, and freeze drying produce carbon xerogel (CX), carbon aerogel, and carbon cryogel, respectively.12 The first one, CX, is the scope of this research due to its relative ease of synthesis, which thus facilitates its mass production.
In fact, the performance of carbon xerogels in supercapacitor applications has been extensively reported. Huang et al.14 prepared xerogel monoliths of a maximum capacitance of 323 F g−1 at 1 A g−1 in 6 M KOH as an electrolyte at a potential window (from −1 V to 0.2 V) by the method of hydrothermal polycondensation without involving a catalyst or a template. Nevertheless, this method consumes high energy and long time as two consecutive carbonization processes are required. Additionally, the narrow potential window restricted it to a limited number of applications. Khammar et al.15 managed to prepare carbon xerogels with a capacitance of 126 F g−1 at 1 A g−1 in 0.5 M H2SO4 as aqueous electrolytes, in the potential window between 0 V and 0.8 V. However, by incorporating polyaniline into the structure of the xerogel, the specific capacitance was elevated to 495 F g−1 at the same current density due to the contributing redox reaction. M. Canal-Rodríguez et al.9 synthesized a pristine carbon xerogel with a capacitance of 112 F g−1 at 0.2 A g−1 (at a potential window from 0 V to 1 V), but by introducing a graphene oxide to the xerogel, its capacitance reached 130 F g−1. This was explained by the high electrical conductivity of the graphene oxide. Clearly, xerogel's performance can be improved significantly. As a result, extensive research has been done to examine the effects of altering several variables during the preparation of xerogels (molar ratios, drying method, carbonization temperature, catalyst type, and pH), as well as the relationship between these variables and the newly discovered properties of the xerogel. Despite this, the effect of pH, which is influenced by the type of catalyst used and the molar ratio of the initial precursors, continues to be the key factor in determining the xerogel's surface texture design.13,16–19
The development of super-energy-density supercapacitors is another result of the widening of the voltage range. The right electrolyte must be used, as an alkaline aqueous electrolyte has a maximum voltage range of 1 V, a neutral aqueous electrolyte may increase the operating voltage from 1.7 to 2 V, and an organic electrolyte could even double this range up to 4 V.20 However, their difficult handling, modest conductivity, and high cost do not make them the optimum choice for application.21
To the best of our knowledge, no study has been made yet to investigate the properties of the CX prepared under very strong acidic conditions (pH 0–1). In this work, CX electrodes were prepared from resorcinol and formaldehyde monomers in the presence of various concentrations of hydrochloric acid as the polymerization catalyst within a very short gelation period. Moreover, the effect of different concentrations of HCl on the morphology and porosity of carbon xerogels was studied. In addition, these materials were investigated as supercapacitor electrodes in an aqueous mixture containing 0.5 M H2SO4 + 0.5 M Na2SO4 as an electrolyte.
2. Experimental
2.1 Materials
The following materials were used for the experiment: sheets of graphite, resorcinol (R) (M. wt = 110.1 g mole−1; Techno Pharmchem), formaldehyde (F) (M. wt = 30 g mole−1, 37% wt in water; Tekkim), distilled water (W; M. wt = 18 g mole−1), hydrochloric acid, (HCl; M. wt = 36.5 g mole−1, 37% vol. in water; Sigma Aldrich), sodium sulphate (anhydrous) (M. wt = 142.02 g mole−1, 99%; Tekkim), sulfuric acid (M. wt = 98 g mole−1; Alpha chemical) and Nafion 5% wt. dispersed in water (Sigma Aldrich).2.2 Carbon xerogel fabrication
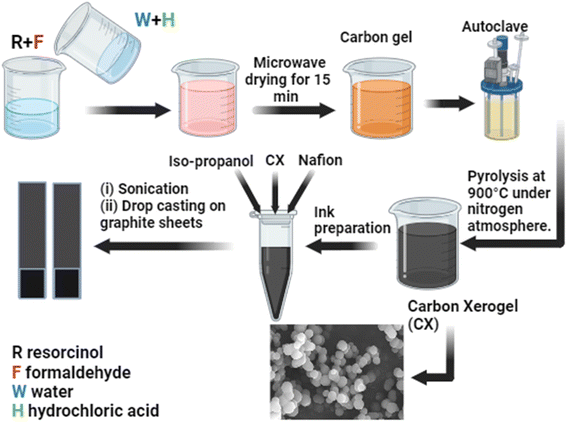
Scheme 1 illustrates the preparation steps of carbon xerogels. The polycondensation of resorcinol (R) and formaldehyde (F) in water (W) in the presence of HCl (H) as an acidic catalyst was investigated in this work. The procedures were mentioned elsewhere.22 However, some modifications were implemented. In brief, a molar ratio of 1/2 of R/F was used, followed by stirring until complete solubility was achieved. After that, a mixture of water and HCl was prepared based on a molar ratio of 1/17 of R/W and a molar ratio of 200/1 of R/H, respectively. The obtained organic gel was dried in a microwave for 20–30 min. Finally, the acidic carbon xerogel was obtained after ignition at 900 °C at a constant heating rate of 5 °C min−1 in a nitrogen atmosphere for 2 hours in a Nabertherm (TF-80) tube furnace. Furthermore, to measure the extent of the effect of the acidic catalyst on the properties of the CX, three different concentrations of HCl were used during the preparation process (0.01 M, 0.05 M, and 0.1 M), and the final products are assigned as CX0.01, CX0.05, and CX0.1. The pH of these samples before and after mixing is elucidated in Table 2.2.3 Characterization
Nitrogen adsorption and desorption isotherms were performed with nitrogen gas adsorption at −196 °C using a BELSORP-minX volumetric BET surface area analyzer to characterize the surface texture of the samples, which were previously degassed under vacuum conditions at 120 °C for 12 hours. The morphology of the samples was investigated using a field emission scanning electron microscope (FESEM, FEI Quanta). The high-resolution transmission electron microscopy (HRTEM) was performed using a JEM-2100F, Jeol, Japan. The phase identification and crystallinity were studied using an Angstrom ADX 8000 X-ray diffractometer. Furthermore, the Fourier-transform infrared spectra of the samples were recorded using a Thermo-Scientific FTIR spectrometer with KBr discs. The electrochemical characterization techniques were carried out using a potentiostat–galvanostat workstation (Metrohm AUTOLAB, 320N). The electrochemical techniques used were cyclic voltammetry (CV), galvanostatic charge–discharge (GCD), and electrochemical impedance spectroscopy (EIS). The CV curves were recorded at a potential window from 0 to 1.7 V at different scan rates (1–100 mV s−1). The GCD analyses were performed at different applied current densities from 0.5 to 10 A g−1. The EIS measurements were tested in the frequency range of 100 kHz–1 mHz.2.4 Electrode preparation and electrochemical measurements
First, the ink for each sample was prepared. This ink was made by mixing 2 mg of the electroactive CX with 400 μL propanol and 15 μL Nafion. The ink was then sonicated for 15–30 min. Second, two pieces of graphite sheets were cut with a dimension of 3 × 1 cm, and then, an area of 1 cm2 was marked on the bottom of each piece. Before last, each electrode was cleaned carefully with ethanol and dried in a drying oven at 80 °C for 2 hours. Finally, the whole ink was dropped gradually and slowly on the specific area of each electrode equally by using a micropipette and then dried at 80 °C for 2 hours.The electrochemical measurements were carried out using a two-electrode system in an electrolyte containing 0.5 M H2SO4 + 0.5 M Na2SO4. It should be noted that 73 hours were spent soaking the electrodes in the utilized electrolyte, to achieve perfect diffusion of the electrolyte ions deeply in the structure of materials, and to stabilize the electric double layer on the electrode interface, which is the core of the processing of this supercapacitor application. The fabrication steps and the electrode preparation are demonstrated in Scheme 1.
3. Results and discussion
3.1. pH and morphology dependence
By changing the pH, the textural changes can be noticed while keeping the initial precursor's molar ratio (R/F) fixed at 0.5. For instance, at pH 9, a surface area of 600 m2 g−1 with a 4 hour gelation time and narrow pores (8–70 nm) was reported (Table 1). However, a surface area of 400 m2 g−1 with a 3 hour gelation time and a 12 nm pore diameter was obtained at pH 7. Moreover, by using acetic acid to maintain the pH between 4 and 5, a large surface area can be observed with extremely narrow pore diameters (from 1.8 to 2 nm); however, the gelation time was 4 hours. These changes and the corresponding pH values are summarized in Table 1. It should be noted that the pH of CX preparation adjusts the mechanism of the initial precursor components. It is clear that, under acidic conditions, the polycondensation reaction between the catalyst and the formaldehyde is more favorable, and the number of molecules contributing to the gel structure declines, as does the degree of networking, whereas, under basic conditions, the direct reaction between resorcinol and formaldehyde improves, resulting in a highly branched structure that needs elongated gelation periods. Based on the previous work, the suggested mechanism between formaldehyde and resorcinol in the presence of HCl is the formation of methyl hypochlorite and resorcinol anions. Individual self-assembled semi-spherical clusters are formed from these particles due to their electrostatic attraction between each other. Subsequently, a rapid development of cross-linking occurs between them, which lasts until the completion of the network-like structure of perfect spheres.16,24| pH | Methods of pH adjustment | Surface area m2 g−1 | Pore diameter (nm) | Gelation time | Reference | |
|---|---|---|---|---|---|---|
| Basic catalyst | Acidic catalyst | |||||
| 9 | NaOH | — | 600 | — | 4 hours | 16 |
| 5 | NaOH | — | 636 | 70 | 3 hours | 18 |
| 5.8 | NaOH | 661 | 40 | 3 hours | ||
| 6.5 | NaOH | 676 | 8 | 3 hours | ||
| 7 | NaOH | 400 | 12 | 3 hours | ||
| 5.85 | Na2CO3 | — | 615 | 40 | — | 19 |
| 4.1 | — | CH3COOH | 1420 | 1.88 | 4 hours | 23 |
| 4.5 | CH3COOH | 1798 | 2.08 | 4 hours | ||
| 4.8 | CH3COOH | 1924 | 2.12 | 4 hours | ||
| 5.2 | CH3COOH | 1482 | 2.04 | 4 hours | ||
| 1.2 | — | HCl | 974 | 1.64 | 25 min | |
| 1 | HCl | 780 | 1.77 | 2 min | This work | |
| >1 | HCl | 1032 | 1.78 | 1 min | ||
| CX sample | R/F pH | HCl/water pH | Mixture pH | Gelation time/min |
|---|---|---|---|---|
| CX0.01 | 3.34 | 1.43 | 1.2 | 25 |
| CX0.05 | 3.34 | 1.19 | 1 | 2–3 |
| CX0.1 | 3.34 | 1.06 | >1 | 1–2 |
3.2. Surface area and pore size distribution analysis
Studying the N2 adsorption/desorption isotherms is the most powerful method for estimating and measuring the surface area and the pore size distribution of solid samples. As shown in Fig. 1a, CX0.01, CX0.05, and CX0.1 behave as a typical adsorption isotherm of type I, which shows a rapid increase in the volume of adsorbed nitrogen at very low relative pressures. This upsurge in the N2 volume reached ∼199, 247, and 264 cm3 g−1 (STP) for CX0.01, CX0.05, and CX0.1, respectively. These values are attributed to the predominant microporous morphology for these samples, according to the latest IUPAC technical report.25 For all studied materials, the desorption branch closely matches the adsorption branch with a disclosure at a relative pressure of about 0.24. This demonstrates the presence of a low percentage of mesoporous characters.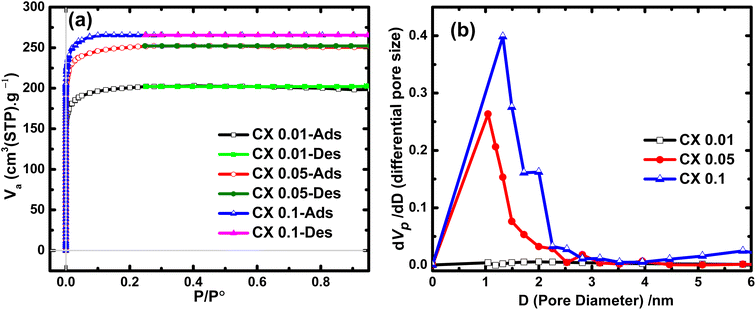 | ||
| Fig. 1 (a) N2 adsorption/desorption isotherms of the prepared CX samples and (b) their corresponding pore size distribution curves. | ||
By applying the Brunauer–Emmett–Teller (BET) equation, which is the convenient model for multilayer adsorption, the specific surface areas (SBET) of the investigated materials were 780, 974, and 1032 m2 g−1 for CX0.01, CX0.05, and CX0.1, respectively. This development in the SBET for CX0.1 was due to the expansion in the volume of micropores, which was calculated by t-plot, as this volume is the highest for CX0.1 (0.45 cm3 g−1). However, this value declined to 0.34, and 0.39 cm3 g−1, for CX0.01, and CX0.05, respectively. Interestingly, these values of SBET are greater than those of many carbon xerogel samples that are either blank15,26 (and other blanks demonstrated in Table 1) or doped with different materials.13,15,27,28 The values of SBET and pore volumes are summarized in Table 3.
| Sample | S BET m2 g−1 | S micro m2 g−1 | V mesopores cm3 g−1 | V P cm3 g−1 | D N m |
|---|---|---|---|---|---|
| a Where, SBET = specific surface area, Smicro = micropores surface area, Vmesopores = mesopores volume, Vp = total pore volume, and d = average pore diameter. | |||||
| CX0.01 | 780 | 994 | 0.02 | 0.34 | 1.64 |
| CX0.05 | 974 | 1286 | 0.12 | 0.39 | 1.77 |
| CX0.1 | 1032 | 1304 | 0.15 | 0.45 | 1.78 |
Additionally, the analysis of the Barrett–Joyner–Halenda (BJH) approach that is usually used to evaluate both the pore size distribution (Fig. 1b) and the volume of mesopores. The mesopore volumes for the prepared samples are 0.02, 0.12, and 0.15 cm3 g−1 for CX0.01, CX0.05, and CX0.1, respectively. Moreover, the BJH plot reveals that the pore size ranges of the interconnected structure for the samples are 60–270 nm for macropores, 2–10 nm for mesopores, and <2 nm for micropores, which are predominant for the three studied materials. Notably, the tight and loose packing of CX particles are the forming effects of mesopores and macropores, respectively.29 The macropores for CX0.01 (<50 nm) could not be detected by the BJH method, which explained the plateau line of the samples.30
3.3. X-ray diffraction (XRD) analysis
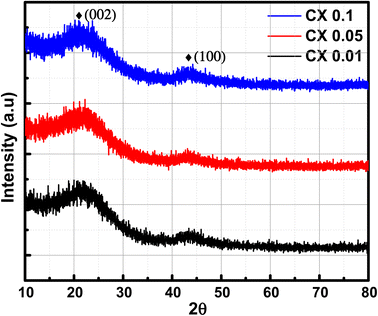
The X-ray diffraction patterns of the studied CX samples are shown in Fig. 2. There are two diffraction peaks at around 21° and 43°. The broad-centered peak at about 21° is related to the amorphous ordering of graphitic planes in the (002) orientation. However, the peak at nearly 43° is the result of the diffraction at the (100) plane.26 Furthermore, the Scherrer equation is used to estimate the average crystallite size depending on the crystallographic planes (002) and (100) (eqn (1)). | (1) |
3.4. FTIR analysis
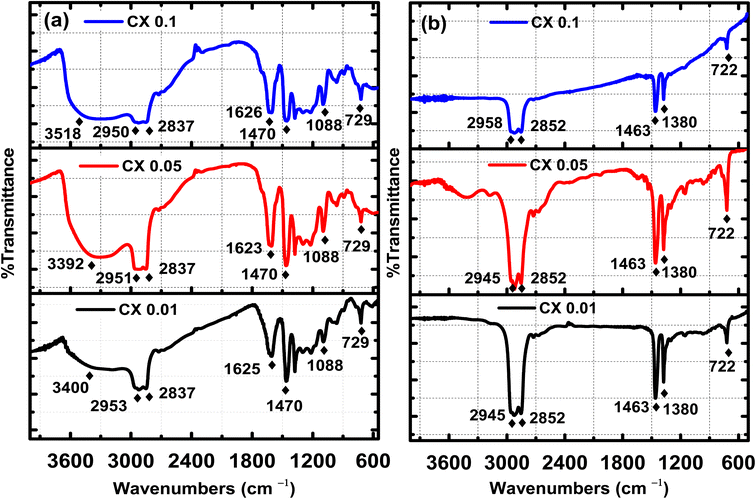
Fourier transform infrared (FTIR) spectroscopy is a powerful technique for indicating the presence of surface functional groups such as carbonyl, hydroxyl, and carboxyl groups. Fig. 3 demonstrates the FTIR spectra of the organic gel, i.e., before carbonization in Fig. 3a, and the carbon xerogel, i.e., after carbonization in Fig. 3b. Fig. 3b confirms the elimination of most of the oxygenated groups, which are shown in Fig. 3a before the carbonization process. In fact, all the ignited samples have the same peaks and the same functional groups, but with different transmitted responses. Indeed, before the ignition process, the following functional groups existed:–OH with a broad band of stretching vibration at 3550–3200 cm−1, which is related to chemisorbed water by KBr pellets used for the analysis,31 C–H stretching vibration at 3000–2840 cm−1, C![[double bond, length as m-dash]](https://www.rsc.org/images/entities/char_e001.gif) C stretching vibration at ≈1625 cm−1, C
C stretching vibration at ≈1625 cm−1, C![[double bond, length as m-dash]](https://www.rsc.org/images/entities/char_e001.gif) C bending at 730–665 cm−1, C–H bending at ≈1470 cm−1, C–O stretching at 1088 cm−1, and N–H stretching at 3500–3300 cm−1. However, the functional groups (hydroxyl group “OH”, primary amin “N–H”, and primary alcohol “C–O”) were eliminated by carbonization, as no absorption peaks are shown in their corresponding ranges. Furthermore, after pyrolysis, all the remaining functional groups are for: C–H stretching vibration at 3000–2840 cm− 1, C–H bending at ≈1470 cm−1 and 1380 cm−1, and C
C bending at 730–665 cm−1, C–H bending at ≈1470 cm−1, C–O stretching at 1088 cm−1, and N–H stretching at 3500–3300 cm−1. However, the functional groups (hydroxyl group “OH”, primary amin “N–H”, and primary alcohol “C–O”) were eliminated by carbonization, as no absorption peaks are shown in their corresponding ranges. Furthermore, after pyrolysis, all the remaining functional groups are for: C–H stretching vibration at 3000–2840 cm− 1, C–H bending at ≈1470 cm−1 and 1380 cm−1, and C![[double bond, length as m-dash]](https://www.rsc.org/images/entities/char_e001.gif) C bending at 730–665 cm−1,32 which are characterized by the functional groups of the carbon xerogel surface.15 This is straightforward evidence for the absence of any oxygenated or even nitrogenated functional groups in all the pyrolyzed samples.
C bending at 730–665 cm−1,32 which are characterized by the functional groups of the carbon xerogel surface.15 This is straightforward evidence for the absence of any oxygenated or even nitrogenated functional groups in all the pyrolyzed samples.
3.5. Surface morphology
Fig. 4 and 5 show the textural morphology of the synthesized samples by FESEM and HRTEM. The FESEM images of all samples (Fig. 4a–i) indicate the homogeneity of the perfect spherical shaped particles. The higher the concentration of the acid, the greater the spherical degree obtained. More isolated spherical particles were noticed for CX0.1 and CX0.05 samples (Fig. 4d–i) than for the CX0.01 sample (Fig. 4a–c). This indicates that the concentration of HCl influences the produced morphology. Interestingly, the surface of the spheres for all samples is smooth and clean, which proves the absence of impurities during both the ignition and preparation processes. This presents the power of controlling the molarity of HCl to produce such perfect spherical particles and control the pores among them.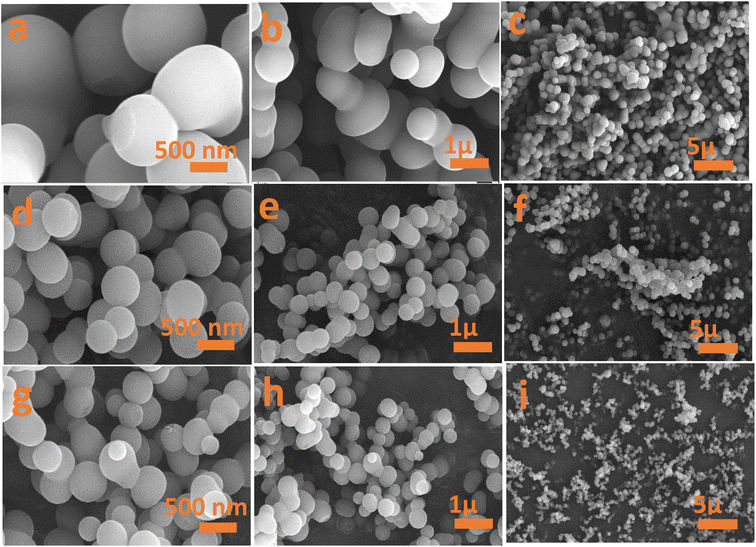 | ||
| Fig. 4 FESEM images of (a–c) CX0.01, (d–f) CX0.05 and (g–i) CX0.1 at three scales of 500 nm, 1 μm, and 5 μm. | ||
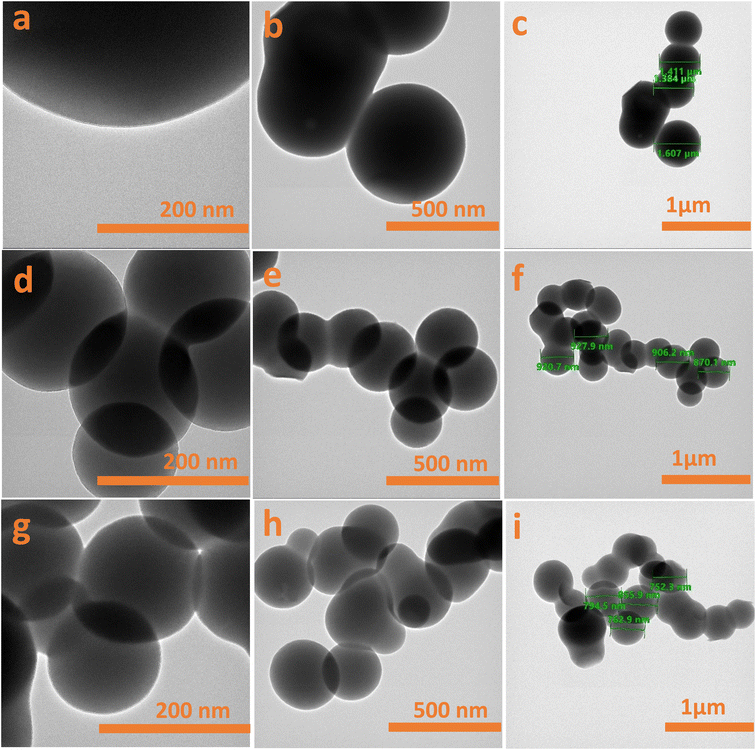 | ||
| Fig. 5 HRTEM images of (a–c) CX0.01, (d–f) CX0.05 and (g–i) CX0.1 at three scales: 200 nm, 500 nm, and 1 μm. | ||
Additionally, Fig. 5 shows the HRTEM images, which support the FESEM morphology of the typical spherical form. They also provide convincing evidence not only for the dependence of the pore size on the HCl concentration but also for the dependence of the sphere size of particles on the HCl concentration. For the latter one, the average sizes of the spheres are 1.455 μm, 905 nm, and 760 nm for CX0.01, CX0.05, and CX0.1, respectively, with ± 20 nm, 95% confidence. This trend in the average size of spheres corroborates the trend in the crystallite sizes determined based on the Scherrer equation (see Section 3.3).
3.6. Electrochemical measurements
Fig. 6a illustrates the cyclic voltammetry curves of all CX samples. The rounded-rectangular shape of the curves is indicative of the electric double-layer capacitance.34 The absence of any redox peaks demonstrates that the electric double layer is the source of the obtained capacitance. The area under the CV curve is directly proportional to the capacitance value,35 indicating that CX0.1 has the highest capacitance value. Fig. 6b, shows the CV curves of CX0.1 at different scan rates (1–100 mV s−1). The behavior of the sample is conserved even at a high scan rate, which indicates superior electrochemical stability under extreme conditions.
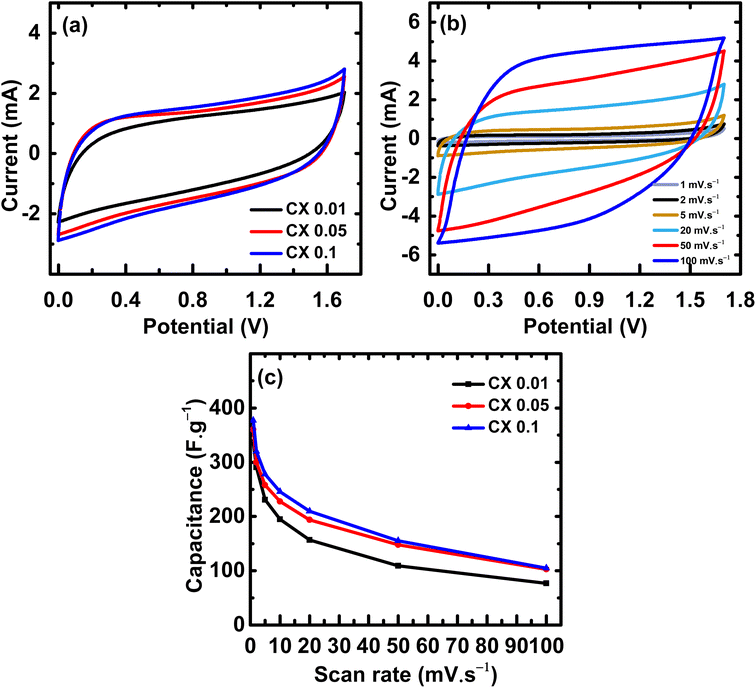 | ||
| Fig. 6 (a) CV curves of all samples at 20 mV s−1 from 0 to 1.7 V, (b) CV curves of CX0.1 at scan rates from 1 to 100 mV s−1, and (c) the capacitances values from CV curves at different scan rates. | ||
The improvement in the area under the CV curves as the scan rate increased suggests that the utilized electrolyte has a good electrochemical stability.36 The stability of the used electrolyte in the high operating potential window (0–1.7 V) may be attributed to a synergistic effect of the high surface area, the percentage of meso/micropores, and the presence of mixed electrolytes whose ions (H+, Na+, and SO42−) are of different sizes and capable of occupying pores of different diameters. This maximizes the active surface area and magnifies the number of stored charges, leading to an electric double layer of large thickness, which stabilizes the potential range even at values higher than 1 V.
The specific capacitance value (F g−1) can be calculated from cyclic voltammograms using eqn (2):37
 | (2) |
| Sample name | Scan rate mV s−1 | ||||||||
|---|---|---|---|---|---|---|---|---|---|
| 1 | 2 | 5 | 10 | 15 | 20 | 25 | 50 | 100 | |
| Specific capacitance F g−1 | |||||||||
| CX0.01 | 337 | 291 | 231 | 195 | 173 | 157 | 145 | 109 | 77 |
| CX0.05 | 370 | 300 | 258 | 228 | 208 | 194 | 183 | 148 | 103 |
| CX0.1 | 377 | 320 | 278 | 246 | 225 | 210 | 197 | 155 | 105 |
By using GCD plots, the specific capacitance can be estimated precisely by applying eqn (3):15
 | (3) |
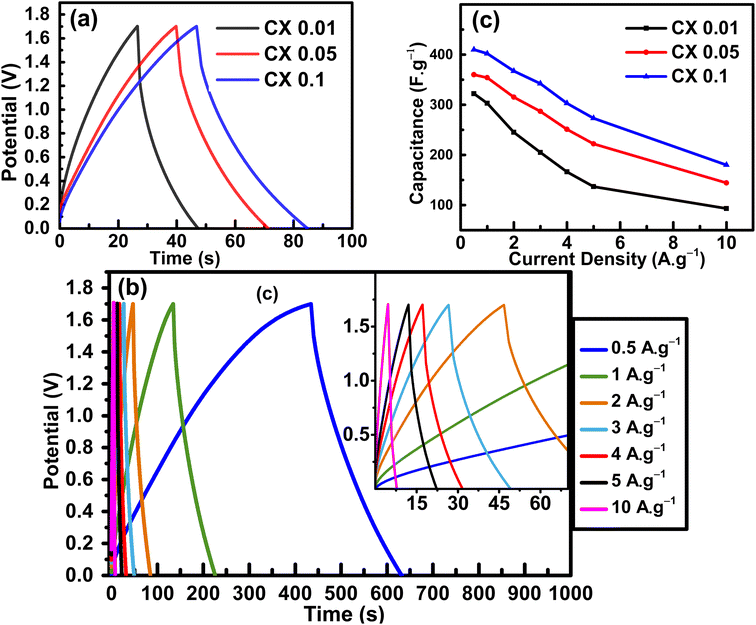
By increasing the current density to 5 A g−1, the capacitance retentions were 43%, 62%, and 67% for CX0.01, CX0.05, and CX0.1, respectively. In fact, this retention rate at high current densities makes these materials suitable for many high-tech applications. The reduction in the specific capacitance with the increase in current density is a common behavior for supercapacitors, and it is the result of an incomplete penetration of ions into the whole surface area of the electrocatalyst at high CDs.39 Moreover, this may be a result of the electrolyte ions suffering from an ohmic resistance in the vertical direction of the long-depth micropores.40 Therefore, comparable pore diameters and ion sizes should be achieved for better ionic adsorption, and for the formation of a dense electric double layer (H+ 0.10 nm, SO4− 0.53 nm, Na+ 0.36 nm).41,42
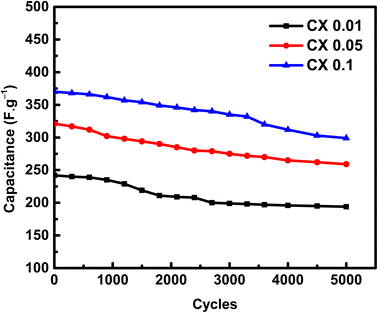
An essential electrochemical test is the stability of SC after many cycles at a specific current density. To study the stability of electrodes, the electroactive substances were cycled for 5000 cycles at 2 A g−1 (Fig. 8). The capacitance retention after 5000 cycles at a high current density of 2 A g−1 was 80.1%, 80.6%, and 80.8% for CX0.01, CX0.05, and CX0.1, respectively.
Although the stability of the electrodes at a high current density is important from practical and commercial perspectives, the high current density does not provide more time to complete the adsorption of ions into the pores. However, this achieved level of stability and capacitive retention could be enforced by the incorporation of the CX surface with functional groups such as nitrogen, oxygen, or both, to support the non-faradaic mechanism with faradaic reactions, which stabilize the capacitance at high current densities.43 This hopefully will be considered and investigated in the future scope of this work.
The coulombic efficiency (CE), which is the ratio of the discharging time (DT) and the charging time (CT) at the same current density, is one of the crucial criteria of SC evaluation and can be determined by comparing the CE of the first cycle with that of the last one of the stability test.44 CE can be calculated using eqn (4):
 | (4) |
At the first cycle, the CE values of the studied samples were 84%, 87%, and 91% for CX0.01, CX0.05, and CX0.1, respectively. These values experienced a slight decrease from 12% to 10% after 5000 cycles (Table 6), which is considered as a favorable electrochemical indication for the examined samples, taking into consideration the high current density of the test and the small mass of the CX used in the electrode fabrication, which have a strong impact on the obtained capacitance,45 as well as the total dependency of a single mechanism for the charge storage and the wide voltage range used in this study, which is larger than that of all the reported studies, as shown in the comparison at Table 7. This wide potential window offers a tradeoff, as it provides a significant specific capacitance, and an extremely high density of power and energy. However, this is on account of the cycle life, and the retention rate.46
| Sample name | Current density A g−1 | Values of resistance from Nyquist plot (Section 3.6.3) | ||||||||
|---|---|---|---|---|---|---|---|---|---|---|
| 0.5 | 1 | 2 | 3 | 4 | 5 | 10 | ||||
| Specific capacitance F g−1 | R s (Ω) | R ct (Ω) | ESR (Ω) | |||||||
| CX0.01 | 322 | 303 | 245 | 205 | 166 | 137 | 93 | 0.699 | 7.399 | 12.92 |
| CX0.05 | 360 | 354 | 315 | 287 | 251 | 222 | 144 | 0.626 | 5.443 | 10.58 |
| CX0.1 | 410 | 402 | 367 | 342 | 303 | 273 | 180 | 0.565 | 1.355 | 3.92 |
| Sample name | First cycle | Last cycle | ||||
|---|---|---|---|---|---|---|
| Charging time (s) | Discharging time (s) | Coulombic efficiency (%) | Charging time (s) | Discharging time (s) | Coulombic efficiency (%) | |
| CX0.01 | 33.36 | 28.02 | 84% | 30.02 | 21.60 | 72% |
| CX0.05 | 53.11 | 46.03 | 87% | 41.05 | 32.1 | 78% |
| CX0.1 | 55.60 | 50.30 | 91% | 46.23 | 37.62 | 81% |
| Number of cycles | Current density A g−1 | Potential window | Electrolyte | Capacitance F g−1 | Capacitance retention | Reference | |
|---|---|---|---|---|---|---|---|
| From | To | ||||||
| 5000 | 2 | 0 | 1.7 V | 0.5 M H2SO4 + 0.5 M Na2SO4 | 367 | 80.8% | This work CX0.1 |
| 10k | 1 | −0.1 | −1 V | 6 M KOH | 189 | 73.5% | 8 |
| 2000 | 0.5 | 0 | 0.7 V | 1 M H2SO4 | 221 | 100% | 47 |
| 5000 | 1 | 0 | −1 V | 6 M KOH | 332 | 100% | 14 |
| 2000 | 1 | 0 | 0.8 V | 6 M KOH | 248 | 99% | 28 |
| 10k | 5 | −0.4 | −0.8 V | 1 M KOH | 131 | 97.7% | 43 |
| 1500 | 1 | 0 | 0.8 V | 1 M H2SO4 | 126 | 92% | 15 |
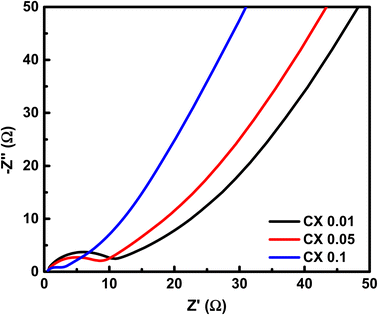
From the HF region, the intersections with the x-axis, Z′ (real impedance), are corresponding to the resistance of the electrolyte (Table 4), which are 0.699, 0.626, and 0.565 Ω for CX0.01, CX0.05, and CX0.1, respectively. Following the occurrence of these intersections, it is possible for a semicircle to manifest, serving as an indicator of the resistance that arises from faradaic reactions. The reactions seen in the examined materials are non-faradaic and do not involve any charge transfer. However, the semicircle in the resulting plot may exhibit modest distortion or incompleteness, characterized by a slightly rounded behavior of the lines in the medium-frequency (MF) region. Moreover, in the same region, the existence of angle 45° is a result of the dependence of the diffusion of the electrolyte ions on the frequency, which is designated as “Warburg impedance”.48 Furthermore, the degree of perpendicularity of lines at the LF region is a sign for the level of capacitance behavior of the material.49 The greater the degree of verticality between the line and the x-axis, the greater the potential enhancement in capacitive performance. In Fig. 9, the line of CX0.1 is more perpendicular than those of CX0.05 and CX0.01, pointing to its enhanced performance of capacitance. As a result, the value of equivalent series resistance for CX0.1 is the lowest (3.92 Ω) among the other materials, which produces a supercapacitor electrode with a high degree of conductivity and efficiency.50 Moreover, Fig. 10a presents a Ragone plot, which is used to measure the correlation between energy density (E.D) and power density (P.D) of the assembled supercapacitor. Eqn (5) and (6) provide the calculations for both E.D. and P.D., respectively, for each specified current density.
 | (5) |
 | (6) |
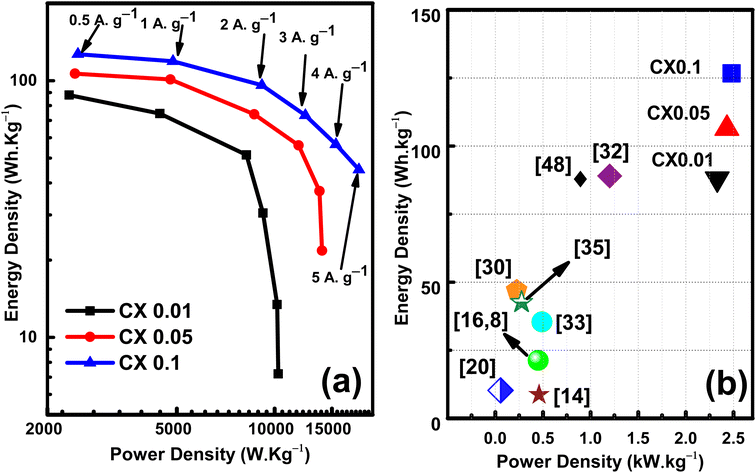 | ||
| Fig. 10 (a) Ragone plot, and (b) comparison of the samples' power and energy densities with the published work. | ||
The values of the energy density at 5 A g−1 are 7.2, 21.7, and 45 W h kg−1 at power densities of 10.25, 13.97, and 18.16 kW kg−1 for CX0.01, CX0.05, and CX0.1, respectively. These values surged by decreasing the current density. Consequently, at 0.5 A g−1 these values reached 88, 107, and 127 W h kg−1 at a power density of 2.33, 2.43, 2.48 kW kg−1, respectively. However, the opposite can be seen for the power density. By lowering the current density, a drop can be observed. Therefore, the maximum power densities at 5 A g−1 are 10.257, 13.979, and 18.166 kW kg−1 for CX0.01, CX0.05, and CX0.1, respectively. Despite that, these values are very high compared to many previous materials in the literature, as shown in Fig. 10b. As a future research scope of this work, various electrolytes may be studied, which may improve the specific capacitance and capacitance retention at higher current densities.
4. Conclusion
A rapid and facile preparation method for metal-free carbon xerogels has been developed in an acidic medium. Different concentrations of HCl were employed to assess their effect on the produced porosity and electrochemical performance as supercapacitor electrodes. Developments in the materials' surface area, pore volume, and pore diameter were noticed with increasing the acidity of the starting solution. The obtained BET-surface areas are 780, 974, and 1032 m2 g−1 for CX0.01, CX0.05, and CX0.1, respectively. This improvement in the surface area led to a promotion in the creation of the electrochemical double-layer, which enhances the specific capacitance. For instance, a specific capacitance of 402 F g−1 was obtained at a scan rate of 1 A g−1 for CX0.1 with a retention of 80.8% after 5000 repetitive cycles at a current density of 2 A g−1 Moreover, an energy density of 45 W h kg−1 at a power density of 18.2 kW kg−1 was delivered, indicating the great potential use of these materials as supercapacitor electrodes. This work opens the door for the large-scale production of carbon xerogels with a high surface area that can be used in diverse applications.Conflicts of interest
There are no conflicts to declare.References
- P. Chang, H. Mei, Y. Zhao, M. Zhang, X. Wang, L. Cheng and L. Zhang, Engineering (Ni, Co, Mn) Se nanoarrays with 3D-Printed wave-structure carbon-rich lattice towards ultrahigh-capacity, complex-stress and all-climate energy storage, Carbon, 2022, 187, 375–385, DOI:10.1016/j.carbon.2021.11.029
.
-
B. E. Conway, Electrochemical Capacitors Based on Pseudocapacitance, in Electrochemical Supercapacitors: Scientific Fundamentals and Technological Applications, ed. B.E. Conway, Springer US, Boston, MA, 1999, pp. 221–257, DOI:10.1007/978-1-4757-3058-6_10
.
- H. Shao, Y.-C. Wu, Z. Lin, P.-L. Taberna and P. Simon, Nanoporous carbon for electrochemical capacitive energy storage, Chem. Soc. Rev., 2020, 49, 3005–3039, 10.1039/D0CS00059K
.
- P. Sharma and V. Kumar, Current Technology of Supercapacitors: A Review, J. Electron. Mater., 2020, 49, 3520–3532, DOI:10.1007/s11664-020-07992-4
.
- P. Chang, H. Mei, Y. Zhao, L. Pan, M. Zhang, X. Wang, L. Cheng and L. Zhang, Nature-Inspired 3D Spiral Grass Structured Graphene Quantum Dots/MXene Nanohybrids with Exceptional Photothermal-Driven Pseudo-Capacitance Improvement, Advanced Science, 2022, 9, 2204086, DOI:10.1002/advs.202204086
.
- X. Fan, H. Gao, L. Zhong, H. Xu, J. Liu and C. Yan, Investigation of the capacitive performance of polyaniline/modified graphite composite electrodes, RSC Adv., 2015, 5, 3743–3747, 10.1039/C4RA15209C
.
- J. N'Diaye, M. Elshazly and K. Lian, Capacitive charge storage of tetraphenylporphyrin sulfonate-CNT composite electrodes, Electrochim. Acta, 2021, 389, 138593, DOI:10.1016/j.electacta.2021.138593
.
- X. Yang, Z. Jiang, B. Fei, J. Ma and X. Liu, Graphene functionalized bio-carbon xerogel for achieving high-rate and high-stability supercapacitors, Electrochim. Acta, 2018, 282, 813–821, DOI:10.1016/j.electacta.2018.06.131
.
- M. Canal-Rodríguez, J. A. Menéndez, M. A. Montes-Morán, I. Martín-Gullón, J. B. Parra and A. Arenillas, The role of conductive additives on the performance of hybrid carbon xerogels as electrodes in aqueous supercapacitors, Electrochim. Acta, 2019, 295, 693–702, DOI:10.1016/j.electacta.2018.10.189
.
- A.-L. Peikolainen, M. Uibu, J. Kozlova, H. Mändar, A. Tamm and A. Aabloo, Carbon xerogel from 5-methylresorcinol-formaldehyde gel: the controllability of structural properties, Carbon Trends, 2021, 3, 100037, DOI:10.1016/j.cartre.2021.100037
.
-
M. Canal-Rodríguez, J. A. Menéndez, and A. Arenillas, Carbon Xerogels: The Bespoke Nanoporous Carbons, 2018, DOI:10.5772/intechopen.71255
.
-
C. Moreno-Castilla, Carbon Gels in Catalysis, Carbon Materials for Catalysis, 2008, pp. 373–399, DOI:10.1002/9780470403709.ch10
.
- J. L. Figueiredo and M. F. R. Pereira, Synthesis and functionalization of carbon xerogels to be used as supports for fuel cell catalysts, J. Energy Chem., 2013, 22, 195–201, DOI:10.1016/S2095-4956(13)60025-X
.
- M. Huang, S. J. Yoo, J.-S. Lee and T.-H. Yoon, Electrochemical properties of an activated carbon xerogel monolith from resorcinol–formaldehyde for supercapacitor electrode applications, RSC Adv., 2021, 11, 33192–33201, 10.1039/D1RA06462B
.
- H. Khammar, A. Abdelwahab, H. S. Abdel-Samad and H. H. Hassan, Synergistic performance of simply fabricated polyaniline/carbon xerogel composite as supercapacitor electrode, J. Electroanal. Chem., 2021, 880, 114848, DOI:10.1016/j.jelechem.2020.114848
.
- L. Zubizarreta, A. Arenillas, A. Domínguez, J. A. Menéndez and J. J. Pis, Development of microporous carbon xerogels by controlling synthesis conditions, J. Non-Cryst. Solids, 2008, 354, 817–825, DOI:10.1016/j.jnoncrysol.2007.08.015
.
- A. M. ElKhatat and S. A. Al-Muhtaseb, Advances in Tailoring Resorcinol-Formaldehyde Organic and Carbon Gels, Adv. Mater., 2011, 23, 2887–2903, DOI:10.1002/adma.201100283
.
- N. Rey-Raap, A. Arenillas and J. A. Menéndez, A visual validation of the combined effect of pH and dilution on the porosity of carbon xerogels, Microporous Mesoporous Mater., 2016, 223, 89–93, DOI:10.1016/j.micromeso.2015.10.044
.
- N. Job, A. Théry, R. Pirard, J. Marien, L. Kocon, J.-N. Rouzaud, F. Béguin and J.-P. Pirard, Carbon aerogels, cryogels and xerogels: influence of the drying method on the textural properties of porous carbon materials, Carbon, 2005, 43, 2481–2494 CrossRef CAS
.
- L. Tang, X. Ji, P. Wu, H. Luo, Y. Zhu, L. Deng, S. Cheng and M. Liu, Achievement of high energy carbon based supercapacitors in acid solution enabled by the balance of SSA with abundant micropores and conductivity, Electrochim. Acta, 2020, 353, 136562, DOI:10.1016/j.electacta.2020.136562
.
- M. Zeller, V. Lorrmann, G. Reichenauer, M. Wiener and J. Pflaum, Relationship Between Structural Properties and Electrochemical Characteristics of Monolithic Carbon Xerogel-Based Electrochemical Double-Layer Electrodes in Aqueous and Organic Electrolytes, Adv. Energy Mater., 2012, 2, 598–605, DOI:10.1002/aenm.201100513
.
- A. Abdelwahab, F. Carrasco-Marín and A. F. Pérez-Cadenas, Binary and Ternary 3D Nanobundles Metal Oxides Functionalized Carbon Xerogels as Electrocatalysts toward Oxygen Reduction Reaction, Materials, 2020, 13(16), 3531, DOI:10.3390/ma13163531
.
- H. Y. Tian, C. E. Buckley, M. Paskevicius and D. A. Sheppard, Acetic acid catalysed carbon xerogels derived from resorcinol-furfural for hydrogen storage, Int. J. Hydrogen Energy, 2011, 36, 671–679, DOI:10.1016/j.ijhydene.2010.10.054
.
- Q. Zhao, X. Wang, C. Wu, J. Liu, H. Wang, J. Gao, Y. Zhang and H. Shu, Supercapacitive performance of hierarchical porous carbon microspheres prepared by simple one-pot method, J. Power Sources, 2014, 254, 10–17 CrossRef CAS
.
- M. Thommes, K. Kaneko, A. V. Neimark, J. P. Olivier, F. Rodriguez-Reinoso, J. Rouquerol and K. S. W. Sing, Physisorption of gases, with special reference to the evaluation of surface area and pore size distribution (IUPAC Technical Report), Pure Appl. Chem., 2015, 87, 1051–1069, DOI:10.1515/pac-2014-1117
.
- W. Kiciński, M. Szala and M. Nita, Structurally tailored carbon xerogels produced through a sol–gel process in a water–methanol–inorganic salt solution, J. Sol-Gel Sci. Technol., 2011, 58, 102–113, DOI:10.1007/s10971-010-2362-y
.
- A. Abdelwahab, F. Carrasco-Marín and A. F. J. M. Pérez-Cadenas, Binary and Ternary 3D Nanobundles Metal Oxides Functionalized Carbon Xerogels as Electrocatalysts toward Oxygen Reduction, Reaction, 2020, 13, 3531 CAS
.
- M. A. Wasfey, A. Abdelwahab, F. Carrasco-Marín, A. F. Pérez-Cadenas, H. H. Abdullah, I. S. Yahia and A. A. Farghali, Nickel cobaltite functionalized silver doped carbon xerogels as efficient electrode materials for high performance symmetric supercapacitor, Materials, 2020, 13, 1–16, DOI:10.3390/ma13214906
.
- U. Thubsuang, H. Ishida, S. Wongkasemjit and T. Chaisuwan, Self-formation of 3D interconnected macroporous carbon xerogels derived from polybenzoxazine by selective solvent during the sol-gel process, J. Mater. Sci., 2014, 49, 4946–4961, DOI:10.1007/s10853-014-8196-1
.
- S. Fu, Q. Fang, A. Li, Z. Li, J. Han, X. Dang and W. Han, Accurate characterization of full pore size distribution of tight sandstones by low-temperature nitrogen gas adsorption and high-pressure mercury intrusion combination method, Energy Sci. Eng., 2021, 9, 80–100, DOI:10.1002/ese3.817
.
- M. E. Araghi, N. Shaban and M. Bahar, Synthesis and characterization of nanocrystalline barium strontium titanate powder by a modified sol-gel processing, Mater. Sci.-Pol., 2016, 34(1), 63–68, DOI:10.1515/msp-2016-0020
.
-
T. J. Bandosz, Surface Chemistry of Carbon Materials, Carbon Materials for Catalysis, 2008, pp. 45–92, DOI:10.1002/9780470403709.ch2
.
- M. D. Stoller and R. S. Ruoff, Best practice methods for determining an electrode material's performance for ultracapacitors, Energy Environ. Sci., 2010, 3, 1294–1301, 10.1039/C0EE00074D
.
- K. Adams, A. F. González, J. Mallows, T. Li, J. H. J. Thijssen and N. Robertson, Facile synthesis and characterization of Bi13S18I2 films as a stable supercapacitor electrode material, J. Mater. Chem. A, 2019, 7, 1638–1646, 10.1039/C8TA11029H
.
- H. Wang, H. Yi, X. Chen and X. Wang, One-step strategy to three-dimensional graphene/VO2 nanobelt composite hydrogels for high performance supercapacitors, J. Mater. Chem. A, 2014, 2, 1165–1173, 10.1039/C3TA13932H
.
- S. Shenbagavalli, M. Muthuvinayagam and M. S. Revathy, Preparation and characterization of proton (H+) conducting solid blend polymer electrolytes based on PEO/P(VdF-HFP) incorporated with NH4SCN, J. Non-Cryst. Solids, 2022, 579, 121368, DOI:10.1016/j.jnoncrysol.2021.121368
.
- Y. Cao, X. Wang, Z. Gu, Q. Fan, W. Gibbons, V. Gadhamshetty, N. Ai and G. Zeng, Potassium chloride templated carbon preparation for supercapacitor, J. Power Sources, 2018, 384, 360–366, DOI:10.1016/j.jpowsour.2018.02.079
.
- P. Chang, H. Mei, Y. Zhao, W. Huang, S. Zhou and L. Cheng, 3D Structural Strengthening Urchin-Like Cu(OH)2-Based Symmetric Supercapacitors with Adjustable Capacitance, Adv. Funct. Mater., 2019, 29, 1903588, DOI:10.1002/adfm.201903588
.
-
S. K. Kandasamy, K. N. Singaram, H. Krishnamoorthy, C. Arumugam, S. Palanisamy, K. Kandasamy, A. Khan, A. M. Asiri, and H. D. Cancar, Microwave-Assisted Graphene-Based Conducting Polymer Materials for Supercapacitors, Handbook of Supercapacitor Materials, 2021, pp. 299–326, DOI:10.1002/9783527824779.ch11
.
- Y.-R. Nian and H. Teng, Nitric Acid Modification of Activated Carbon Electrodes for Improvement of Electrochemical Capacitance, J. Electrochem. Soc., 2002, 149, A1008, DOI:10.1149/1.1490535
.
- M. Inagaki, H. Konno and O. Tanaike, Carbon materials for electrochemical capacitors, J. Power Sources, 2010, 195, 7880–7903, DOI:10.1016/j.jpowsour.2010.06.036
.
- A. Shokry, A. M. Elshaer, J. El Nady, S. Ebrahim and M. Khalil, High energy density and specific capacity for supercapacitor based on electrochemical synthesized polyindole, Electrochim. Acta, 2022, 423, 140614, DOI:10.1016/j.electacta.2022.140614
.
- L. Chen, J. Deng, Y. Yuan, S. Hong, B. Yan, S. He and H. Lian, Hierarchical porous graphitized carbon xerogel for high performance supercapacitor, Diamond Relat. Mater., 2022, 121, 108781, DOI:10.1016/j.diamond.2021.108781
.
- M. Rajkumar, C.-T. Hsu, T.-H. Wu, M.-G. Chen and C.-C. Hu, Advanced materials for aqueous supercapacitors in the asymmetric design, Prog. Nat. Sci.: Mater. Int., 2015, 25, 527–544, DOI:10.1016/j.pnsc.2015.11.012
.
- S. Zhang and N. Pan, Supercapacitors Performance Evaluation, Adv. Energy Mater., 2015, 5, 1401401, DOI:10.1002/aenm.201401401
.
- Z. Dai, C. Peng, J. H. Chae, K. C. Ng and G. Z. Chen, Cell voltage versus electrode potential range in aqueous supercapacitors, Sci. Rep., 2015, 5, 9854, DOI:10.1038/srep09854
.
- Z. Zapata-Benabithe, F. Carrasco-Marín, J. de Vicente and C. Moreno-Castilla, Carbon xerogel microspheres and monoliths from resorcinol-formaldehyde mixtures with varying dilution ratios: preparation, surface characteristics, and electrochemical double-layer capacitances, Langmuir, 2013, 29, 6166–6173, DOI:10.1021/la4007422
.
- A. Singh and A. Chandra, Significant Performance Enhancement in Asymmetric Supercapacitors based on Metal Oxides,
Carbon nanotubes and Neutral Aqueous Electrolyte, Sci. Rep., 2015, 5, 15551, DOI:10.1038/srep15551
.
- P. Chang, H. Mei, M. Zhang, Y. Zhao, X. Wang, L. Cheng and L. Zhang, 3D Printed Electrochromic Supercapacitors with Ultrahigh Mechanical Strength and Energy Density, Small, 2021, 17, 2102639, DOI:10.1002/smll.202102639
.
- P. Chang, H. Mei, Y. Tan, Y. Zhao, W. Huang and L. Cheng, A 3D-printed stretchable structural supercapacitor with active stretchability/flexibility and remarkable volumetric capacitance, J. Mater. Chem. A, 2020, 8, 13646–13658, 10.1039/D0TA04460A
.
Footnote |
| † Electronic supplementary information (ESI) available. See DOI: https://doi.org/10.1039/d3na00517h |
| This journal is © The Royal Society of Chemistry 2023 |

