
Development of Z-scheme bimetallic tungstate-supported nitrogen deficient g-C3N4 heterojunction for the treatment of refractory pharmaceutical pollutants†
H.
Leelavathi
a,
R.
Muralidharan
 b,
N.
Abirami
a and
R.
Arulmozhi
*a
b,
N.
Abirami
a and
R.
Arulmozhi
*a
aDepartment of Chemistry, SRM Institute of Science and Technology, Kattankulathur, Chengalpattu-603 203, Tamil Nadu, India. E-mail: arulmozr@srmist.edu.in
bDepartment of Physics, Saveetha School of Engineering, Saveetha Institute of Medical and Technical Sciences, Thandalam, Chennai-602 105, Tamil Nadu, India
First published on 4th April 2023
Abstract
Nitrogen-deficient graphitic carbon nitride (ND-GCN) was fabricated using a simple liquid-phase polycondensation process, and the nitrogen deficiencies in GCN were verified by XPS and EDS. To develop a Z-scheme-based bimetallic tungstate (BMT) supported ND-GCN photocatalyst, wet chemical approach and polycondensation method are utilized. The physicochemical properties are characterized, and the data indicate that well-matched band structures between BMT and ND-GCN make it easier to establish a Z-scheme charge transfer route. The photocatalytic efficiency of the fabricated photocatalyst is compared using pharmaceutical effluent followed by model organic pollutants, such as azithromycin (AZI) and tetracycline (TC). The CoZnWO4/ND-GCN composite material demonstrates the best degradation performance towards AZI (98.64%) and TC (98.17%) within 75 min, and towards pharmaceutical effluent (97.84%) within 90 min, whereas the NiCoWO4/ND-GCN shows the following degradation performance: AZI (91.19%), TC (96.31%) and pharmaceutical effluent (95.16%). The quality of the treated pharmaceutical effluent was improved using CoZnWO4/ND-GCN catalyst, as indicated by the reduction in chemical oxygen demand (COD) of 80.07%, and the total organic carbon (TOC) of 76.8%. A detailed examination of the mechanism demonstrates that the hydroxyl (˙OH) and superoxide (˙O2−) radicals are responsible for photocatalytic degradation. The findings of this study offer a novel approach to developing a powerful photocatalyst for the mineralization of challenging organic compounds in water.
1. Introduction
Water is a crucial resource for all living species to sustain their lives. The quality of water is harmed by its increased utilization for home, agricultural, and industrial purposes. Recent studies have found that pharmaceutical chemicals, among other new types of pollutants, persist in large amounts in water bodies, plants, soil, and sediment.1,2 Two factors, namely the improper dumping of tones of unwanted medications into the environment and the discharge of pharmaceutical industrial effluents into water streams, are responsible for the poisoning of water resources by pharmaceutical components.3 Higher antibiotic concentrations in water resources, especially in drinking water, imply that current water treatment methods are inadequate for eliminating antibiotics from an aquatic medium. Antibiotics are responsible for the development of antibiotic-resistant bacteria and genes that can harm marine ecosystems and endanger human safety.4–6 Accordingly, it is crucial to find a strategy that is both economical and effective for degrading antibiotic contamination, which remains a major challenge in the current situation.Among the numerous catalytic processes, photocatalysis has received much research interest. This is because when the catalyst is exposed to light, it speeds up the reaction and lowers the activation energy without acting as either reactant or product.7,8 The photocatalysis technique is a realistic, beneficial, cost-effective method as well as a sustainable solution for removing hazardous compounds from the atmosphere and water bodies and the production of sustainable energy, such as hydrogen fuel production via water splitting technology.9–11 Photocatalytic antibiotic degradation uses advanced oxidation and reduction pathways to help in the mineralization of antibiotics into CO2 and H2O, which is aided by the production of active radical species as per respective band gap ranges in the presence of a lamp source (ultraviolet, visible light, and sunshine) and suitable photocatalyst materials.12,13
Researchers have significantly focused on creating specific semiconductor features for the superior degrading performance of impurities.14 To obtain visible-light active materials, various techniques can be employed, including morphology alteration, compositing, doping, and the combing of inorganic and organic precursors (such as reduced graphene, carbon nitrides, boron nitrides, nonmetals, and noble metals). Hybrids and heterojunctions, which combine two or more semiconductors with distinct bandgaps,15,16 were found to be superior to other modification methods in this study. Photo-induced electron transition occurs from the valence band (VB) to the conduction band (CB) when the heterojunction is activated by adequate light energy. Coulomb repulsion slows down the rate at which electrons and holes transfer during conduction. Surface catalytic reactions are difficult because conduction weakens the redox capacity of electrons and holes.17–20 This opens up new possibilities for both advanced and conventional nanostructures. Amongst numerous types of semiconductor photocatalysts, BMTs with the empirical formula MWO4 (M = Fe, Co, Zn, Ni, and Cu) have received extensive attention owing to their environmental remediation. ZnWO4, NiWO4, and CoWO4 distinguish as the ideal catalysts amongst the metal WO4 materials listed above because of their high chemical stability, low energy gap, ease of preparation, and low cost.21,22 However, ZnWO4, NiWO4, and CoWO4 are unsuccessful in visible light owing to the quick recombination of photocarriers following excitation. Metal ion doping and the formation of heterojunctions between semiconductors have been identified as excellent strategies for improving the catalytic performance of tungstate materials.
In the field of photocatalysis, GCN has drawn a lot of interest as a metal-free semiconductor owing to its outstanding stability, non-poisonous, and reasonable preparation cost.23 GCN's applications are severely constrained by the material's limited consumption of visible and sunlight, higher surface area, and a significantly higher rate of photogenerated e− and h+ recombination.24 Vacancy defects in semiconductors serve as a vital contribution to enhancing photocatalysis performance by modifying the semiconductor electrical structure and raising the number of reaction sites for reactant compounds. For example, Zhang et al. developed a mesoporous GCN that was nitrogen-deficient in visible light by employing the thermal polymerization-aided colloidal crystal template technique.25 Sun et al. developed an N-deficient GCN using a one-step calcination method based on the supply of gas molecules.26 It has been claimed that GCN containing nitrogen defects can be produced at high temperatures using a straightforward and efficient solid-state chemical polycondensation technique. Xu and Zhang produced nitrogen-defective GCN by polymerizing urea with a small amount of formamide and observed increased photocatalytic performance for H2 generation.27 The nitrogen defects boosted light absorption at the uncondensed terminal NHx lattice sites and the separation performance of the photogenerated charge carriers.
The objectives of this study are (1) to comprehend the impact of the N-deficiency in GCN and BMT (NiCoWO4 and CoZnWO4) behavior in nanocomposite-based photocatalysts for the degradation of antibiotics and (2) to evaluate and optimize the photocatalytic efficiency and layout the conceptual design for a Z-scheme charge transfer pathway. To achieve these goals, this study compares the degradation of antibiotics by applying BMT-modified ND-GCN photocatalysts to their pristine forms. Based on this analysis, we examine the differences between pristine and modified ND-GCN nanomaterials in photocatalytic reaction processes. This overview of BMT/ND-GCN-based photocatalytic systems aids researchers in acquiring a better understanding of the construction of suitable heterostructure nanocomposites for wastewater treatment in various aquatic systems.
2. Experimental section
2.1. Chemicals
Cobalt acetate tetrahydrate (Co(OCOCH3)2·4H2O, 98%), nickel acetate tetrahydrate (Ni(OCOCH3)2·4H2O, 99.9%), zinc nitrate hexahydrate, (Zn(NO3)2·6H2O, 99%), cobalt nitrate hexahydrate (Co(NO3)2·6H2O, 99%), sodium tungstate dihydrate (Na2WO4·2H2O, 99%), melamine (C3H6N6, ≥99.5%), and ethanol (C2H6O ≥ 99.9%) were purchased at Sigma-Aldrich. Rhodamine-B (C28H31ClN2O3) was acquired from SRL chemicals. Without additional purification, all compounds were utilized as received. A millipore system was utilized to clean the deionized water (DI H2O) utilized in all the experiments.2.2. Synthesis of bulk GCN
A straightforward thermal polycondensation method for melamine was utilized to prepare the bulk-GCN nanosheets. In this process, a closed silica crucible holding 5 g of melamine was heated inside a muffle furnace for 4 h at around 550 °C. A yellow powder was obtained by grinding the precipitate using a mortar and pestle after being allowed to reach room temperature.2.3. Synthesis of nitrogen-deficient GCN
The facile polycondensation process was used to synthesize the N-deficient GCN. Initially, 4 g of melamine was dispersed in 30 mL of DI H2O, agitated for 30 min in a hot plate magnetic stirrer at 30 °C, and finally dried for 8 h at 80 °C. After that, the substance was uniformly ground in an agate mortar to yield a powdery modified precursor. Additionally, a muffle furnace was used to heat the water-treated precursor to 550 °C and retain it there for 4 h at a 2 °C min−1 heating rate. The desired yellow powder is the target product. N-Deficient GCN is achieved after being naturally cooled to ambient temperature and taken out to uniformly ground once again. Then, the obtained N-deficient GCN sample was labeled ND-GCN.2.4. Synthesis of NiCoWO4 and CoZnWO4 nanoparticles
A wet chemical approach was used to synthesize the mixture of Ni and Co BMTs. 1.8 g of nickel acetate was blended with 50 mL of DI H2O, and the mixture was agitated for 15 min to produce a homogeneous solution. In this instance, the mixture was labeled A. In a second beaker, 50 mL of DI H2O was blended with 0.6 g of cobalt acetate for 15 min, and the solution was labeled B. Similarly, 0.1 M Na2WO4 was blended with 100 mL of DI H2O and then agitated for 30 min; the mixture was labeled C. Finally, a drop-wise blending of solutions A and B into solution C occurred simultaneously. Under magnetic stirring conditions, the resulting solution was maintained for 6 h. Then, the solution was centrifuged and dried. The resulting material was separated and calcined for 4 h at 600 °C with a 2 °C min−1 temperature ramping rate. NiCoWO4 (NCW-NPs) was recognized as the final product.28 For the synthesis of CoZnWO4 (CZW-NPs), the same experimental approach was employed using 1.8 g of cobalt nitrate, 0.6 g of zinc nitrate, and 0.1 M Na2WO4 as the precursor materials.2.5. Synthesis of NCW/ND-GCN and CZW/ND-GCN nanocomposites
To synthesize NCW/ND-GCN nanocomposite, ND-GCN and NCW were blended in a 1![[thin space (1/6-em)]](https://www.rsc.org/images/entities/char_2009.gif) :1 ratio and ground for 45 min using a mortar and pestle. The blended powder was put in a 100 mL beaker with 30 mL of ethanol and ultrasonically treated for 1 h at room temperature. To produce NCW/ND-GCN heterojunction, the suspension was centrifuged, cleansed with ethanol, and dried at 80 °C for 12 h. A similar procedure was utilized to fabricate CZW/ND-GCN heterojunction.
:1 ratio and ground for 45 min using a mortar and pestle. The blended powder was put in a 100 mL beaker with 30 mL of ethanol and ultrasonically treated for 1 h at room temperature. To produce NCW/ND-GCN heterojunction, the suspension was centrifuged, cleansed with ethanol, and dried at 80 °C for 12 h. A similar procedure was utilized to fabricate CZW/ND-GCN heterojunction.
2.6. Physicochemical characterizations
By employing a PAN analytical X'pert pro-X-ray diffractometer with Cu-Kα radiation (λ = 1.54 Å), the X-ray diffraction (XRD) patterns were obtained. A Fourier-transform infrared spectrometer (FTIR) was performed using the IRTracer-100-Shimadzu. The UV-Vis diffused reflectance spectra (UV-DRS) were generated utilizing a Shimadzu UV-3600i Plus spectrophotometer. A fluorescence spectrophotometer (Horiba, Fluorolog-QM) was utilized to record the photoluminescence (PL) spectra. PHI VersaProbe III Scanning XPS Microprobe was employed to obtain the X-ray photoelectron spectroscopy (XPS) spectra. All spectra were adjusted utilizing the standard C 1s peak at 284.6 eV. High-resolution transmission electron microscopy (HR-TEM, JEOL Japan, JEM-2100 Plus) and Energy Dispersive X-Ray Analysis (EDX, FEI Quanta FEG 200) were used to examine the surface morphological characteristics, crystalline state data, and chemical compositions. Nyquist plots of electrochemical impedance spectroscopy (EIS) were generated between 300 kHz and 100 mHz at a voltage of 1 V. The Mott–Schottky measurements were performed at a frequency of 500 Hz and 5 mV amplitude on an Autolab 302 N electrochemical workstation equipped with a three-electrode setup in 0.1 M Na2SO4 solution. In this study, the glassy carbon (GC) electrode coated with the synthesized photocatalysts functioned as the working electrode, Pt wire was employed as the counter electrode, and Ag/AgCl electrode was utilized as the reference electrode. The efficiency of photocatalysis in visible light was measured using a 500 W Xe lamp emitting radiation at 420 nm.2.7. Assessment of photocatalysis performance
To measure the photocatalysis performance of the samples, the degradations of AZI and TC antibiotics as model pollutants were examined. This was accomplished by first dissolving 40 mg of the photocatalyst in 50 mL of an antibiotic solution (a concentration of 15 ppm). By stirring in the dark for 15 min, the equilibrium between the adsorption and desorption of suspensions was established.29 A visible light source was then flashed at the reaction mixture. At a predetermined period of 15 min, the 3 mL suspension of the AZI and TC solutions was removed to examine their concentrations and filtered through a 0.45 μm millipore filter to separate the photocatalyst. The concentrations of the filtered suspensions were examined using a UV-Vis spectrophotometer at distinctive absorption peaks of 282 nm for AZI, 274 nm, and 357 nm for TC. The photocatalyst was separated from the leftover impurity using centrifugation.2.8. Real pharmaceutical effluent treatment
Pharmaceutical wastewater was collected from the disposal drains of the pharmaceutical formulation industry located in Alathur (Chengalpattu, Tamilnadu, India). Samples of the pharmaceutical wastewater were stored in plastic bottles and delivered right away to the lab for processing. Initially, 70 mL of pharmaceutical effluent was exposed to visible light without the catalyst. Our preliminary results showed that pharmaceutical wastewater did not initially change. Thus, it was determined that there was no self-degradation of the pharmaceutical wastewater. The performance of NCW/ND-GCN and CZW/ND-GCN for pharmaceutical wastewater degradation was then investigated without dilution as a batch experiment in a 100 mL beaker carrying 70 mL of effluent, and each photocatalyst was weighed at 50 mg. The adsorption–desorption equilibrium condition was established by stirring the pollutant solution for 15 min in the dark. Following this, suspensions underwent 90 min of vigorous shaking under visible light. Furthermore, the stability of the photocatalyst was estimated in the recycling tests by analyzing the removal of pharmaceutical impurities after five consecutive cycles of testing. Using a TOC-L analyzer (Shimadzu), total organic carbon (TOC) was evaluated. During the photocatalysis reaction, radical scavenger chemicals, such as 1,4-benzoquinone (BQ), ethylenediaminetetraacetic acid (EDTA), and isopropyl alcohol (IPA), were used to determine which oxidative species were the most reactive (ROSs).3. Results and discussion
3.1. Evaluation of structural and optical properties
To investigate the crystal structure, size, and purity of the samples and to assess the structural disorder, powder XRD measurements were performed. The XRD diffraction patterns of the synthesized ND-GCN, NCW, CZW, NCW/ND-GCN, and CZW/ND-GCN nanomaterials are illustrated in Fig. 1. Except for the ND-GCN material, all the nanomaterials were assigned to the monoclinic crystal phase, which has a wolframite structure and crystal symmetry of P2/c space group.30 The prepared samples have good crystallinity, as evidenced by the sharpness of the diffraction peaks and clear patterns. The diffraction peaks were in excellent agreement with JCPDS No. 15-0755, 15-0867, and 15-0774 corresponding to CoWO4, NiWO4, and ZnWO4. Two distinct peaks in ND-GCN can be found at 2θ = 13° and 27.6°, which are attributed to the crystal planes of the graphitic material (100) and (002), respectively,31 and the XRD diffraction pattern of bulk-GCN is provided in the ESI† (Fig. S1). The XRD patterns of NCW/ND-GCN and CZW/ND-GCN verified a strong interaction between the BMT nanoparticles and ND-GCN. The absence of any other peaks in the spectra demonstrated the purity of the materials, and the findings revealed the flawless fabrication of the hybrid heterostructure. Table S1 (ESI†) shows the lattice parameters and crystallite size of the NCW, CZW, NCW/ND-GCN, and CZW/ND-GCN samples. The lattice parameter (a, b, and c) values can be extracted from the phase file using X-pert software. The crystallite sizes were predicted by applying the Debye–Scherrer formula. Crystal size (D) = 0.9λ/β![[thin space (1/6-em)]](https://www.rsc.org/images/entities/i_char_2009.gif) cosθ, where the X-ray wavelength λ is 1.54178 Å, β is full width at half maximum (FWHM) of the diffraction peak, and θ is the diffraction angle.
cosθ, where the X-ray wavelength λ is 1.54178 Å, β is full width at half maximum (FWHM) of the diffraction peak, and θ is the diffraction angle.
 | ||
| Fig. 1 PXRD spectra of NCW, NCW/ND-GCN, CZW, CZW/ND-GCN and ND-GCN. | ||
The FTIR spectra measured for the synthesized ND-GCN, NCW, CZW, NCW/ND-GCN, and CZW/ND-GCN materials are depicted as a single graph, as shown in Fig. 2a. The signals across the wavenumbers in the range of 3650–3100 cm−1 are attributed to the O–H stretch of H2O molecules and the stretching vibrations of the N–H groups existing in samples. In the ND-GCN sample, C–N heterocyclic rings are responsible for the absorption band around 1200–165 cm−1. The FTIR spectra of NCW, CZW, NCW/ND-GCN, and CZW/ND-GCN nanocomposites showed adsorption bands around 850–760 cm−1 except for ND-GCN, and these bands were recognized with the symmetric stretching vibration of W–O–W bonds in deformed octahedral [WO6] structure.32 The bands at the range of 955–940 cm−1 were connected to the symmetric stretching states of such a W![[double bond, length as m-dash]](https://www.rsc.org/images/entities/char_e001.gif) O terminal bond that is found within every octahedron of WO3. The detected band at 525–518 cm−1 was caused by the asymmetric stretching of O–W–O–W–O distorted octahedral [WO6]–[WO6] in the nanocomposites.33 The Ni–O, Co–O and Zn–O bond vibrations were the cause of the active mode at 418–438 cm−1. Consequently, the FTIR data confirm the effective incorporation of NCW and CZW nanoparticles into ND-GCN nanosheets.
O terminal bond that is found within every octahedron of WO3. The detected band at 525–518 cm−1 was caused by the asymmetric stretching of O–W–O–W–O distorted octahedral [WO6]–[WO6] in the nanocomposites.33 The Ni–O, Co–O and Zn–O bond vibrations were the cause of the active mode at 418–438 cm−1. Consequently, the FTIR data confirm the effective incorporation of NCW and CZW nanoparticles into ND-GCN nanosheets.
 | ||
| Fig. 2 (a) FTIR spectra; (b) PL spectra; (c) UV-Vis diffuse reflectance spectra; and (d) Tauc plot of ND-GCN, CZW, CZW/ND-GCN, NCW, and NCW/ND-GCN. | ||
To examine the recombination of photogenerated charges at the interface and charge separation and transfer of the produced heterojunction catalysts, PL analysis was carried out. Using an excitation wavelength of 360 nm, PL spectra were observed. Fig. 2b depicts the PL spectrum of CZW/ND-GCN < NCW/ND-GCN < CZW < NCW exhibited a relatively weak emission peak than ND-GCN. A sharper intrinsic photoemission spectrum at 460 nm, which correlates with the optical band gap of ND-GCN, suggests the occurrence of the n–π* state. According to e−–h+ recombination, the band-to-band transition that takes place during photo-generation activity is the process responsible for the PL emission peak. It is important to highlight that the PL intensity of NCW/ND-GCN and CZW/ND-GCN is noticeably reduced, indicating hindered electron–hole pair recombination and a quicker charge transfer process by the quantum confinement effect. This made it easier for the charges to be transferred between the ND-GCN and BMT nanoparticles, resulting in better photocatalysis performance. This agrees with recently published work on a similar Z-scheme photocatalyst used to degrade organic contaminants.34,35
Utilizing diffuse mode UV-vis reflectance spectroscopy, the optical characteristics of the materials were investigated. Fig. 2c displays the absorbance spectra for each synthesized material in the 200–800 nm wavelength range. The absorption band observed at 412 nm in ND-GCN was associated with the n–π* transition of the lone pair electrons of deficient nitrogen atoms present in ND-GCN. The nanostructures NCW, CZW, NCW/ND-GCN, and CZW/ND-GCN displayed outstanding UV absorption ranging from 200 to 400 nm, with the shoulder peak emerging between 500 and 650 nm. The primary cause of the absorption band at 580 nm is the transfer of an electron from 3A2g to 1Eg (d–d transition). More specifically, this peak, which appeared in the visible region, revealed the charge transfer of an oxygen 2p atom to one of the empty 5d orbitals of tungsten. The appearance of absorption in the UV region is mostly caused by excitation from O2p to Wt2g in the WO42− group.36 The electron transition in nanocrystals experiences substantial quantum confinement because of the small crystal size, so broad absorption occurred in the range of 200–400 nm. The Kubelka–Munk function was plotted against photon energy (hν), and a Tauc plot was built. The bandgap (Eg) of the material is provided by the intercept of the Tauc plot generated between (αhν)2vs. hν, as displayed in Fig. 2d. The calculated Eg values for ND-GCN were 2.80 eV. For NCW and CZW, a substantially lower value (2.23 eV and 2.15 eV) was determined, showing efficiency in the formation of photoinduced charges following visible light absorption. The discovered Eg values for the NCW/ND-GCN and CZW/ND-GCN nanocomposite heterojunctions are 2.06 eV and 1.96 eV, respectively.
To identify the composition and nature of the elements present in NCW/ND-GCN and CZW/ND-GCN nanocomposites, XPS was carried out and deconvoluted by utilizing Gaussian functions. The survey spectrum depicted in Fig. 3a shows the emergence of Ni, Co, Zn, O, W, C, and N elements in the NCW/ND-GCN and CZW/ND-GCN nanocomposite materials. The compositions of the elements present in NCW/ND-GCN nanocomposite are measured to be C (34.08), N (10.48), Ni (6.91), Co (5.10), W (25.47) and O (17.96). Similarly, the elemental composition of CZW/ND-GCN nanocomposite is measured to be C (27.84), N (10.94), Co (8.20), Zn (4.68), W (28.97), and O (19.37). The elemental analysis from the XPS results was in accordance with the EDX spectrum.
 | ||
| Fig. 3 XPS spectrum of NCW/ND-GCN and CZW/ND-GCN nanocomposites (a) survey spectrum; (b) C 1s; (c) N 1s; (d) Ni 2p; (e) Co 4p; (f) Zn 2p; (g) W 4f; and (h) O 1s. | ||
Fig. 3b illustrates the XPS spectrum of C 1s present in NCW/ND-GCN and CZW/ND-GCN nanocomposite materials. Herein, the fitted two peaks with binding energy values of 284.7 2 eV and 288.64 eV for NCW/ND-GCN relate to the sp2 hybridized carbon and graphitic carbon of ND-GCN.37 For CZW/ND-GCN, the C 1s spectrum displays two peaks at 284.86 eV and 288.58 eV. As shown in Fig. 3c, the N 1s of NCW/ND-GCN demonstrate that the peaks centered at 398.87, 400.01, and 401.38 eV were related to the sp2 hybridized triazine rings (CN–C), amino groups (N–H), and primary amine (C–NH2), respectively.38 Similarly, in CZW/ND-GCN, the peaks placed at 398.45, 399.86, and 401.36 eV correspond to the above functional groups. N 1s peak fitting was also used to determine the chemical composition of ND-GCN, and the outcomes are presented in Table S2 (ESI†). Terminal amino functional groups N–H and sp2-hybridized aromatic nitrogen attached to carbon atoms (CN–C) are both significantly reduced in ND-GCN compared to GCN.39 The loss of bridging sp2 nitrogen atoms and terminal amino groups was shown to be the primary cause of the N defects in ND-GCN, as seen by the distribution of N 1s binding energy. We can conclude that the nitrogen defects in ND-GCN nanosheets were established by comparing the EDX elemental analysis of ND-GCN and bare-GCN; their C/N atomic ratios were 0.908 and 0.66, respectively. This study provides more evidence of which N defects exist in ND-GCN.
Fig. 3d shows that the binding energy values are observed at 856.49 and 874.28 eV designated to Ni 2p3/2 and Ni 2p1/2, respectively. The related satellite peaks occurred at 862.02 and 880.12 eV, which closely match the recently published data, respectively. Fig. 3e depicts the XPS spectra of the Co 2p element present in both nanocomposites. For NCW/ND-GCN nanocomposite, the Co 2p spectra show the set of a doublet at 781.70 and 797.48 eV associated with Co 2p3/2 and Co 2p1/2 as the response of the adsorbed surface hydroxide species and cobalt salts, respectively, and also caused two satellite peaks to be seen at 785.39 and 803.57 eV, respectively. Similarly, CZW/ND-GCN containing two types of peaks around 781.82 and 797.63 eV could be specified as Co 2p3/2 and Co 2p1/2, respectively, and the satellite peaks were observed around 786.12 and 803.46 eV, respectively. The binding energies of Co 2p and Ni 2p agree with the information covered in earlier research, wherein the authors asserted that these elements existed in the +2-oxidation state.40Fig. 3f shows the two distinct peaks around 1021.87 and 1044.96 eV, corresponding to the spin–orbit splitting of 23.09 eV between the Zn 2p3/2 and Zn 2p1/2 energy states to estimate the divalent oxidation state of Zn.41Fig. 3g depicts the core level spectrum of W 4f for NCW/ND-GCN, which was deconvoluted into two types of peaks. W 4f7/2 was the cause of the first peak measured at 35.47 eV. Hence, the second peak was observed at 37.61 eV related to W 4f3/2. Similarly, CZW/ND-GCN nanocomposite shows two distinct peaks around 35.52 eV and 37.63 eV specified to W 4f7/2 and W 4f3/2 energy levels, respectively.42 According to Fig. 3h, the O 1s spectrum of NCW/ND-GCN composite was fitted into two peaks by employing the binding energies of 530.96 and 532.5 eV, respectively. The oxygen of the H2O molecule bound at the surface of the catalyst is attributed to a peak with low binding energy. Similarly, CZW/ND-GCN has two peaks at around 530.83 and 532.47 eV. Therefore, the XPS results show that the nanocomposites of NCW/ND-GCN and CZW/ND-GCN were successfully formed.
3.2. Morphological characteristics and textural properties
The detailed morphological study was carried out by TEM studies; the TEM micrographs of ND-GCN, NCW, CZW, NCW/ND-GCN, and CZW/ND-GCN nanomaterials are illustrated in Fig. 4a–e. Fig. 4a depicts the sheet-like morphology of ND-GCN and shows the wrinkles on the ND-GCN nanosheets. Fig. 4b makes it evident that as-fabricated NCW possesses a nanoflakes-like appearance, and CZW is composed of a nano-sized homogeneous nanobrick-like morphology, as depicted in Fig. 4d. Interestingly, the close contact between the BMT nanoparticles and ND-GCN is verified by the TEM pictures, as evidenced in Fig. 4c and e. As can be observed in Fig. 4c, the TEM image of NCW/ND-GCN reveals that the material maintains both nanoflakes and nanosheets, which is evidence that the composite material has formed. Similarly, Fig. 4e reveals that the CZW nano bricks are observed to be attached to the ND-GCN nanosheets and that interaction could aid in the separation of photo-generated charge carriers during the photocatalysis process.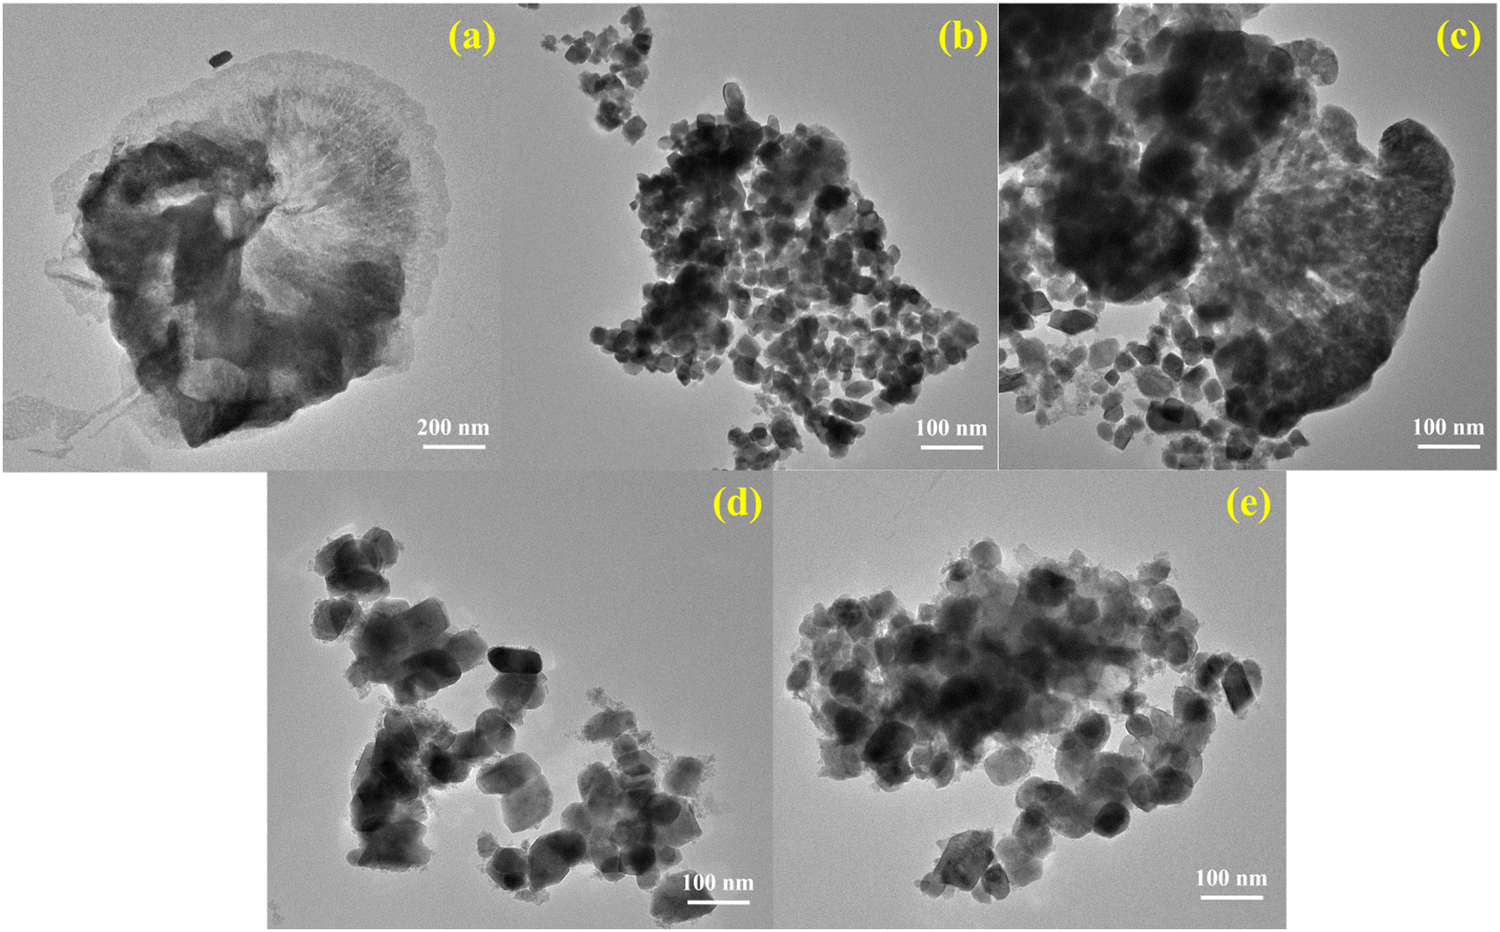 | ||
| Fig. 4 TEM images of the as-synthesized (a) ND-GCN; (b) NCW; (c) NCW/ND-GCN; (d) CZW; and (e) CZW/ND-GCN nanocomposite. | ||
High-resolution TEM studies of NCW/ND-GCN and CZW/ND-GCN nanocomposites showed both the crystalline and amorphous nature of the materials, as depicted in Fig. 5. As shown in Fig. 5a, d-spacing values of 0.28 nm and 0.17 nm were obtained from HRTEM for NCW/ND-GCN nanocomposite, which precisely matches the most intense line of XRD patterns. Similarly, Fig. 5b demonstrates that the d-spacing values of 0.26 nm and 0.38 nm matched the monoclinic crystal structure of the CZW/ND-GCN nanocomposite. The selected area electron diffraction (SAED) pattern of the NCW/ND-GCN and CZW/ND-GCN composites is depicted in Fig. 5c and d, which demonstrate the diffraction rings. Several bright spots were noticed, which indicates both the polycrystalline and amorphous nature of the material. These findings agree with the XRD diffraction patterns of the nanocomposites.
 | ||
| Fig. 5 HRTEM images and SAED pattern of (a) and (c) NCW/ND-GCN; (b) and (d) CZW/ND-GCN nanocomposites. | ||
Energy dispersive X-ray spectroscopy (EDX) on the SEM can be utilized to determine the existence of elements and their corresponding elemental compositions in bulk-GCN, ND-GCN, NCW, and CZW as well as in composite materials. The spectra are displayed in Fig. S2 and S3 (ESI†). The EDX elemental contents of bulk-GCN and ND-GCN are listed in Table S3 (ESI†). For the C/N atomic ratio of bulk-GCN, as depicted in Fig. S2a (ESI†), the elemental analysis of ND-GCN shown in Fig. S2b (ESI†) demonstrates that the presence of nitrogen vacancies causes the C/N atomic ratio to increase. Fig. S3a and b (ESI†) depict the presence of Ni, Co, Zn, O, and W elements attributed to NCW and CZW. It can be observed that C (35.27%), N (10.8%), Ni (7.31%), Co (4.9%), W (24.76%), and O (16.96%) peaks appeared in the EDX spectrum of NCW/ND-GCN, as displayed in Fig. S3c (ESI†). Similarly, the EDX spectrum of CZW/ND-GCN nanocomposite, as represented in Fig. S3d (ESI†), reveals the presence of C (28.84%), N (9.41%), Co (8.9%), Zn (3.81%), W (31.09%) and O (17.95%) elements. The atomic ratios of the nanocomposites produced and the absence of an impurity peak in the EDX spectra indicate the purity and successful formation of the heterojunction. In addition, the SEM-mapping images displayed in Fig. S4 and S5 (ESI†) demonstrate the presence of all constituent elements (i.e., C, N, Ni, Co, W, and O) in the NCW/ND-GCN composite and the C, N, Co, Zn, W, and O elements present in the CZW/ND-GCN nanocomposite.
To estimate the adsorption and degradation potential against organic contaminants, we performed the N2 adsorption–desorption measurements on the ND-GCN and the composites, employing liquid nitrogen adsorption–desorption isotherms.43 Brunauer–Emmett–Teller (BET) isotherm curves for ND-GCN, NCW/ND-GCN, and CZW/ND-GCN composites are shown in Fig. 6a–c, along with the associated pore-sized distribution determined using the BJH approach44 (Fig. 6d–f). The specific surface area and pore size distribution of all samples are shown in the figures. The CZW/ND-GCN composite was discovered to possess the largest surface area, 78.28 m2 g−1; the surface area of the ND-GCN was 21.08 m2 g−1 and that of NCW/ND-GCN was 56.26 m2 g−1. By combining BMT nanoparticles, ND-GCN nanosheets increase surface area. Furthermore, the ND-GCN and NCW/ND-GCN samples exhibit type IV with H3 hysteresis loops, while the CZW/ND-GCN nanocomposite exhibits type V with H2 hysteresis loops, as shown in Fig. 6c. However, the pore-size distributions of the fabricated samples demonstrate that the ND-GCN possessed a mesoporous structure, with a large pore size of 20.06 nm, and it became smaller while making a nanocomposite, i.e. NCW/ND-GCN = 13.52 nm and CZW/ND-GCN = 8.53 nm. This agrees with the distribution of BMT evenly across the ND-GCN sheet. The specific surface areas of the composites we developed in this study were larger than those reported in our earlier papers.45 Therefore, we believe that ND-GCN and its composites will more effectively degrade organic contaminants in visible light than has been previously reported.
 | ||
| Fig. 6 BET surface area analysis and pore size distribution curve of (a) and (d) ND-GCN; (b) and (e) NCW/ND-GCN; (c) and (f) CZW/ND-GCN nanocomposites. | ||
3.3. Electrochemical properties
To further test the electron transfer resistance, faster charge carrier transportation, and reaction mechanism of the prepared nanomaterials, electrochemical impedance spectra (EIS) were performed. The size of the Nyquist curve represents the reaction rate and resistance between the grains. A larger radius causes the electrode reaction rate to decrease. Smaller arc radii may indicate a faster interface electron transfer for improved photocatalytic performance.46 The EIS results of the ND-GCN, NCW, CZW, NCW/ND-GCN, and CZW/ND-GCN composites are shown in Fig. 7a. Because of the strong interaction between the BMTs and ND-GCN, the semicircular diameter of the composite was obviously less than that of the bare ND-GCN, NCW, and CZW. This reveals that the photo-generated charge can be successfully separated and the recombination of charges reduced. These findings were consistent and suggest that fabricating composites using CZW nanoparticles with ND-GCN significantly enhances the surface state and facilitates faster charge carrier transportation, which is beneficial for boosting photocatalytic performance. | ||
| Fig. 7 (a) EIS Nyquist plots of NCW, CZW, ND-GCN, NCW/ND-GCN, and CZW/ND-GCN nanocomposite; Mott–Schottky plots of (b) ND-GCN; (c) NCW; and (d) CZW. | ||
Generally, the edge potentials of the CB and VB of a semiconductor are crucial to the photocatalytic degradation reaction. CB and VB potentials for ND-GCN, NCW, and CZW nanomaterials were predicted using the Mulliken electronegativity theory and Mott Schottky investigations. The following formula can be used to obtain the Mulliken electronegativity (χ) of compound:47
| χ (XxYyZz) = (χ(X)xχ(Y)yχ(Z)z)1/(x+y+z), |
| EVB = χ − Ee + 0.5Eg, |
| ECB = EVB − Eg. |
In this equation, EVB and ECB depict the energies of the VB and CB, respectively; χ represents the absolute electronegativity of the photocatalyst (semiconductor); Ee represents the energy of free e− on the hydrogen scale (∼4.5 eV); and Eg represents the band gap of the photocatalyst. The results of the UV-DRS study reveal the Eg value of ND-GCN = 2.8 eV, NCW = 2.23 eV, and CZW = 2.15 eV. The χ values of ND-GCN = 4.73,50 NCW = 5.97, and CZW = 5.98 eV. The VB and CB values of ND-GCN, NCW, and CZW are estimated, as illustrated in Table S4 (ESI†), which agrees well with the previous calculations.
Moreover, Mott–Schottky's interpretation aided in identifying the flat band potentials (Efb) of ND-GCN, NCW, and CZW samples. The flat band potential of an n-type semiconductor equals its Fermi level is a well-known fact.51 Moreover, by extending the linear component of the Mott–Schottky curves, the semiconductors ND-GCN, NCW, and CZW have various Fermi levels, which are −1.77, −0.32, and −0.22 V vs. Ag/AgCl, as shown in Fig. 7b–d. Furthermore, all the analyzed samples have a positive slope on the M–S graphs, indicating n-type semiconductor characteristics. The following formula was used to determine the conduction band minimum (CBM):52
| Efb (NHE) = Efb(Ag/AgCl) + E(Ag/AgCl) + 0.059 pH, |
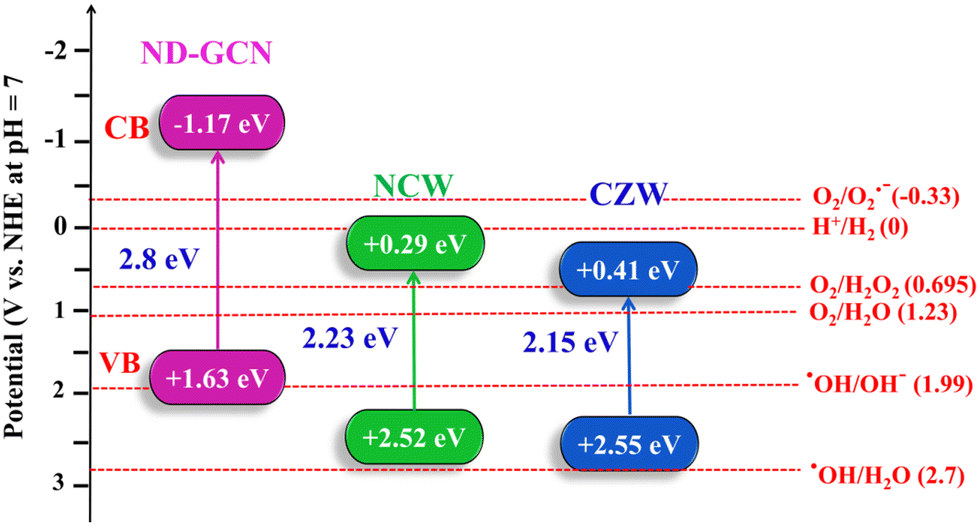 | ||
| Fig. 8 Based on the Mott–Schottky study the estimated band gap energies and band edge potentials and the detailed electronic band structures of the ND-GCN, NCW, and CZW. | ||
3.4. Performance assessment of photocatalysis
Initially, the photocatalysis performance of the fabricated bulk GCN, ND-GCN, NCW, CZW, NCW/ND-GCN, and CZW/ND-GCN samples was analyzed using degradation experiments performed for AZI and TC antibiotics as model organic contaminants under visible light exposure. To assess the adsorption–desorption equilibrium of the antibiotic drugs on the surface of the photocatalyst, dark experiments were conducted. The suspensions were left in the dark with the photocatalysts for 15 min. Following this, 3 mL of the antibiotic solution was withdrawn to observe the adsorption rate and to record the UV-vis absorption spectra. The adsorption study demonstrated that degradation occurred mostly as a result of visible light irradiation. Visible light-induced self-degradation of AZI and TC is carried out without photocatalyst using identical experimental conditions. The photocatalytic degradation performance of AZI and TC antibiotics is just 3–5% owing to the selfpyrolyzation. The photolysis and adsorption procedures demonstrated that organic contaminants degraded in the presence of light and photocatalysts. From Fig. S4 (ESI†), it can be determined that the binary nanocomposite photocatalysts possess higher degrading performance than bulk GCN, ND-GCN, NCW, and CZW nanoparticles under visible light exposure. The inclusion of an appropriate amount of NCW and CZW nanoparticles improved the photocatalysis performance of ND-GCN.In particular, the degradation performance of CZW/ND-GCN photocatalyst reached a degradation of 98.64% towards AZI and TC (98.17%), each at 40 mg/50 mL-dose, which was significantly higher than that of bulk-GCN (AZI-32.51% and TC-29.51%), ND-GCN (AZI-64.6% and TC-58.77%), NCW (AZI-37.89% and TC-41.12%), CZW (AZI-42.6% and TC-44.27%), and slightly higher than that of NCW/ND-GCN (AZI-91.19% and TC-96.31%) composite. The results revealed that NCW/ND-GCN and CZW/ND-GCN were the best photocatalysts, so they were employed in all subsequent photocatalysis tests. Fig. 9a–d depicts UV-vis spectra of AZI and TC antibiotic decompositions under visible light using the NCW/ND-GCN and CZW/ND-GCN optimized nanocomposites. The distinct absorption peaks of 282 nm for AZI, and 274 nm and 357 nm for TC were considered while calculating the dye concentrations. The AZI and TC antibiotic concentration plots in relation to the irradiation period and the kinetics of antibiotic degradation graphs are depicted in Fig. 10a–d. Fig. 10a and c demonstrate the decrease in AZI and TC antibiotic concentration (Ct/C0) owing to irradiation duration for NCW/ND-GCN and CZW/ND-GCN catalysts when subjected to photocatalysis. In the Ct/C0 plot, ‘Ct’ indicates the concentration of antibiotic after the catalysis process for period ‘t’, while C0 indicates the antibiotic's starting concentration. It was established from the AZI and TC antibiotic degradation plots that the CZW/ND-GCN composite catalyst exhibited the greatest degree of degradation rate among all photocatalyst materials. The synergistic impact between the ND-GCN nanosheets and NCW and CZW nanoparticles aids in capturing better light illumination and enhancing charge carrier separation, which was found to increase the degradation efficiency of the NCW/ND-GCN and CZW/ND-GCN photocatalyst.
 | ||
| Fig. 9 UV-Vis absorption spectrum of (a) and (b) AZI; (c) and (d) TC antibiotic degradation using NCW/ND-GCN and CZW/ND-GCN photocatalyst. | ||
 | ||
| Fig. 10 (a) and (c) Ct/C0 plots; (b) and (d) linear fit of photocatalytic degradation of AZI and TC antibiotics and (e) effect of solution pH on the degradation of AZI over as-synthesized NCW/ND-GCN and CZW/ND-GCN photocatalyst. | ||
The pseudo-first-order mechanism could be used to establish the antibiotic decomposition rates when they are subjected to visible light, and the value of “k” can be found by employing the following formula:
| −ln(Ct/C0) = kt, |
The effect of solution pH on the degradation of AZI antibiotics in NCW/ND-GCN and CZW/ND-GCN systems is shown in Fig. 10e. The solution pH condition is a critical factor that can affect the surface properties of NCW/ND-GCN and CZW/ND-GCN nanocomposites, as well as the concentration of hydroxyl radicals,54 the ionization state of AZI, and the formation of active radical species. It can be obtained in Fig. 10e that the Kapp of the photodegradation rate of AZI significantly increases from 0.0167 min−1 at pH 4.0 to 0.0528 min−1 at pH 7.0 for NCW/ND-GCN and 0.0179 min−1 at pH 4.0 to 0.0560 min−1 at pH 7.0 for CZW/ND-GCN and then decreases as the pH further increases from 7 to 10.0. Owing to synergism, a wide surface area, and restriction of the e−/h+ ion recombination, the best result for the degradation of the AZI antibiotic was evaluated at 15 ppm target strength, with a 40 mg catalyst with a dose pH ∼ 7. Additionally, at neutral pH, contaminants degrade to the greatest extent.
3.5. Introduction of Z-scheme NCW/ND-GCN and CZW/ND-GCN photocatalyst for the recovery of pharmaceutical effluent
The phosphates of ammonium chloride, aminophylline, methanol, and a particular salt of glycerophosphate are all components of pharmaceutical industry effluent. Organics and other antiseptics also contain chlorhexidine, permanganates, and quaternary ammonium compounds. Thus, the chemical oxygen demand (COD) level of the pharmaceutical industry's effluent ranges from 1600 to 7000 mg L−1 is allowed based on the newly available scientific evidence.55 This COD level indicates that the pharmaceutical effluent contains higher than average levels of organics, necessitating treatment before water release. The collected pharmaceutical effluent had an initial COD value of 5840 mg L−1. To minimize the COD of pharmaceutical effluent, the optimized Z-scheme NCW/ND-GCN and CZW/ND-GCN nanocomposite provided an efficient treatment under visible light irradiation. Within 90 min of the assessment, photocatalytic degradation caused a sizable quantity of degradation in the pharmaceutical effluent.Fig. 11a and b demonstrate the UV-vis spectra of the pharmaceutical effluent degradation rate of about 95.16% with the NCW/ND-GCN hybrid nanocomposite and 97.84% using CZW/ND-GCN composite in the emergence of visible light, and a TOC assessment was carried out to confirm the rate of degradation and to estimate the mineralization efficacy of the nanocomposite. The intermediate compounds produced during the decomposition of organic pollutants may be even more harmful than the original organic pollutants. To ensure a successful degradation process, a TOC study must be conducted. The average TOC removal efficiency and pharmaceutical wastewater degrading efficiency of the Z-scheme NCW/ND-GCN and CZW/ND-GCN photocatalyst under visible light (71.2% and 76.8%) are provided, as depicted in Fig. 11c. In the operation of photocatalysis after 90 min, the maximum of 80.07% COD reduction efficiency (5840 to 1164 mg L−1) was achieved for the CZW/ND-GCN and 78.49% COD reduction efficiency (5840 to 1256 mg L−1) was achieved for the NCW/ND-GCN. These findings from the TOC and COD analyses suggest that the synthesized CZW/ND-GCN nanocomposite is a more beneficial photocatalyst for the mineralization of organic contaminants than the NCW/ND-GCN nanocomposite.
 | ||
| Fig. 11 Photocatalytic pharmaceutical effluent degradation activity over the (a) NCW/ND-GCN; (b) CZW/ND-GCN photocatalyst; (c) pharma effluent degradation (%) and TOC removal efficiency. | ||
3.6. Identification of active radicals
The development of a Z-scheme nanocomposite and the decomposition of antibiotics requires the confirmation of the active radicals associated with these processes. The findings of the elemental trapping experiment on the degradation of pharmaceutical effluent using NCW/ND-GCN and CZW/ND-GCN photocatalysts are displayed in Fig. 12a. The potential energy of the CB and VB of the photocatalyst is intimately connected to the production of the active species. It was possible to measure the establishment of ˙O2−, h+, and ˙OH radicals during photocatalysis using several radical scavengers, such as BQ, EDTA, and IPA. It is observed from a straightforward correlation of the O2/˙O2− (−0.33 eV vs. NHE) and OH−/˙OH (+1.99 eV vs. NHE) standard redox potential vs. the CB and VB potential results of the ND-GCN, NCW, and CZW, as depicted in Fig. 7 (electronic band structure diagram). In accordance with the test for capturing free radicals, electrons at the CB of ND-GCN can reduce O2 to ˙O2− because the CB edge potential of ND-GCN (−1.17 eV vs. NHE) is more negative than the standard redox potential O2/˙O2− (−0.33 eV vs. NHE). Therefore, superoxide radicals are one of the active species. Subsequently, the electrons at the CB of NCW and CZW cannot reduce O2 to ˙O2− because the CB edge potential of NCW (+0.29 eV vs. NHE) and CZW (+0.41 eV vs. NHE) is more positive than the standard redox potential O2/˙O2− (−0.33 eV vs. NHE). However, the oxygen adsorption capacity on the surface of the nanocomposite can interact with two e− to produce H2O2. This is because the CB edge potential of NCW and CZW is more negative than the conventional redox potential O2/H2O2 (+0.685 eV vs. NHE). Then, H2O2 combines with one e− to make ˙OH, which has a strong oxidation property and takes part in the photocatalytic reaction. In addition, the VB potential of NCW (+2.52 eV vs. NHE) and CZW (+2.55 eV vs. NHE) is greater than the conventional redox potential of OH−/˙OH (+1.99 eV vs. NHE), indicating that the accumulated holes on the VB of NCW and CZW can oxidize OH− to create ˙OH. Scavenger experimental studies have shown that such assumptions are well supported. Based on the results of an elemental trapping experiment conducted with NCW/ND-GCN and CZW/ND-GCN photocatalysts, it was determined that the ˙O2− and ˙OH radicals are the primary active species in the degradation of antibiotics. As a result of adding EDTA, the antibiotic degradation efficiency was measured to be approximately 93.08% for NCW/ND-GCN and 95.13% for CZW/ND-GCN, proving that holes do not play a role in this degradation process. Introducing BQ and IPA lowered the degrading efficiency of the NCW/ND-GCN nanocomposite to 14.98% and 19.9%, respectively, while doing the same for the CZW/ND-GCN nanocomposite resulted in a decrease to 9.58% (BQ) and 15.18% (IPA). The radical trapping study shows that both ˙O2− and ˙OH are involved in the antibiotic photocatalytic degradation process. Furthermore, some of the reference articles containing ESR/EPR radical trapping experiments were compared with this study to further validate the presence of hydroxyl and superoxide radicals in the Z-scheme NCW/ND-GCN and CZW/ND-GCN composites.56 | ||
| Fig. 12 (a) Radical scavenger investigations for pharmaceutical effluent degradation; (b) recycle stability test; (c) and (d) XRD spectra before and after the photocatalysis reaction. | ||
The fact that g-C3N4 can clearly detect the signal of DMPO-˙O2 under visible light, as shown by Sher et al. (2021), suggests that O2˙ can be created and that it is an important component of the photocatalysis process. However, the characteristic peaks of DMPO-˙OH may be disregarded.57 The findings of this study provide more evidence that superoxide radicals are the primary species, whereas hydroxyl radicals are the secondary active species. It is demonstrated from this study that O2˙ and ˙OH have a synergistic effect during the photocatalytic degradation of antibiotics. The results of the ESR analysis from this research are similar to those of free radical trapping studies.
3.7. Recycle stability
Finally, to assess the stability and reusability of the fabricated NCW/ND-GCN and CZW/ND-GCN heterojunctions, five consecutive cycles of photocatalysis experiments were performed for the visible light photocatalysis of pharmaceutical effluent degradation. The findings are depicted in Fig. 12b. Following each catalytic cycle, the photocatalyst is collected through centrifugation and properly washed using DI H2O, and the recovered catalyst is reused in the next cycle. The photocatalytic degradation performance of NCW/ND-GCN and CZW/ND-GCN is 95.16% and 97.84% (1st run), 93.8% and 96.01% (2nd run), 92.59% and 95.51% (3rd run), 91.34% and 93.47% (4th run), and 90.09% and 91.3% (5th run) after 330 min of treatment with visible light, as shown in Fig. 12b. The findings suggest that the NCW/ND-GCN and CZW/ND-GCN heterojunctions are highly reusable, and the slightly reduced activity after five photocatalytic cycles is most likely due to the loss of a small amount of nanocomposite powder during filtering through a 0.45 μm millipore filter membrane. Furthermore, the XRD analysis of the NCW/ND-GCN and CZW/ND-GCN heterojunctions both before and after the photocatalysis proved that typical diffraction peaks of the nanocomposites were remarkably unchanged, as illustrated in Fig. 12c and d, indicating the stability of the photocatalyst under visible light. Therefore, NCW/ND-GCN and CZW/ND-GCN heterojunctions can function as effective heterogeneous photocatalysts with prospective applications in the detoxification of organic contaminants from wastewater.3.8. Exploration of the possible reaction mechanism
The interface charge transfer between the BMT nanoparticles and ND-GCN influences the photocatalysis performance of the nanocomposite photocatalyst. In accordance with the band structure of BMTs and ND-GCN, the mechanism of photocatalytic degradation of pharmaceutical effluent was proposed, as shown in Scheme 1. BMT nanoparticles and ND-GCN are two distinct effective visible light absorption centers used in the light-harvesting process. | ||
| Scheme 1 Deciphering the Z-scheme charge transfer and degradation mechanism using NCW/ND-GCN and CZW/ND-GCN photocatalyst. | ||
For the prepared nanocomposite, there are two possible methods for transferring charges. BMTs have a higher positive CB and VB than ND-GCN, which has a CB and VB of −1.17 eV and +1.63 eV, respectively. Based on the concept of energy band arrangement, the synthesized nanocomposites may have generated a typical type-II heterojunction (Scheme S1, ESI†). BMTs and ND-GCN both produce and separate e− and h+ in response to visible light irradiation. The photoinduced e− in the CB of ND-GCN migrated to the CB of the BMTs. The separation of e− and h+ would occur owing to the photogenerated hole in the VB of BMTs transferring to the VB of ND-GCN. Because the reduction potential of O2/˙O2− (−0.33 eV vs. NHE) is lower than the CB potential of BMTs, the electrons on the CB of these materials could not reduce O2 to form ˙O2−. Additionally, the VB potential of ND-GCN is more negative than the oxidation potential of OH−/˙OH (+1.99 eV vs. NHE). Therefore, the h+ accumulated in the VB of the ND-GCN could not oxidize OH− to form ˙OH. The radical trapping experiment and these theoretical findings did not correlate, so typical type-II heterojunction formation is not possible in this case.
Hence, the charge transfer method used by photogenerated carriers in NCW/ND-GCN and CZW/ND-GCN may differ from the transfer strategy used by photogenerated carriers in a normal type-II heterojunction. The electron and hole transport pathways in NCW/ND-GCN and CZW/ND-GCN support the direct Z-scheme mechanism (Scheme 1). The photogenerated electrons deposited on the CB of BMTs are transported when NCW/ND-GCN and CZW/ND-GCN are exposed to visible light. The transferred electron recombines with the hole in the VB of ND-GCN. The effective separation of e− and h+ pairs is encouraged by this process. In ND-g-C3N4, the photo-induced e− was deposited in the CB, while in BMTs, h+ was accumulated in the VB. O2 can be reduced to ˙O2− in the CB of ND-GCN by photogenerated electrons because the CB value of ND-GCN (−1.16 eV) is more negative than that of O2/˙O2− (−0.33 eV vs. NHE). Because the VB potential of BMTs was greater than that of OH−/˙OH (+1.99 eV vs. NHE), the hole in the VB of BMTs might stimulate OH− to produce ˙OH and then oxidize organic contaminants. The test reports from experiments on radical trapping agree with the findings and analyses presented above. In conclusion, the charge transport mechanism of the Z-scheme heterojunction supports the photocatalytic response of the NCW/ND-GCN and CZW/ND-GCN composite photocatalysts. Therefore, the following three factors can be used to interpret the remarkable improvement in photocatalytic performance: (i) increased specific surface area, improved visible light absorption potential, and great photocatalytic consistency; (ii) noticeably increasing photocurrent responsiveness, decreasing interface transfer resistance, and increasing charge carrier density; and (iii) the active separation and transition of photoexcited e− and h+ aid from the development of a Z-scheme system between BMT nanoparticles and ND-GCN.
Table S5 (ESI†) shows the photocatalysis performance efficiency achieved using ND-GCN and metallic tungstate photocatalyst samples that have previously been published. For comparison, the results of the present research findings are provided. The outcomes show that our photocatalyst operates remarkably well compared to existing catalysts, especially in visible light. Owing to the simple control synthesis strategies, the novelty of the photocatalyst and the affordability of raw materials are motivations for conducting future research for real-world applications.
4. Conclusions
In conclusion, we successfully fabricated the NCW/ND-GCN and CZW/ND-GCN nanocomposite with a Z-scheme heterostructure using a facile polycondensation and wet chemical approach. The TEM investigation revealed that the NCW, CZW, and ND-GCN produced nanoflakes, nanobricks, and nanosheets that resembled the morphology of a heterojunction photocatalyst. EIS and Mott–Schottky studies indicate that the synthesized Z-scheme heterojunctions feature great separation efficiency of photogenic carriers. The degradation impact of AZI and TC antibiotics using the NCW/ND-GCN and CZW/ND-GCN nanocomposites increased by 40–50% compared to bulk GCN, ND-GCN, NCW, and CZW. The Z-scheme heterojunction charge transfer mechanism supports the potential to separate photogenerated charge carriers. Furthermore, when exposed to visible light, the optimized CZW/ND-GCN nanocomposite demonstrated the highest efficiency of pharmaceutical effluent degradation, achieving approximately 97.84% within 90 min. The radical scavengers experiment revealed that ˙O2− and ˙OH were the main active radical species in the degradation of pharmaceutical effluent. Recycling experiments demonstrate that NCW/ND-GCN and CZW/ND-GCN possess outstanding reusability and stability. Consequently, this research provides a new glance at the systematic design of Z-scheme NCW/ND-GCN and CZW/ND-GCN photocatalysts with efficient charge separation for the treatment of environmental water contaminants.Author contributions
H. Leelavathi: conceptualization, software, investigation, methodology, writing – original draft. R. Muralidharan: formal analysis, validation, writing – review & editing. N. Abirami: validation. R. Arulmozhi: conceptualization, writing – review & editing, supervision.Conflicts of interest
The authors declare that they have no known competing financial interests or personal relationships that could have influenced the work reported in this paper.Acknowledgements
The authors acknowledge the financial support through the University Fellowship Scheme from the Department of Chemistry, SRM Institute of Science and Technology, Tamil Nadu-603 203, India and we acknowledge the Nanotechnology Research Centre (NRC), SRMIST for providing the research facilities.References
- Q. Shi, Y. Zhang, D. Sun, S. Zhang, T. Tang, X. Zhang and S. Cao, Inorg. Chem., 2020, 59, 18131–18140 CrossRef CAS PubMed.
- I. Mukherjee, V. Cilamkoti and R. K. Dutta, ACS Appl. Nano Mater., 2021, 4, 7686–7697 CrossRef CAS.
- F. Rong, Q. Lu, H. Mai, D. Chen and R. A. Caruso, ACS Appl. Mater. Interfaces, 2021, 13, 21138–21148 CrossRef CAS PubMed.
- M. E. Mahmoud, M. F. Amira, S. M. Seleim and A. K. Mohamed, J. Chem. Eng. Data, 2020, 65, 3546–3559 CrossRef CAS.
- F. K. Naqvi, M. Faraz, S. Beg and N. Khare, ACS Omega, 2018, 3, 11300–11306 CrossRef CAS PubMed.
- S. Li, C. Wang, Y. Liu, B. Xue, W. Jiang, Y. Liu, L. Mo and X. Chen, Chem. Eng. J., 2021, 415, 128991 CrossRef CAS.
- S. Sankeetha, R. Muralidharan, N. Abirami, H. Leelavathi, S. Tamizharasan, A. Kumarasamy and R. Arulmozhi, Ceram. Int., 2022, 1–14 Search PubMed.
- Y. Qian, F. Zhang and H. Pang, Adv. Funct. Mater., 2021, 31, 1–34 Search PubMed.
- G. Prasannamedha and P. S. Kumar, J. Cleaner Prod., 2020, 250, 01–47 CrossRef.
- F. M. Mpatani, A. A. Aryee, A. N. Kani, R. Han, Z. Li, E. Dovi and L. Qu, J. Cleaner Prod., 2021, 308, 127359 CrossRef CAS.
- N. Gowriboy, R. Kalaivizhi, M. R. Ganesh and K. A. Aswathy, J. Cleaner Prod., 2022, 377, 134399 CrossRef CAS.
- P. Suyana, P. Ganguly, B. N. Nair, S. C. Pillai and U. S. Hareesh, Chem. Eng. J. Adv., 2021, 8, 100148 CrossRef CAS.
- Y. Zhu, W. Wang, J. Ni and B. Hu, Chemosphere, 2020, 246, 125753 CrossRef CAS PubMed.
- O. K. Mmelesi, N. Masunga, A. Kuvarega, T. T. Nkambule, B. B. Mamba and K. K. Kefeni, Mater. Sci. Semicond. Process., 2021, 123, 105523 CrossRef CAS.
- H. Jindal, D. Kumar, M. Sillanpaa and M. Nemiwal, Inorg. Chem. Commun., 2021, 131, 108786 CrossRef CAS.
- I. H. Ifijen, M. Maliki and B. Anegbe, OpenNano, 2022, 8, 100082 CrossRef.
- X. Wei, H. Liu, T. Li, Z. Jiang, W. Hu, Q. Niu and J. Chen, J. Photochem. Photobiol., A, 2020, 390, 112342 CrossRef CAS.
- S. Wang, T. Zhao, Y. Tian, L. Yan and Z. Su, New J. Chem., 2021, 45, 11474–11480 RSC.
- Y. L. Wei, B. Rong, X. Chen, Y. Y. Ding, Y. F. Huang, L. Q. Fan and J. H. Wu, Sep. Purif. Technol., 2021, 256, 117815 CrossRef CAS.
- Z. Du, L. Feng, Z. Guo, T. Yan, Q. Hu, J. Lin, Y. Huang, C. Tang and Y. Fang, J. Colloid Interface Sci., 2021, 589, 545–555 CrossRef CAS PubMed.
- M. Bilal Tahir, K. Nadeem Riaz and A. M. Asiri, Int. J. Energy Res., 2019, 43, 5747–5758 CrossRef CAS.
- N. Kangkun, N. Kiama, N. Saito and C. Ponchio, Optik, 2019, 198, 163235 CrossRef CAS.
- L. Xu, J. Zeng, Q. Li, L. Xia, X. Luo, Z. Ma, B. Peng, S. X. Xiong, Z. Li, L. L. Wang and Y. Lei, Appl. Surf. Sci., 2021, 547, 149207 CrossRef CAS.
- D. S. Pattanayak, D. Pal, J. Mishra, C. Thakur and K. L. Wasewar, Environ. Sci. Pollut. Res., 2022, 01–08 Search PubMed.
- S. Zhang, C. Hu, H. Ji, L. Zhang and F. Li, Appl. Surf. Sci., 2019, 478, 304–312 CrossRef CAS.
- N. Sun, X. Wen, Y. Tan, C. Yan and H. Wang, Appl. Surf. Sci., 2019, 470, 724–732 CrossRef CAS.
- C. Q. Xu and W. De Zhang, Mol. Catal., 2018, 453, 85–92 CrossRef CAS.
- A. S. Rajpurohit, N. S. Punde, C. R. Rawool and A. K. Srivastava, Chem. Eng. J., 2019, 371, 679–692 CrossRef CAS.
- N. Mahendran, S. Udayakumar and K. Praveen, New J. Chem., 2019, 43, 17241–17250 RSC.
- Y. L. Oliveira, M. J. S. Costa, A. C. S. Jucá, L. K. R. Silva, E. Longo, N. S. Arul and L. S. Cavalcante, J. Mol. Struct., 2020, 1221, 128774 CrossRef CAS.
- X. Yang, L. Zhang, D. Wang, Q. Zhang, J. Zeng and R. Zhang, RSC Adv., 2021, 11, 30503–30509 RSC.
- E. Dhandapani, S. Prabhu, N. Duraisamy and R. Ramesh, J. Mater. Sci.: Mater. Electron., 2022, 33, 8446–8459 CrossRef CAS.
- A. Azzouzi, M. Benchikhi and R. El Ouatib, Ceram. Int., 2020, 46, 23706–23718 CrossRef CAS.
- P. Gupta and N. Verma, Chem. Eng. J., 2022, 446, 137029 CrossRef CAS.
- N. T. T. Truc, D. S. Duc, D. Van Thuan, T. Al Tahtamouni, T. D. Pham, N. T. Hanh, D. T. Tran, M. V. Nguyen, N. M. Dang, N. T. P. Le Chi and V. N. Nguyen, Appl. Surf. Sci., 2019, 489, 875–882 CrossRef CAS.
- P. C. Karthika, R. A. Sharath, N. Angeline Little Flower, K. Mani Rahulan, G. Vinitha, M. Sasidharan and D. Prakashbabu, J. Mater. Sci.: Mater. Electron., 2022, 33, 8308–8317 CrossRef CAS.
- P. Liu, N. Sun, Y. Liang and F. Chen, Res. Chem. Intermed., 2018, 44, 843–857 CrossRef CAS.
- Q. Yu, Q. Xu, H. Li, K. Yang and X. Li, J. Mater. Sci., 2019, 54, 14599–14608 CrossRef CAS.
- X. Ma, Z. Zhang, C. Yu, Q. Fan and L. Wei, Mater. Res. Bull., 2020, 129, 110909 CrossRef CAS.
- S. Prabhu, C. Balaji, M. Navaneethan, M. Selvaraj, N. Anandhan, D. Sivaganesh, S. Saravanakumar, P. Sivakumar and R. Ramesh, J. Alloys Compd., 2021, 875, 160066 CrossRef CAS.
- M. I. Osotsi, D. K. Macharia, B. Zhu, Z. Wang, X. Shen, Z. Liu, L. Zhang and Z. Chen, Prog. Nat. Sci.: Mater. Int., 2018, 28, 408–415 CrossRef CAS.
- H. Huang, S. Wang, Y. Zhang and P. K. Chu, RSC Adv., 2014, 40, 41219–41227 RSC.
- Y. Zhao and H. Wang, Langmuir, 2021, 37, 13969–13975 CrossRef CAS PubMed.
- H. Wang, X. Yuan, Y. Wu, G. Zeng, X. Chen, L. Leng, Z. Wu, L. Jiang and H. Li, J. Hazard. Mater., 2015, 286, 187–194 CrossRef CAS PubMed.
- H. Leelavathi, R. Muralidharan, N. Abirami, S. Tamizharasan, S. Sankeetha, A. Kumarasamy and R. Arulmozhi, Colloids Surf., A, 2023, 656, 130449 CrossRef CAS.
- A. Kumar, S. K. Sharma, A. Kumar, G. Sharma, N. AlMasoud, T. S. Alomar, M. Naushad, Z. A. ALOthman and F. J. Stadler, J. Cleaner Prod., 2021, 315, 128137 CrossRef CAS.
- X. Fu, J. Tao, Z. He, Y. Gao, Y. Xia and Z. Zhao, J. Mater. Sci.: Mater. Electron., 2022, 33, 24663–24676 CrossRef CAS.
- J. Gao, W. Zeng, B. Tang, M. Zhong and Q. J. Liu, Mater. Sci. Semicond. Process., 2021, 121, 105447 CrossRef CAS.
- W. Meng, R. Hu, J. Yang, Y. Du, J. Li and H. Wang, Chin. J. Catal., 2016, 37, 1283–1292 CrossRef CAS.
- Q. Gao, G. Sun, R. Ling, Y. Cai and A. Wang, J. Mater. Sci.: Mater. Electron., 2022, 33, 25589–25602 CrossRef CAS.
- S. Saha, G. Das, J. Thote and R. Banerjee, J. Am. Chem. Soc., 2014, 136, 14845–14851 CrossRef CAS PubMed.
- C. Zhang, K. Gao, H. Zhu, J. Liu, J. Chen, F. Xie, W. Xie and X. Wang, ChemCatChem, 2022, 14, 202200225 Search PubMed.
- C. H. Shen, X. J. Wen, Z. H. Fei, Z. T. Liu and Q. M. Mu, J. Colloid Interface Sci., 2020, 579, 297–306 CrossRef CAS PubMed.
- H. Li, J. Qian and B. Pan, Chem. Eng. J., 2021, 403, 126395 CrossRef CAS.
- T. Rashid, F. Sher, A. Hazafa, R. Q. Hashmi, A. Zafar, T. Rasheed and S. Hussain, J. Environ. Chem. Eng., 2021, 9, 104502 CrossRef CAS.
- H. Wang, Y. Wu, M. Feng, W. Tu, T. Xiao, T. Xiong, H. Ang, X. Yuan and J. W. Chew, Water Res., 2018, 144, 215–225 CrossRef CAS PubMed.
- M. Sher, M. Javed, S. Shahid, S. Iqbal, M. A. Qamar, A. Bahadur and M. A. Qayyum, RSC Adv., 2021, 11, 2025–2039 RSC.
Footnote |
| † Electronic supplementary information (ESI) available. See DOI: https://doi.org/10.1039/d3nj00660c |
| This journal is © The Royal Society of Chemistry and the Centre National de la Recherche Scientifique 2023 |