
Ligand dynamics on the surface of CdSe nanocrystals†
Salvatore
Cosseddu‡
a,
Roberta
Pascazio‡
bc,
Carlo
Giansante
 d,
Liberato
Manna
b and
Ivan
Infante
*bef
d,
Liberato
Manna
b and
Ivan
Infante
*bef
aDepartment of Theoretical Chemistry and Amsterdam Center for Multiscale Modeling (ACMM), VU University Amsterdam, De Boelelaan 1083, 1081 HV Amsterdam, The Netherlands
bDepartment of Nanochemistry, Istituto Italiano di Tecnologia, Via Morego 30, 16163 Genova, Italy
cDipartimento di Chimica e Chimica Industriale, Università degli Studi di Genova, 16146 Genova, Italy
dConsiglio Nazionale delle Ricerche, Istituto di Nanotecnologia CNR-NANOTEC, Via Monteroni, 73100 Lecce, Italy
eBCMaterials, Basque Center for Materials, Applications, and Nanostructures, UPV/EHU Science Park, Leioa 48940, Spain. E-mail: ivan.infante@bcmaterials.net
fIkerbasque Basque Foundation for Science, Bilbao 48009, Spain
First published on 23rd March 2023
Abstract
Synthesis protocols of colloidal semiconductor nanocrystals (NCs) comprise the coordination of the semiconductive inorganic core by a layer of organic ligands, which play a crucial role in stabilizing the NCs in organic solvents. Understanding the distribution, binding and mobility of ligands on the different NC facets is key to prevent the formation of surface defects and to optimize the overall optoelectronic efficiency of these materials. In this paper, we employed classical molecular dynamics (MD) simulations to shed light on the plausible locations, binding modes and mobilities of carboxylate ligands on the different facets of CdSe nanocrystals. Our results suggest that these features are influenced by the temperature of the system and the coordination number of the surface (Cd and Se) atoms. High ligand mobilities and structural rearrangements are linked to a low coordination of the Cd atoms. Undercoordinated Se atoms, which are considered the culprit of hole trap states in the bandgap of the material, are instead found to spontaneously form on the nanosecond timescale, making them likely candidates for an efficient photoluminescence quenching mechanism.
Introduction
Colloidal semiconductor nanocrystals (NCs) are nanometric sized particles1 usually passivated by a layer of capping organic ligands, which prevent aggregation and play a crucial role in stabilizing the NC in organic solvents. At smaller sizes, NCs present an increased surface-to-volume ratio2,3 and a large fraction of their atoms are exposed at the surface. These atoms are usually under-coordinated and highly mobile,4,5 and could lead to the formation of surface defects that can introduce localized “midgap” states.6–12 Upon photo-excitation, these midgap or trap states can act as non-radiative recombination centers, reducing the photoluminescence quantum yield (PLQY)11,13,14 of the material and/or the charge transport between NCs when these are casted into solid films. Surface ligands are also envisioned as a tool to passivate these surface defects and to move their corresponding energy levels outside the bandgap.15 A very successful strategy to eliminate midgap states is indeed to passivate the surface with another semiconductor (or insulating) material with a wider bandgap to form core–shell-type structures.16–18 The growth of a shell layer on II–VI materials has been demonstrated to lead to PLQY >90%.6,7,19,20 Unfortunately, adding a shell also introduces a barrier hindering inter-NC charge transport and mobility in solid films.21 A valid alternative to passivate traps in core-only NCs is to substitute native ligands via ligand exchange mechanisms, by a tailored choice of (short) organic or inorganic ligands to favor both the elimination of surface defects and the electronic coupling between NCs.22,23 This approach is currently the object of numerous theoretical and experimental investigations, mostly because the packing of ligands at the NC surface is hard to control and it depends on the optimization of several enthalpic and entropic contributions that govern the dispersion/precipitation equilibrium of colloidal NCs in a given solvent.24,25The deployment of experimental tools capable of gaining insight into the surface chemistry of colloidal NCs has grown through the years, enabling a deeper inquiry into how ligands bind to the NC surface, commonly reported in terms of L-type, X-type and Z-type contributions,26–28 and their lability.29,30 Solid-state nuclear magnetic resonance (NMR) studies, for example, proved able to determine the NC surface ligand coverage,31i.e. the number of capping ligands per nm2 and the presence of dangling bonds on the surface of the inorganic NC core through the shift in the coordination of the atoms.32–34 These studies can reveal for example the fraction of the NC surface occupied by ligands after the purification step. As such, they provide a clue on the amount of surface area available to new ligands, for example during a ligand exchange process, or how many surface sites can still be passivated to remove all dangling (trap) sites. Recent studies combining Fourier-transform infrared (FT-IR) spectroscopy and NMR have also provided important indications on the ligand binding modes with the metal surface ions.35–37
Despite all this progress, it is still not possible to deterministically control the PLQY or the transport properties only by a suitable choice of surface ligands at the synthetic step, or even during post-synthetic treatment aimed to replace the native ligands. Indeed, many variables of the NC surface are yet to be properly understood. For example, nowadays high-resolution transmission electron microscopy (HR-TEM) is very helpful in identifying the shape of the colloidal NCs and the faceting of the inorganic core,11,14,25,38,39 but is still unable to provide clues on where the ligands are and how mobile they are. Understanding the correct ligand distribution at the NC surface by analyzing how ligands cover different facets, how they bind to the NC surface atoms, and how they move is pivotal in further manipulating the surface and ultimately improving the performance of these materials.
In this work we make an important step toward a comprehensive characterization of the NC surface by investigating the complex inorganic/organic interface region through atomistic calculations. We take CdSe as a model system. With classical molecular dynamics (MD) simulations we elucidated the modality (i.e. location, mobility and structure) of ligand binding to the NC surface and the role of ligand stabilization and surface coordination in the optimization of this process. We demonstrate how the ligand surface coverage is linked to the temperature and is facet-specific. On this basis, we suggest strategies aimed at the improvement of these materials, namely: (i) increasing the density of ligands to decrease the presence of di-coordinated Se, a source of hole traps, on the NC surface and (ii) including neutral Z-type metal complexes to coordinate Se-rich facets to increase surface coverage. We believe that our findings will evolve into more precise approaches aimed at the improvement of the optoelectronic properties of CdSe, and metal chalcogenide at large, NCs.
Methodology
Construction of the NC model
The main goal of this work is to understand the most plausible location of the organic ligands passivating the surface of CdSe NCs. In our case, we chose to study the effect of oleate ligands because they are most commonly employed in the experiments.40–42 We remind the reader that surface ligands can be classified in terms of Green's notation as L-type, X-type and Z-type, depending on the number of electrons that are shared between the ligands and the NC surface atoms.28,29 For our purposes, the oleyl-based ligands can behave as X-type ligands, in the oleate form, as L-type ligands, as oleic acid, and as Z-type ligands, as Cd(oleate)2. In this paper we consider only passivation with X- or Z-type oleyl ligands, whereas L-type have not been included to simplify the investigation.At first, we constructed a NC model that resembles the experimental findings as close as possible by following a procedure that we used in other works.43–45 Briefly, we initially built an ideal non-stoichiometric CdSe NC model of about 4.0 nm of diameter, carved in a cuboctahedral shape from a zinc blende bulk structure as shown in Fig. 1. The chemical formula of our NC model is Cd1012Se911, resulting in a Cd![[thin space (1/6-em)]](https://www.rsc.org/images/entities/char_2009.gif) :Se molar ratio of about 1.1. This value indicates a slight excess of metal ions, in agreement with experimental findings.40 In this model, 38% of the atoms reside on the surface. Most of these surface atoms possess incomplete coordination shells, and their number exceeds the amount of the oleyl-based ligands required to completely passivate the NC. Indeed, a simple assumption of one ligand per surface site implies a coverage of about 9.5 ligands per nm2, a value that largely exceeds the experimental values, typically ranging between 2 and 6 ligands per nm2.29,46–48 Our model NC exhibits: (i) six Cd-rich (100) facets with 2-coordinated Cd atoms (Cd-2c) protruding from the surface in a tetrahedral conformation; (ii) four Cd-rich (111) facets with both 3-coordinated Cd (Cd-3c) and Se (Se-3c) atoms lying on the same plane; (iii) four Se-rich (
:Se molar ratio of about 1.1. This value indicates a slight excess of metal ions, in agreement with experimental findings.40 In this model, 38% of the atoms reside on the surface. Most of these surface atoms possess incomplete coordination shells, and their number exceeds the amount of the oleyl-based ligands required to completely passivate the NC. Indeed, a simple assumption of one ligand per surface site implies a coverage of about 9.5 ligands per nm2, a value that largely exceeds the experimental values, typically ranging between 2 and 6 ligands per nm2.29,46–48 Our model NC exhibits: (i) six Cd-rich (100) facets with 2-coordinated Cd atoms (Cd-2c) protruding from the surface in a tetrahedral conformation; (ii) four Cd-rich (111) facets with both 3-coordinated Cd (Cd-3c) and Se (Se-3c) atoms lying on the same plane; (iii) four Se-rich (![[1 with combining macron]](https://www.rsc.org/images/entities/char_0031_0304.gif) ) facets with 3-coordinated surface Se (Se-3c) atoms in a pyramidal configuration; and (iv) twelve staircase (110) facets. The surface includes also “edge” atoms shared between two distinct facets, and “vertex” atoms found at the intersection between three facets. A breakdown of the surface atomic contribution is presented in Table 1. Notably, the combination of edge and vertex atoms comprises almost half of all surface atoms, validating their primary role in the dynamics of the NC surface.
) facets with 3-coordinated surface Se (Se-3c) atoms in a pyramidal configuration; and (iv) twelve staircase (110) facets. The surface includes also “edge” atoms shared between two distinct facets, and “vertex” atoms found at the intersection between three facets. A breakdown of the surface atomic contribution is presented in Table 1. Notably, the combination of edge and vertex atoms comprises almost half of all surface atoms, validating their primary role in the dynamics of the NC surface.
 | ||
| Fig. 1 Scheme of the employed CdSe NC core model. Se () and Cd(111) respectively account for () and (111) facets. | ||
| Facets | Edges | Vertices | ||||||
|---|---|---|---|---|---|---|---|---|
| Location on the surface | % of surface atoms | Location on the surface | % of surface atoms | Location on the surface | % of surface atoms | |||
| Cd | Se | Cd | Se | Cd | Se | |||
| (100) | 50 | 0 | (100)/(111) | 29 | 50 | (100)/(110)/() |
50 | 50 |
| (111) | 20 | 50 | (100)/() |
43 | 50 | (100)/(110)/(111) | 50 | 50 |
| () |
30 | 50 | (110)/(111) | 14 | 0 | |||
| (110) | 0 | 0 | (110)/() |
14 | 0 | |||
| Total over all surface atoms of a given type and position | 100 | 100 | 100 | 100 | 100 | 100 | ||
| Total over all surface atoms of a given type | 65 | 40 | 23 | 36 | 12 | 24 | ||
| Total over all surface atoms | 56 | 27 | 17 | |||||
Results
Surface ligand distribution
The overall charge neutrality of the model is preserved by compensating the excess Cd2+ charge with oleate ligands.6 We indeed employed 202 oleate ligands to fully passivate the NC surface and solvated the system by dichloromethane. Considering the high complexity of the system to be simulated, we decided to focus solely on X-type ligands passivation, which we repute a reasonable trade-off with the available experimental findings. The role of charge neutral L-type ligands, such as oleic acid molecules, is not analyzed here. To obtain a statistical (and physically meaningful) distribution of oleates, we performed over 300 different sets of MD simulations – i.e. productive runs – for an aggregated simulated time of ∼10 μs, where the interaction between all pair of atoms in the system is described by a classical force-field (FF). The parameters of this FF for CdSe NCs have been obtained by some of us elsewhere.49 These simulations have been carried out using the GROMACS50 software package and were run with a smooth particle mesh Euler method (SPME) using beta-Euler splines51 for the computation of the LJ and coulombic terms. The spacing between consecutive grid points in the mesh was set to be 0.62 Å. The integration steps were chosen to be 1 fs timestep to properly account for the vibrations of the organic ligands. Initially, for each of these uncorrelated set of simulations, oleate ligands were randomly displaced on a “virtual” sphere at ∼1 nm from the NC surface, with the carboxylate headgroups loosely pointing towards the surface (Fig. 2a and b). Each set of these simulations, or replica, was executed using a micro-canonical ensemble at constant energy (NVE) for ∼20 ns in vacuum. In this framework, the oleate ligands were allowed to move towards the surface (Fig. 2c) by initializing their atomic velocities to 500 K, while the atomic positions of Cd and Se were kept fixed to maintain the NC integrity. This freezing is done to prevent the reconstruction of the core before the ligands approach the surface, since we expect that in reality, during the NC synthesis, ligands are always bound to the surface at all stages of NC growth. With this approach we allowed the ligands to reach the surface at temperatures close to those commonly employed during the hot-injection synthesis41,52 and, by doing so, to obtain a meaningful statistics on how the ligands are distributed. In a following step, each replica was solvated in dichloromethane by explicit inclusion of solvent molecules in the simulation box, relaxed in an isothermal-isobaric environment (NpT, where the constant pressure and temperature were respectively kept at 1 atm and 500 K) for 1.5 ns and gently equilibrated by annealing from 500 K to room temperature, 298 K, for 20 ns (Fig. 2d). From this stage of the simulations onwards, both the core atoms and the ligand molecules were relaxed to allow for an accurate simulation of their mobilities. Finally, each replica was simulated for additional 20 ns at 298 K and 1 atm. Statistical analyses of ligand distributions were done by analyzing the final trajectories obtained from 100 different sets of these last simulations carried out at room temperature. | ||
| Fig. 2 Depiction of a productive run. (a) Initial collocation of oleate ligands on random spheres at 1 nm from the NC surface. (b) Cumulative locations of the ligand oxygen atoms on the spheres. (c) Structural representation of the ligand packing in vacuum after 20 ns in vacuum, NVE ensemble. (d) Structural representation of the ligand packing in solvent after 20 ns of annealing, NpT ensemble. | ||
Our simulations reveal a substantial inhomogeneous coverage of the NC. Also, a clear trend is visible in the ligand-NC affinities among the different facets, with the following trend: (100) > (111) > (110). We computed the ligand coverage for each facet from the areas of the different investigated facets. The results, averaged over the 100 replicas, are reported in Table 2. The high coverage displayed by the (100) and (111) facets can be attributed to the positively charged Cd atoms exposed on these surfaces. Additionally, these Cd atoms are Cd-2c in the (100) facet and Cd-3c in the (111) facet, resulting in distinct affinities towards the ligands. This difference provides an explanation for the overall highest ligand concentration on the (100) facet (4.99 ligand per nm2) as opposed to the (111) facet (3.11 ligand per nm2).
| Surface area | Ligand density | |||
|---|---|---|---|---|
| Facet | Area (nm2) | % of total surface area occupied by each facet | Density per nm2 (standard deviation) | Density per Cd atoms |
| (100) (×6) | 32.2 | 55 | 4.99 (0.06) | 0.53 |
| (111) (×4) | 11.8 | 20 | 3.11 (0.16) | 0.15 |
| (111) (×4) | 11.8 | 20 | 0.1 (0.09) | 0.00 |
| (110) (×12) | 3.1 | 5 | 1.18 (0.56) | 0.05 |
| Total | 58.9 | 100 | 3.43 | 0.54 |
The lowest ligand concentration (0.1 ligand per nm2) was found for Se-rich () facets. This result is expected, as negatively charged oleate ligands would experience repulsive forces with negative surface Se ions. However, binding of oleate ligands is occasionally observed on these facets due to the occurrence of crystal defects, i.e. when Cd atoms are exposed as a consequence of small local structural rearrangements, or surface reconstruction.
We define this as an “on-defect” binding mode, and we expect the binding of Z-type ligands to be thus favored on these facets, although they have not been included explicitly in these simulations. Overall, the ligand concentration on the () facets was found to be very low, as it depends on the extent of surface reconstruction. Our calculations also demonstrate that oleates bind to (110) facets.
An estimate of this ligand affinity yields a value between those of the (111) and () facet. The fairly high uncertainty – i.e. standard deviation – is a consequence of the small area of (110) in our model. A large fraction of ligands was found at the edges and vertices of the NC model. As shown in the ESI† of this manuscript, these are the most unstable regions of the NC model.
Location of binding sites
The existence of well-defined binding sites and the self-arrangement of oleates into ordered structures is demonstrated by the detailed two-dimensional map of the NC surface in Fig. 3a. This map was computed by aggregating the data from the hundred replicas. Translational and rotational modes were removed from the simulations and the ligand coverage was estimated for θ and φ spherical coordinates, accounting for all the positions assumed by the carbon atoms of the carboxylate anchoring group. The information retrieved from the plotted map directly relates to adsorption free energies and to ligand–NC affinities. As expected, the number of potential binding sites was found to be higher than the number of X-type ligands required for the complete compensation of the charge of the NC (i.e. necessary to achieve charge neutrality in the model). The type and distribution of sites vary considerably from facet to facet and, occasionally, even across different regions of the same facet. Best-defined binding sites and strongest affinities were found on the (100) facet, where ligands are ordered in lines and their σyz mirror planes (i.e. the ones comprising the oxygen atoms) are oriented in a parallel fashion. This arrangement results in very dense structures and inter-oleyl tail packing. On the Cd-rich (111) facet, on the other hand, binding is weaker and sparser, and sites are less defined, causing a lower packing of oleyl tails. Here, Cd atoms are coordinated by 3 Se (Cd-3c) and, as mentioned earlier, this coordination is associated to a higher stability and a lower affinity to the charge of X-type ligands in comparison to the Cd-2c of the (100) facets. Consequently, Cd-3c preferentially bind a single oxygen atom. An exception to this behavior is encountered for Cd-2c atoms at the edges, shared with (100) facets and behaves similarly to the Cd-2c of the neighboring (100) facets: they show indeed a higher charge affinity and a preference to bind to 2 oxygen atoms, one from each carbonyl moiety of the oleate ligands on the neighboring (111) and (100) facets. This tendency generates two widely different regions in the (111) facets (Fig. 3b): (i) a central region with fewer oleates; and (ii) the regions near the edges, richer in ligands. Binding sites, although weaker, are better defined in the former (green in the map in Fig. 3b), while they merge in the latter creating visible stripes in the map. Once again, this finding can be explained by the choice of compensating the excess metal charge in our NC model by choosing solely X-type oleate ligands. In a similar fashion, L-type oleic acid and Z-type Cd(oleate)2 molecules could, however, prove to be effective candidates to passivate available binding sites on the Se-rich () facets and maximize ligand packing.
 | ||
| Fig. 3 Composition of ligands on the different NC facets. (a) Two-dimensional map of the CdSe NC facets. (b) Density map of the locations of the ligands on the different binding sites of the individual facets. | ||
In summary, in agreement with previous theoretical investigations,24 a strong correlation occurs between ligand coverage and stability of the NC. Ligands are in fact decisive in compensating the intrinsic instability of (100) facets caused by the low coordination of Cd-2c atoms on their surface: the absence of an oleate ligand always corresponded to a crystal defect (vacancy) in our simulations (see Fig. 4a.1 and b.1). A more detailed representation of the packing of the ligands on the different facets and of their evolution over time is available in the ESI† of this manuscript.
 | ||
| Fig. 4 (a) Structural representations and (b) details of the packing of the oleate ligands on the different facets of the NC model for: (1) facet (100), (2) facet () and (3) facet (111). Cd vacancies are circled in red. | ||
Near the () facets, these defects were stabilized through the diffusion of Cd to the surface, resulting in a decreased probability to find ligands close to these Se-rich facets (Fig. 4.2 and b.2). On the contrary, defects are stabilized by the addition of oleates on the Cd-rich (111) facets, as a consequence of the on-defect binding that stabilizes the exposed Cd atoms (Fig. 4.3 and b.3).
Binding modes
For a long time, researchers have been speculating on the way oleates bind on CdSe NCs.40,42 The complexity of the processes taking place on the surface of NCs at room temperature can de facto be represented as a series of fleeting structural configurations in which the ligand is temporarily bound to the NC surface in a specific position. A statistical sampling of all these configurations classified thanks to a distance threshold between the core surface atoms and the ligand anchoring group is employed to provide a measure of the binding modes present in the system. We decided to investigate these conformations on the last portion (300 ns) of the 1 μs, room temperature simulation through a three-digit notation. The first 2 digits of the notation indicate the number of Cd atoms bound to each oxygen atom of the carboxylate anchoring group.For example, Fig. 5a.1 describes a binding mode in which one oxygen atom of the carboxylate group is bound to a Cd atom (the first 1 in the notation), while the second oxygen atom is bound to two Cd atoms (2 in the notation). The third digit in the notation expresses the number of Cd atoms bound simultaneously to both oxygens of the carboxylate moiety: in the previous example, one of the Cd atoms is indeed shared by both oxygen atoms. This last digit is thus reminiscent of the presence of a chelating binding configuration, which is any case always mixed with a bridging configuration. A pure bridging configuration, on the other hand, is described by a value of 0 in the third digit of the notation. Overall, a plethora of possible binding configurations are available, and in none of them oleates behave as pure chelating or monodentate ligands. These configurations have been the subject of previous investigations5 based upon theoretical53 and experimental54–57 findings. Those studies already supported the presence of monodentate ligand geometries on CdSe NCs and analogous II–VI NC models, by correlating them with nonradiative relaxation processes, ultimately affecting the PLQY of the particles,58 as well as NMR and IR techniques,37,59,60 whereas a previous work by Weiss et al.37 led on PbS NCs had assessed a 1:1 a molar ratio of chelating to bridging oleate, independently of the NC size. Over the course of this work, we have defined a threshold for the bond between Cd atoms and the oxygens of the carboxylate moiety, and proceeded to label the different binding modes as previously stated. From our analysis, six configurations can be regarded as the most relevant ones (Fig. 5a), and the precise self-arrangement of ligands discussed above stems from sindication of the occurrence of the different configurations (and thus their probability of occurring over time) can be found in Fig. 5b.
 | ||
| Fig. 5 Binding modes of the ligands on the surface of the NC model. (a) Schematic representation of the six most common binding modes. (b) Schematic representation of the density of the different binding modes on the three most packed NC facets, (100), () and (111). (c) Binding modes on (100) facets. (d) Binding modes on (111) facets. (e) Binding modes on () facets. | ||
On (100), Cd atoms usually bound two different oleates and a bridging/chelating mode (1−2−1) is largely dominant (see Fig. 5c): most oleates chelate a Cd atom, while one of their oxygen atoms bridges the chelated and the neighbour Cd, allowing for an optimal packing on the surface. The low mobility associated to this binding modality is a synergic combination of dense ligand packing and high ligand affinity. This binding, however, is not rigid, and oleates assume different fleeting conformations (i.e. the bridging chelating mode 2−2−1, the pure bridging modes 1−1−0 and 2−2−0). These fluctuations are strongly correlated, resulting in global, concerted moves of the ligands (a representation of this binding modality is shown in Fig. 5c). A very different situation was found on (111), where, due to the lower ligand-affinity and the higher coordination of Cd-3c, binding is more evenly distributed among the different modes and a clear peak is absent in Fig. 5b. Ligands move faster on these facets, in a more random fashion (see Fig. 5d). Conversely, on () facets (Fig. 5e), the diffusion of oleate ligands on these facets primarily occurs as a collective motion of Z-type Cd(oleate)2, fluctuating between fleeting 1−2−1 and 1−1−0 binding modes, and it depends on the mobility of Cd(oleate)2 ligands on the surface and on the rate of creation of new surface defects. The occurrence of this binding mode is shown in Fig. 5b.
Mobility of surface species
We measured the mobility of ligands on our NC model through 1 μs, room temperature simulation reconstructions of the system. Previous theoretical and experimental investigations had investigated the role of L-, X-, and Z-type ligands on the surface stabilization of CdSe NC models,7,61–63 suggesting that ligand mobility is strongly correlated to the mobility of the surface atoms of the core. We therefore chose to inquire into ligand mobility by investigating the mobility of core atoms and, more specifically, of their root mean square displacements (RMSD). We employed the RMSD computed from the ideal structure as reference. At first, RMSDs were computed as a function of the NC radius (r): we considered the cross section of the reference structure and divided it into 12 concentric spherical shells (spacing of 2.1 Å, see Fig. 6a), which were used to group atoms according to their relative distance from the NC center of mass (COM). RMSDs were computed for each of these 12 groups. NCs are faceted solids: therefore, the most external ring in our model mainly comprises atoms at vertices and edges. Thereafter, specific mobilities of the various NC regions were investigated by computing the RMSDs on the NC atoms of the reconstructions, grouped according to the region to which they belonged in the ideal structure. In these analyses, larger displacements thus correspond to larger reconstructions.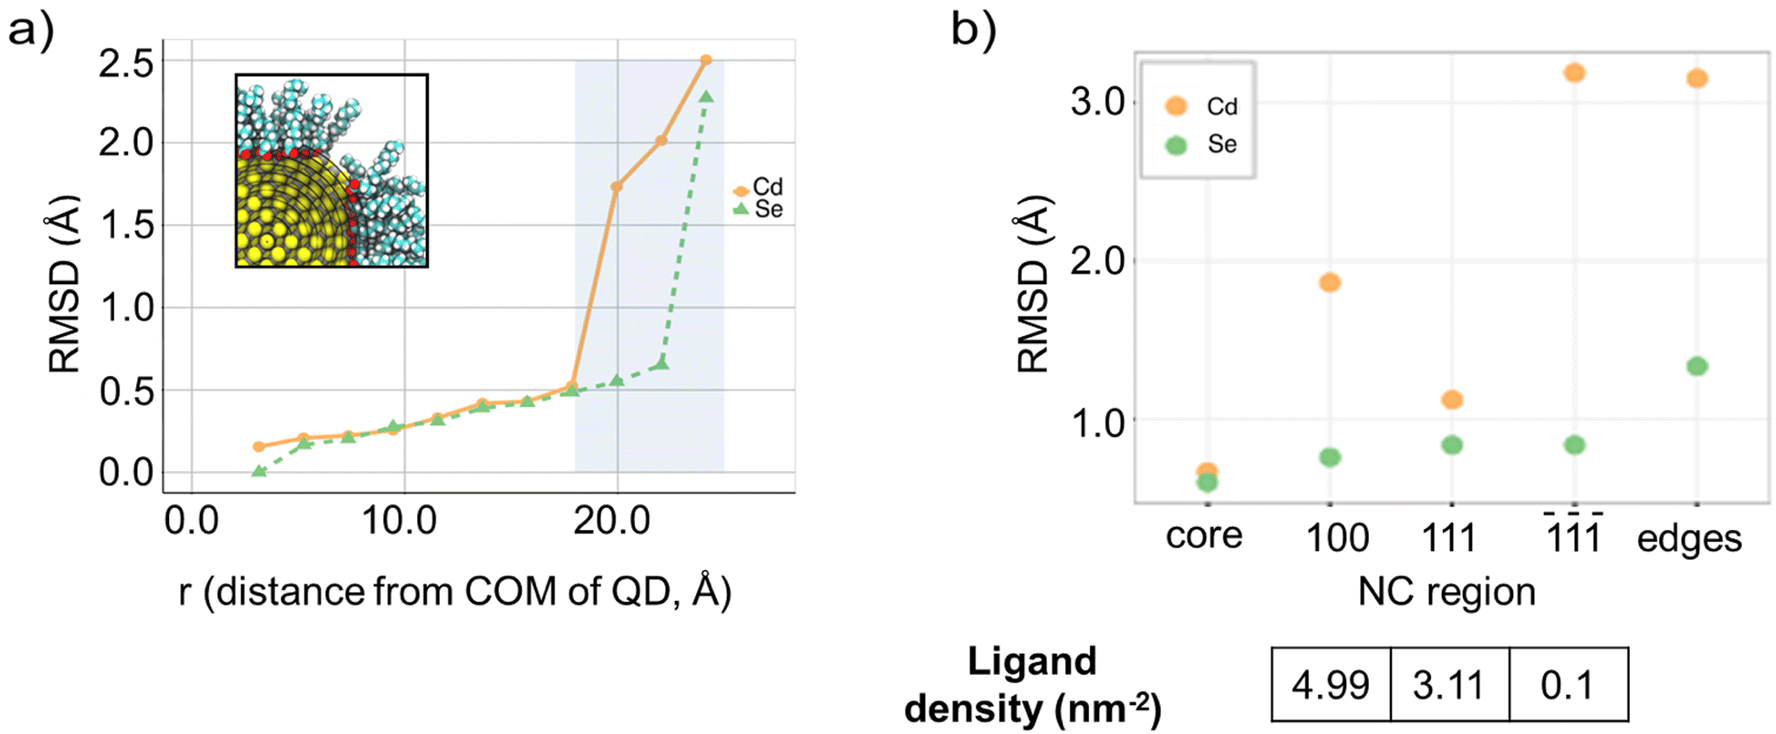 | ||
| Fig. 6 (a) Representation of the separation of a section the NC core atoms into 12 different regions depending on the atomic distance from the center of mass, and RMSD plot of Cd and Se atom displacements throughout the MD simulations. (b) RMSD plots of Cd and Se atoms in the different regions of the NC and ligand densities on the exposed facets. | ||
As expected, our calculations show a contrast between the dynamic nature of the surface atoms and the rigidity of the inner core atoms. On the one hand, the latter maintained the bulk structure throughout the simulations and both Cd and Se atoms remained in their original positions. Larger rearrangements were observed at the surface of the NC model, the extent of which differed between the two species (see Fig. 6b): the mobility of Se atoms changed dramatically only at the edges/vertices (i.e. in the most external shell), while Cd atoms became very mobile already at sub-surface shells. We noted that rearrangements were faster in the first stages of the simulations. This finding suggests that an initial high temperature (500 K) created perturbations that relaxed to a “normal”, room-temperature behavior over relatively long-time scales (tens of ns). This slow response is relevant for practical applications, in which NCs are exposed to various external perturbations (photon irradiation, electric fields, etc.) that locally heat them to extents that can be difficult to be predicted by theoretical models. Analyses on the various regions confirmed that edges and vertices are the most unstable sites on the surface, and that most of the reconstructions in the central regions of the facets involve Cd atoms. Surprisingly, Cd reconstructions were smallest at the (111) facets while the largest were observed on () facets. This finding supports the indication that binding on these Se-rich facets could be favored in the presence of neutral Z-type Cd(oleate)2 moieties, providing a feasible strategy to achieve higher coverages on these facets. An example of these reconstruction mechanisms are exchanges – i.e. swaps in the positions of Cd atoms – between the surface and the immediately underlying layer. The paths of these exchanges were very diverse, often involving the diffusion of Cd atoms towards the edges of the model. The extent of displacements for (100) facets was found to be in-between those of the (111) and () facets. This trend in the extent of reconstructions, () > (100) > (111), confirms the above-mentioned strong influence of ligands on the maximization of the stability of a NC facet (Fig. 6b). It is important to note how different affinities and binding modes, and therefore different arrangements, play a central role in differentiating the behavior of the (111) and (100) facets.
Coordination numbers and trap states
Dangling bonds at the surface of NCs are believed to affect their electronic properties. In particular, in a previous theoretical work7 by some of us, we suggested the involvement of Se atoms (Se-2c) as hole trap states. Over this section, we will provide further insight on the nature of these states and or the evolution of their decay. Our production runs show that the presence of dicoordinated Se-2c atoms on the surface of the NC model arises from the high mobility of the () facets of the model, which has already been highlighted in the previous section. A graphical representation of this phenomenon is shown in the video provided in the ESI† of this manuscript. Moreover, in our MD simulation, Se-2c states exhibited a huge variability: they appeared and disappeared on the nanosecond timescale (average lifetime 6.75 ns), primarily in the first parts of the simulations. Nine different Se atoms, all located near the edges/vertices of the model, were 2-coordinated at some point of the simulation. The coordination numbers of these atoms subsequently evolved differently: Se-2c states had different lifetimes and frequencies, ranging from shorter and frequent to fewer and longer (two examples are reported in Fig. 7a). Overall, a prevalence of the shorter Se-2c lifetimes was observed (Fig. 7b) and, although an exact description is difficult because of the trajectory time resolution, distribution can be nicely fitted by an exponential equation. The stochastic nature of these on/off processes caused Se-2c to decay with time (Fig. 6c) in a random fashion, without a definite trend. This trend is consistent with the above discussed existence of a relaxation of the NC from an initially perturbed state. The results of our investigation can be summarized by considering the occurrence of Se-2c in our simulations as a sum of different on/off random processes that disappeared after few tens of ns. Rearrangements at different spatial and time scales superimpose, spawning the following processes: (i) local stochastic evolutions of the single Se and the nearby atoms, and (ii) a consequent global relaxation of the whole system towards more energetically favourable conformations of the NC model. As stated previously, the stabilization provided by ligands on the electronic structure of CdSe NC models and their contribution in the elimination of midgap states has been the object of a variety of theoretical and experimental investigations.7,61–63 In agreement with these findings, a careful analysis of the trajectories suggests that ligands play a decisive role in the rate of the global relaxation process due to their involvement in the achievement of surface stability and, therefore, on the speed and extent of the surface reconstructions routes.
 | ||
| Fig. 7 Breakdown of the evolution of Se-2c states on the NC model at room temperature. (a) Two examples of the evolution of the coordination of Se atoms located on edges/vertices of the model. (b) Representation of the variation of the density of Se-2c states over the average lifetimes of the MD replicas. (c) Representation of the evolution of the decay of Se atoms to Se-2c over the course of the MD replicas. | ||
We therefore suggest that Se-2c and similarly shaped surface trap states can be turned on by the presence of perturbations and then slowly disappear at room temperature, resulting in time scales easily spanning over hundreds of microseconds. If the NC is in a perturbed state or undergoes frequent perturbations, Se-2c states are created and destroyed stochastically. Since the involved time scales are consistent with those of radiative recombination, the presence of Se-2c could thus strongly influence the optoelectronic properties of NC model.
Conclusions
In this work, we provided an outlook on the binding modes of oleate ligands on a CdSe inorganic core. We performed several classical MD simulations to acquire a statistical characterization of the most plausible location of oleate ligands on the NC facets, pointing out a direct correlation between the lower coordination of Cd atoms in Cd-rich (100) and (111) facets and a higher concentration of oleate ligands, thus suggesting their involvement in the stabilization of the most unstable regions of the model, also including the edges and vertices of the CdSe core. These findings are additionally confirmed by our investigation of the binding modes and mobilities of these ligands on the NC surface, linking high ligand mobilities and rearrangements to a synergy of the simultaneous presence of surface defects on specific ligand binding sites and high Cd coordination (i.e. low charge affinity towards negatively charged oleate ligands). Within this background, we also investigated the involvement of undercoordinated Se atoms in the formation of surface hole trap states. Our results highlight that dicoordinated Se atoms stem from stochastic on/off processes on the nanosecond timescale. The healing of such Se defects occurs spontaneously and can be potentially tuned by increasing the ligand coverage, therefore decreasing the density of these defects on the NC surface. We believe that our findings can provide a helpful tool in the development of new strategies for the optimization of the optoelectronic properties of this class of semiconductor nanomaterials.Author contributions
The manuscript was written through contributions of all authors. S. C. has contributed in the conceptualization and investigation of the project, thus acquiring, visualizing and analyzing the data. R. P. has carried out the formal data analysis, the visualization, and the drafting, reviewing and editing of the paper. L. M. was involved in the supervision and editing of this work. The project was carried out under the supervision of I. I. and C. G., who have taken part in the conceptualization and investigation of the project, as well as in the acquisition of the funding and resources. All authors have given approval to the final version of the manuscript.Conflicts of interest
There are no conflicts to declare in this manuscript.Acknowledgements
We thank Juliette Zito for reading the manuscript and for the useful insight. Ivan Infante would like to thank the Netherlands Organization of Scientific Research (NWO) for providing financial support within the Innovational Research Incentive (Vidi) Scheme through the grant 723.013.002. LM and II acknowledge funding from the program MiSE-ENEA under the grant “Italian Energy Materials Acceleration Platform IEMAP”. The computational work was carried out on the Dutch national e-infrastructure with the support of SURF Cooperative.References
- L. E. Brus, J. Chem. Phys., 1984, 80, 4403–4409 CrossRef CAS.
- J. M. Azpiroz, J. M. Ugalde and I. Infante, J. Chem. Theory Comput., 2014, 10, 76–89 CrossRef CAS PubMed.
- C. L. Hartley, M. L. Kessler and J. L. Dempsey, J. Am. Chem. Soc., 2021, 143(3), 1251–1266 CrossRef CAS PubMed.
- A. J. Harvie, C. T. Smith, R. Ahumada-Lazo, L. J. C. Jeuken, M. Califano, R. S. Bon, S. J. O. Hardman, D. J. Binks and K. Critchley, J. Phys. Chem. C, 2018, 122, 10173–10180 CrossRef CAS.
- J. Owen, Science, 2015, 347, 615–616 CrossRef CAS PubMed.
- C. Giansante and I. Infante, J. Phys. Chem. Lett., 2017, 8, 5209–5215 CrossRef CAS PubMed.
- A. J. Houtepen, Z. Hens, J. S. Owen and I. Infante, Chem. Mater., 2017, 29, 752–761 CrossRef CAS.
- S. V. Kilina, P. K. Tamukong and D. S. Kilin, Acc. Chem. Res., 2016, 49, 2127–2135 CrossRef CAS PubMed.
- K. C. Dümbgen, J. Zito, I. Infante and Z. Hens, Chem. Mater., 2021, 33, 6885–6896 CrossRef.
- D. Zhu, J. Zito, V. Pinchetti, Z. Dang, A. Olivati, L. Pasquale, A. Tang, M. L. Zaffalon, F. Meinardi, I. Infante, L. De Trizio, L. Manna and S. Brovelli, ACS Energy Lett., 2020, 5, 1840–1847 CrossRef CAS PubMed.
- B. Zhang, L. Goldoni, J. Zito, Z. Dang, G. Almeida, F. Zaccaria, J. de Wit, I. Infante, L. De Trizio and L. Manna, Chem. Mater., 2019, 31, 9140–9147 CrossRef CAS.
- B. Zhang, M. Wang, M. Ghini, A. E. M. Melcherts, J. Zito, L. Goldoni, I. Infante, M. Guizzardi, F. Scotognella, I. Kriegel, L. De Trizio and L. Manna, ACS Mater. Lett., 2020, 2, 1442–1449 CrossRef CAS PubMed.
- J. Shamsi, A. S. Urban, M. Imran, L. De Trizio and L. Manna, Chem. Rev., 2019, 119, 3296–3348 CrossRef CAS PubMed.
- M. Imran, L. Peng, A. Pianetti, V. Pinchetti, J. Ramade, J. Zito, F. Di Stasio, J. Buha, S. Toso, J. Song, I. Infante, S. Bals, S. Brovelli and L. Manna, J. Am. Chem. Soc., 2021, 143(3), 1435–1446 CrossRef CAS PubMed.
- M. I. Bodnarchuk, S. C. Boehme, S. Ten Brinck, C. Bernasconi, Y. Shynkarenko, F. Krieg, R. Widmer, B. Aeschlimann, D. Günther, M. V. Kovalenko and I. Infante, ACS Energy Lett., 2019, 4, 63–74 CrossRef CAS PubMed.
- P. Reiss, M. Protière and L. Li, Small, 2009, 5, 154–168 CrossRef CAS PubMed.
- X. Peng, M. C. Schlamp, A. V. Kadavanich and A. P. Alivisatos, J. Am. Chem. Soc., 1997, 119, 7019–7029 CrossRef CAS.
- M. A. Hines and P. Guyot-Sionnest, J. Phys. Chem., 1996, 100, 468–471 CrossRef CAS.
- O. Chen, J. Zhao, V. P. Chauhan, J. Cui, C. Wong, D. K. Harris, H. Wei, H.-S. Han, D. Fukumura, R. K. Jain and M. G. Bawendi, Nat. Mater., 2013, 12, 445–451 CrossRef CAS PubMed.
- M. Nasilowski, P. Spinicelli, G. Patriarche and B. Dubertret, Nano Lett., 2015, 15, 3953–3958 CrossRef CAS PubMed.
- A. M. Abuelela, T. A. Mohamed and O. V. Prezhdo, J. Phys. Chem. C, 2012, 27, 14674–14681 CrossRef.
- C. Giansante, Acc. Chem. Res., 2020, 53, 1458–1467 CrossRef CAS PubMed.
- C. Giansante, I. Infante, E. Fabiano, R. Grisorio, G. P. Suranna and G. Gigli, J. Am. Chem. Soc., 2015, 137, 1875–1886 CrossRef CAS PubMed.
- J. Zito and I. Infante, Acc. Chem. Res., 2021, 54, 1555–1564 CrossRef CAS PubMed.
- Y. Yang, H. Qin and X. Peng, Nano Lett., 2016, 16, 2127–2132 CrossRef CAS PubMed.
- R. Gomes, A. Hassinen, A. Szczygiel, Q. Zhao, A. Vantomme, J. C. Martins and Z. Hens, J. Phys. Chem. Lett., 2011, 2, 145–152 CrossRef CAS.
- B. Zeng, G. Palui, C. Zhang, N. Zhan, W. Wang, X. Ji, B. Chen and H. Mattoussi, Chem. Mater., 2018, 30(1), 225–238 CrossRef CAS.
- M. L. H. Green, J. Organomet. Chem., 1995, 500, 127–148 CrossRef CAS.
- N. C. Anderson, M. P. Hendricks, J. J. Choi and J. S. Owen, J. Am. Chem. Soc., 2013, 135, 18536–18548 CrossRef CAS PubMed.
- R. Grisorio, D. Quarta, A. Fiore, L. Carbone, G. P. Suranna and C. Giansante, Nanoscale Adv., 2019, 1, 3639–3646 RSC.
- Z. Hens and C. Martins, Chem. Mater., 2013, 25, 1211–1221 CrossRef CAS.
- M. Ha, A. N. Thiessen, I. V. Sergeyev, J. G. C. Veinot and V. K. Michaelis, Solid State Nucl. Magn. Reson., 2019, 100, 77–84 CrossRef CAS PubMed.
- S. A. Majetich, A. C. Carter, J. Belot and R. D. McCullough, J. Phys. Chem., 1994, 98, 13705–13710 CrossRef CAS.
- H. Virieux, M. Le Troedec, A. Cros-Gagneux, W.-S. Ojo, F. Delpech, C. Nayral, H. Martinez and B. Chaudret, J. Am. Chem. Soc., 2012, 134, 19701–19708 CrossRef CAS PubMed.
- J. Gyeong Son, E. Choi, Y. Piao, S. Woo Han and T. Geol Lee, Nanoscale, 2016, 8, 4573–4578 RSC.
- J. K. Cooper, A. M. Franco, S. Gul, C. Corrado and J. Z. Zhang, Langmuir, 2011, 27, 8486–8493 CrossRef CAS PubMed.
- L. C. Cass, M. Malicki and E. A. Weiss, Anal. Chem., 2013, 85, 6974–6979 CrossRef CAS PubMed.
- L. Liu, Z. Zhuang, T. Xie, Y.-G. Wang, J. Li, Q. Peng and Y. Li, J. Am. Chem. Soc., 2009, 131, 16423–16429 CrossRef CAS PubMed.
- Y. Yin, C. Erdonmez, S. Aloni and A. P. Alivisatos, J. Am. Chem. Soc., 2006, 128, 12671–12673 CrossRef CAS PubMed.
- B. Fritzinger, R. K. Capek, K. Lambert, J. C. Martins and Z. Hens, J. Am. Chem. Soc., 2010, 132(29), 10195–10201 CrossRef CAS PubMed.
- C. R. Bullen and P. Mulvaney, Nano Lett, 2004, 4(12), 2303–2307 CrossRef CAS.
- E. Drijvers, J. De Roo, J. J. Martins, I. Infante and Z. Hens, Chem. Mater., 2018, 30(3), 1178–1186 CrossRef CAS.
- S. Ten Brinck and I. Infante, ACS Energy Lett., 2016, 1, 1266–1272 CrossRef CAS.
- M. I. Bodnarchuk, S. C. Boehme, S. ten Brinck, C. Bernasconi, Y. Shynkarenko, F. Krieg, R. Widmer, B. Aeschlimann, D. Günther, M. V. Kovalenko and I. Infante, ACS Energy Lett., 2019, 4, 63–74 CrossRef CAS PubMed.
- R. Pascazio, F. Zaccaria, B. van Beek and I. Infante, J. Phys. Chem. C, 2022, 126, 9898–9908 CrossRef CAS PubMed.
- R. Grisorio, D. Debellis, G. P. Suranna, G. Gigli and C. Giansante, Angew. Chem., Int. Ed., 2016, 55, 6628–6633 CrossRef CAS PubMed.
- K. De Nolf, S. M. Cosseddu, J. J. Jasieniak, E. Drijvers, J. C. Martins, I. Infante and Z. Hens, J. Am. Chem. Soc., 2017, 139, 3456–3464 CrossRef CAS PubMed.
- A. A. E. Fisher, M. A. Osborne, I. J. Day and G. Lucena Alcalde, Commun. Chem., 2019, 2, 63 CrossRef.
- S. Cosseddu and I. Infante, J. Chem. Theory Comput., 2017, 13, 297–308 CrossRef CAS PubMed.
- B. Hess, C. Kutzner, D. Van Der Spoel and E. Lindahl, J. Chem. Theory Comput., 2008, 4, 435–447 CrossRef CAS PubMed.
- U. Essmann, L. Perera, M. L. Berkowitz, T. Darden, H. Lee and L. G. Pedersen, J. Chem. Phys., 1995, 103, 8577–8593 CrossRef CAS.
- Y. Shen, M. Y. Gee, R. Tan, P. J. Pellechia and A. B. Greytak, Chem. Mater., 2013, 25(14), 2838–2848 CrossRef CAS.
- S. Kilina, K. A. Velizhanin, S. Ivanov, O. V. Prezhdo and S. Tretiak, ACS Nano, 2012, 6, 6515–6524 CrossRef CAS PubMed.
- B. Omogo, J. F. Aldana and C. D. Heyes, J. Phys. Chem. C, 2013, 117, 2317–2327 CrossRef CAS PubMed.
- J. E. Tackett, Appl. Spectrosc., 1989, 43, 483–489 CrossRef CAS.
- H. A. Ellis, N. A. White, I. Hassan and R. Ahmad, J. Mol. Struct., 2002, 642, 71–76 CrossRef CAS.
- H. A. Ellis, N. A. S. White, R. A. Taylor and P. T. Maragh, J. Mol. Struct., 2005, 738, 205–210 CrossRef CAS.
- N. K. Swenson, M. A. Ratner and E. A. Weiss, J. Phys. Chem. C, 2016, 120, 6859–6868 CrossRef CAS.
- J. Zhang, H. Zhang, W. Cao, Z. Pang, J. Li, Y. Shu, C. Zhu, X. Kong, L. Wang and X. Peng, J. Am. Chem. Soc., 2019, 141, 15675–15683 CrossRef CAS PubMed.
- J. Chang, Y. Ogomi, C. Ding, Y. H. Zhang, T. Toyoda, S. Hayase, K. Katayama and Q. Shen, Phys. Chem. Chem. Phys., 2017, 19, 6358–6367 RSC.
- G. Kalyuzhny and R. W. Murray, J. Phys. Chem. B, 2005, 109, 7012–7021 CrossRef CAS PubMed.
- O. Voznyy, J. Phys. Chem. C, 2011, 115, 15927–15932 CrossRef CAS.
- M. J. Greaney, E. Couderc, J. Zhao, B. A. Nail, M. Mecklenburg, W. Thornbury, F. E. Osterloh, S. E. Bradforth and R. L. Brutchey, Chem. Mater., 2015, 27, 744–756 CrossRef CAS.
Footnotes |
| † Electronic supplementary information (ESI) available: Force Field parameters and input files; input files and geometries for the productive runs; final geometries for the production runs; input files for the data analysis of the ligand distributions and surface dynamics. See DOI: https://doi.org/10.1039/d2nr06681e |
| ‡ These authors contributed equally. |
| This journal is © The Royal Society of Chemistry 2023 |