 Open Access Article
Intracluster ligand rearrangement: an NMR-based thermodynamic study†
Daniele
Rosa-Gastaldo
 a,
Marion
Pupier
b,
Giorgi
Meshvildishvili
b,
Jasmine
Viger-Gravel
*b and
Thomas
Bürgi
 *a
*a
aDepartment of Physical Chemistry, University of Geneva, 1211 Geneva, Switzerland. E-mail: thomas.buergi@unige.ch
bDepartment of Organic Chemistry, University of Geneva, 1211 Geneva, Switzerland. E-mail: jasmine.viger-gravel@unige.ch
First published on 20th March 2023
Abstract
Ligand and metal exchange reactions are powerful methods to tailor the properties of atomically precise metal nanoclusters. Hence, a deep understanding of the mechanisms behind the dynamics that rule the ligand monolayer is crucial for its specific functionalization. Combining variable-temperature NMR experiments and dynamic-NMR simulations, we extract the thermodynamic activation parameters of a new exchange reaction: the intracluster ligand rearrangement between the two symmetry-unique positions in [Ag25(DMBT)18]− and [Ag24Au(DMBT)18]− clusters. We report for the first time that this peculiar intracluster modification does not seem to proceed via metal–sulphur bond breaking and follows a first-order rate law, being therefore a process independent from the well-described collisional ligand exchange.
Introduction
Noble metal-based nanoparticles are of great interest due to their wide range of applications in sensing,1 catalysis,2 and biology.3 Among them, the atomically precise metal nanoclusters (MNCs) category includes many molecular-like structures where organic ligands surround a metallic nucleus, and their ratio can be expressed with a defined molecular formula.4 This feature makes MNCs an interesting tool in the hands of a chemist when searching for new practical applications, as their properties can be precisely determined and are not subject to batch variability nor averaged on sample distribution. Moreover, some of their characteristics can be predicted with theoretical models.4 In the last three decades, the possibility of synthesizing MNCs of various sizes has been explored for many different metals with a variety of organic ligands (e.g., thiols, phosphines, selenols),4 considering even multi-metal5,6 or multi-ligand systems.7Interestingly, MNCs are intrinsically dynamic structures, and when in solution, they can undergo metal or ligand exchange with other species yet retain their original structure.8 This peculiarity is widely used to introduce tailored functionalities in the monolayer, making the ligand exchange reaction (LER) a powerful way to tune the MNC's properties, even using specially designed thiols.9 To date, the dynamics of the LER are mainly studied on gold MNCs.7
Some of us, based on nuclear magnetic resonance (NMR) spectroscopy and mass spectrometry (MS) analysis, have previously shown that LER can occur via two different mechanisms: through (extra) free ligands in solution or through collisions between different MNCs.10 In the first scenario, the reaction is believed to follow an SN2-like mechanism.11 Rate and resulting equilibria are affected by cluster size,12 cluster charge,13 nature and strength of the metal-thiolate bond.14 In the second scenario, which involves collisions between different MNCs and does not proceed through free-thiolate species, the interligand interactions on the MNC's monolayer play a role as well.10 Remarkably, the two mechanisms appear to occur on the same timescale. Evidence of site selectivity on the MNC between symmetry unique positions during LER has been reported.
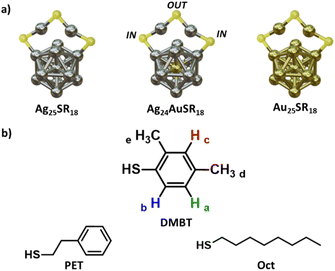
For example, Pengo and co-workers have shown on Au25(PET)18 that the two non-equivalent positions (IN and OUT, Fig. 1) can undergo ligand exchange at the same time, but at different rates that are influenced by the structure and electronic properties of the entering and leaving thiolates.15 On the same cluster, Ackerson and co-workers have demonstrated that, with a kinetic control of LER, it is possible to exchange only specific positions on a MNC selectively.16
As for the silver clusters, the only isostructural species with [Au25(PET)18]− is [Ag25(DMBT)18]−.17 This must be sought in the properties of the DMBT ligands that participate in strong H–π and π–π interactions in the monolayer, and stabilize the whole cluster structure. Similarly to its gold counterpart, a phenomenon of ligand exchange between the two symmetry-unique positions on the cluster has been reported and attributed to collisional LER, showing its temperature dependence.18 [Ag25(DMBT)18]− has a peculiar NMR spectrum with sharp signals that clearly show for each of the DMBT protons the presence of the two symmetry unique positions. For this reason, we decided to use it as a starting point to investigate further the aspects that could influence the monolayer dynamics in [M25(SR)18]− MNCs and to explore the possibility of extracting the thermodynamic activation parameters that lay behind this process. To this aim, the technique of choice is NMR spectroscopy, that allows non-destructive monitoring of the dynamics of the monolayer in solution with the possibility to change the temperature and concentration of the sample.18 Moreover, it will enable monitoring the ligand exchange of the same ligand between chemically (and magnetically) non-equivalent positions on the MNC, a task that could not be addressed with other election techniques for LER characterization like high performance liquid chromatography (HPLC) and MS techniques among others.19–21 Here, we use variable temperature (VT) 1H NMR experiments and dynamic-NMR simulations to extract for the first time the activation energy of the intracluster ligand rearrangement reaction (LRR) on [Ag25(DMBT)18]−. We show how the process seems to happen without Ag–S bond breaking and how a modification of the composition of the metal nucleus reflects on this mechanism by studying it on [Ag24Au(DMBT)18]−, [Au25(Oct)18]− and [Au25(PET)18]−. Eventually, we perform the VT experiment on [Ag24Au(DMBT)18]− at different concentrations, discovering that, on silver nanoclusters, the intracluster LRR follows a first order rate, and it is faster and independent from the collisional LER.
Results and discussion
Fig. 1a shows a schematic structure of [Ag25(DMBT)18]− which is analogous to the one of [Au25(PET)18]−. It consists of an icosahedral Ag13 core surrounded by six Ag2(DMBT)3 “staples”. The thiolates in this structure can occupy two symmetry unique positions called IN (counting twelve thiolates) and OUT (counting six thiolates), generating a double set of NMR resonances in the 1H NMR spectrum that integrate with a 2![[thin space (1/6-em)]](https://www.rsc.org/images/entities/char_2009.gif) :
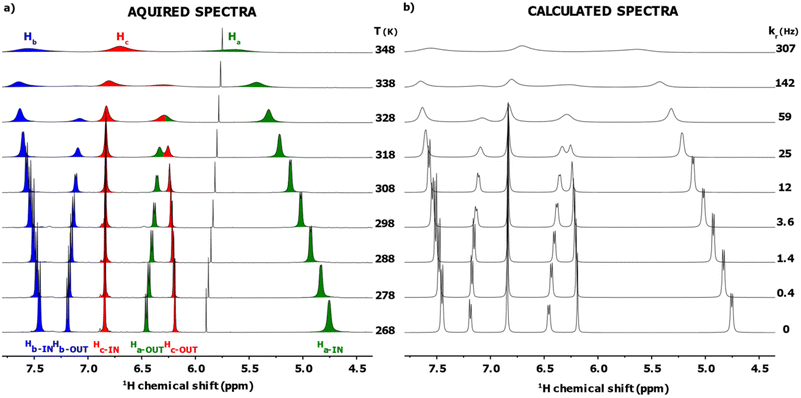
:![[thin space (1/6-em)]](https://www.rsc.org/images/entities/char_2009.gif) 1 ratio. We have previously shown, using exchange spectroscopy (EXSY), that the IN and OUT ligands of [Ag25(DMBT)18]− can be exchanged. This could happen via ligand exchange between clusters or via intracluster ligand rearrangement, which has however not been clarified yet.18Fig. 2a shows a section (4.5 to 8.0 ppm, the full spectrum is reported in Fig. S11, ESI†) of the VT 1H NMR spectra of the cluster in solution (20 mM in thiolates) in dimethylformamide-d7 (DMF-d7) acquired at 10 K intervals in the range 268–348 K. The highest temperature point of our VT experiment was chosen to avoid cluster degradation and, due to the progressive broadening at high temperatures, always to maintain the signals clearly distinguishable from the baseline, a necessary condition for an accurate fitting of the spectra. The lower limit was chosen as it has been previously shown via NMR exchange spectroscopy (EXSY) that, at 263 K, no interligand exchange is detectable for the cluster under analysis.18 In Fig. 2a, the area under the signals of each proton has been marked with a different colour to highlight the spectral changes (Ha green, Hb blue, Hc red, see scheme in Fig. 1). Taking the spectrum at 298 K as a reference, it is possible to observe peak broadening when either decreasing or increasing the temperature. In the first case (particularly visible on the Ha-IN signal), the effect can be ascribed to the increasing viscosity of the DMF-d7 solvent at lower temperatures, which lowers the speed of the tumbling motions of the MNCs leading to a faster T2 decay and consequently broader peaks. In the second case, at higher temperatures, the dynamic nature of the cluster plays a major role. During LRR (or LER), the ligands can jump from the IN to the OUT position (or vice versa), creating a fast exchange regime in the NMR timescale. Their rate constant is temperature-dependent, leading to peak shift, to hyperfine structure loss, and eventually, when the temperature is high enough (348 K), the two peaks merge into one.18
1 ratio. We have previously shown, using exchange spectroscopy (EXSY), that the IN and OUT ligands of [Ag25(DMBT)18]− can be exchanged. This could happen via ligand exchange between clusters or via intracluster ligand rearrangement, which has however not been clarified yet.18Fig. 2a shows a section (4.5 to 8.0 ppm, the full spectrum is reported in Fig. S11, ESI†) of the VT 1H NMR spectra of the cluster in solution (20 mM in thiolates) in dimethylformamide-d7 (DMF-d7) acquired at 10 K intervals in the range 268–348 K. The highest temperature point of our VT experiment was chosen to avoid cluster degradation and, due to the progressive broadening at high temperatures, always to maintain the signals clearly distinguishable from the baseline, a necessary condition for an accurate fitting of the spectra. The lower limit was chosen as it has been previously shown via NMR exchange spectroscopy (EXSY) that, at 263 K, no interligand exchange is detectable for the cluster under analysis.18 In Fig. 2a, the area under the signals of each proton has been marked with a different colour to highlight the spectral changes (Ha green, Hb blue, Hc red, see scheme in Fig. 1). Taking the spectrum at 298 K as a reference, it is possible to observe peak broadening when either decreasing or increasing the temperature. In the first case (particularly visible on the Ha-IN signal), the effect can be ascribed to the increasing viscosity of the DMF-d7 solvent at lower temperatures, which lowers the speed of the tumbling motions of the MNCs leading to a faster T2 decay and consequently broader peaks. In the second case, at higher temperatures, the dynamic nature of the cluster plays a major role. During LRR (or LER), the ligands can jump from the IN to the OUT position (or vice versa), creating a fast exchange regime in the NMR timescale. Their rate constant is temperature-dependent, leading to peak shift, to hyperfine structure loss, and eventually, when the temperature is high enough (348 K), the two peaks merge into one.18
To extract the thermodynamic parameters from this VT experiment, we needed to estimate the exchange rate constants kr at each temperature accurately. To this aim we used the Dynamic NMR (DNMR) Lineshape Fitting module present in the TopSpin® software. This program iteratively changes the relevant spectral parameters (e.g., position of the peaks, intensity, LB, coupling constant, exchange rate; see paragraph 3 in the ESI† for a more extended description of the workflow used) to calculate a simulated spectrum as best fit of the experimental 1H NMR spectrum.22,23 Since in the sample under analysis [Ag25(DMBT)18]− is not the only species showing 1H resonances (solvent peaks and the signals of the tetraoctylammonium counterion TOA+ are also present), the simulation was limited to two specific intervals: 1.75 to 2.5 ppm and 4.5 to 8.0 ppm to avoid the presence overlapping signals in the fitting region. This way, the fitting regions contain only signals involved in the exchange reaction under analysis. The calculated spectrum for each temperature is reported in Fig. 2b, together with the kr value extrapolated from the simulation. The average match on the whole VT dataset is 94 ± 2 expressed as FIT value (see paragraph 3 in the ESI† for a description of the FIT parameter and for the single spectrum values). Importantly, the value of kr found at 298 K is in agreement with the one previously found through 1H–1H EXSY spectroscopy.18
The activation energy barrier ΔG‡ of the exchange could be determined at a given temperature using the eqn (1)![[thin space (1/6-em)]](https://www.rsc.org/images/entities/char_2009.gif) 24 where Tc (in K) is the temperature at which the IN and OUT resonances of the same DMBT proton merge (coalescence temperature) and Δν is the maximum peak separation (in Hz) between the same two resonances in conditions of slow exchange and a is a constant that assumes the value of 1.914 × 10⁻² kJ mol−1 T−1.
24 where Tc (in K) is the temperature at which the IN and OUT resonances of the same DMBT proton merge (coalescence temperature) and Δν is the maximum peak separation (in Hz) between the same two resonances in conditions of slow exchange and a is a constant that assumes the value of 1.914 × 10⁻² kJ mol−1 T−1.
 | (1) |
In our case, the extremely broad peaks at high temperatures do not allow an accurate estimation of Tc and Δν appears to be dependent of temperature: most of the signals shift also if the temperature is decreased under the slow exchange regime limit (T < 268 K). Therefore, to minimize the error, we used the Eyring eqn (2) to estimate ΔG‡ using the values of kr extrapolated from the simulation at each temperature, obtaining a value of 69.5 ± 0.4 kJ mol−1 (16.6 ± 0.1 kcal mol−1).
 | (2) |
The Eyring plot (Fig. 3) was then used to calculate the enthalpy and entropy changes resulting in a ΔH‡ value of 72.8 ± 2.5 kJ mol−1 (17.4 ± 0.6 kcal mol−1) and ΔS‡ value of 11 ± 8 J mol−1 K−1 (2.5 ± 1.9 cal mol−1 K−1).
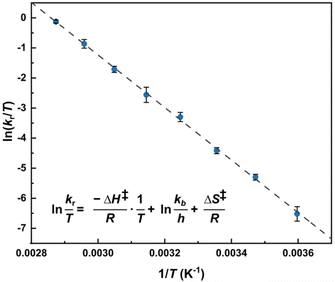 | ||
Fig. 3 Eyring equation and plot obtained for a 20.0 mM solution of [Ag25(DMBT)18]− for temperatures ranging between 278 to 348 K and the average exchange rates extrapolated from the simulated VT spectra (Fig. 2b). The regression shown in the graph is  with R2 = 0.998. Error bars represent the standard deviation (average on all the 5 DMBT proton signals). The data for each individual signal is reported in the ESI.† In the equation kb represents the Boltzmann constant, h the Planck constant, R the universal gas constant. with R2 = 0.998. Error bars represent the standard deviation (average on all the 5 DMBT proton signals). The data for each individual signal is reported in the ESI.† In the equation kb represents the Boltzmann constant, h the Planck constant, R the universal gas constant. | ||
The values are reported as average of the five spin systems (the non-equivalent proton signals of the DMBT thiolate). While the slope does not vary noticeably leading to a good estimate of the activation enthalpy, the same is not true for the intercept, that therefore leads to a considerably high error on the estimation of the activation entropy. As a last step, the activation energy Ea is calculated using eqn (3).
| Ea = ΔH‡ + RT | (3) |
The obtained activation energy value at 298 K corresponds to 75.3 ± 2.5 kJ mol−1 (18.0 ± 0.6 kcal mol−1).
The comparison of the obtained Ea with the experimentally (51.9 kcal mol−1)25 or computationally determined (52.5 kcal mol−1)26 Ag–S bond dissociation energy suggests that the thiol exchange between the IN and OUT positions occurs without the complete cleavage of Ag–S bonds. To the best of our knowledge, only theoretical values are available in the literature for the estimation of this quantity in small metal clusters: in particular it has been shown via DFT calculations on cyclic silver clusters that the fragmentation energy converges to around 40 kcal mol−1 for clusters with more than four Ag atoms.27 For the interaction between SH2 and very small metal clusters (up to three atoms only) lower values for the Ag–S bonds were calculated, although the values depended strongly on the method used.28 Interestingly, Aikens and co-workers calculated via DFT the total energy contribution of one Ag2(SH)3 staple to the [Ag25(SH)18]− cluster to be of 250 kcal mol−1, counting for an average of approximately 40 kcal mol−1 per bond.29 Furthermore, the small value of activation entropy found with our method is compatible with a transition state that does not involve a net bond breaking and retains the cluster's structure during the intracluster LRR.
To see if the intracluster LRR's thermodynamics varies with the MNC nucleus's variation, we decided to explore a second cluster: [Ag24Au(DMBT)18]−. Interestingly if [Ag25(DMBT)18]− is reacted with triphenylphosphinegold(I) chloride (AuClPPh3) over 2 h in dichloromethane at room temperature, the core silver atom undergoes selective exchange with a single gold atom.30 This perturbs the original [Ag25(DMBT)18]− structure, resulting in the modification of some cluster properties (e.g. absorption, luminescence, stability).30 The NMR spectrum presents only minor peak shifts (see Fig. S5 and S6 in the ESI for a comparison between the two clusters†). Importantly, the signals of the IN and OUT positions are still well distinguishable. Therefore, we performed the same analysis we previously exposed for [Ag25(DMBT)18]−.
The full set of spectra, together with their DNMR simulations are reported in the ESI (Fig. S14 and S15†). Table 1 summarizes the activation parameters obtained from the analysis for both MNCs investigated in this study. There is no significant difference in the values obtained from the two clusters. Overall, Ea and ΔH‡ are slightly smaller in the second case, suggesting that the energy barrier for the positional exchange is lower and the process more favourable.
At this point, it would have been interesting to analyse the [Au25(DMBT)18]− cluster. A synthesis procedure is described in the literature,17 however, no NMR spectra or single-crystal X-ray structures are available. All the attempts to synthesise it, while giving a nanocluster with matching UV absorption and MS fingerprint as the reported ones, could not achieve a purity suitable for NMR spectroscopy analysis. For this reason, we focused our studies on two well-studied gold clusters: [Au25(Oct)18]− and [Au25(PET)18]−.31–33
Fig. 4 shows the VT set of 1H NMR spectra of [Au25(Oct)18]−. In this case no positional exchange is detected between the IN and OUT sets of protons. Only the α-methylene signals of the counterion TOA+ experience a sharpening and a small shift when increasing the temperature. This can be ascribed to the progressive weakening of the electrostatic interaction between the cluster and it's counterion. The same occurs with [Au25(PET)18]− (see Fig. S21–25†).
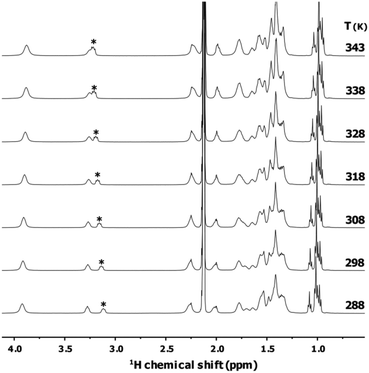 | ||
| Fig. 4 1H NMR (400 MHz) spectra in toluene-d8 of the variable temperature experiment (268 to 348 K with 10 K increments) for a 2 mM solution of [Au25(Oct)18]−. Asterisk denotes the α-methylene peak of the TOA+ counterion. The cluster is stable to the thermal treatment, in Fig. S24† is reported a comparison of two spectra of the same sample acquired at 298 K before and after the VT set of experiments. | ||
Established that in the silver clusters the ligand exchange between the two symmetry unique positions occurs with a rate comparable with the NMR timescale and the energetics involved show that no Ag–S bonds are broken in the reaction, it remains to assess whether this process relies on the dynamics of the single clusters or on effective collisions between different MNCs in solution.
In order to answer this question, we reasoned that the collisional exchange is a bimolecular process, therefore ruled by a second order rate constant. In such scenario, a variation of the cluster's concentration affects the exchange rate, as the probability of collisions varies.
We performed then a second set of VT experiments on [Ag24Au(DMBT)18]− setting the concentration at one third of the initial one (0.67 mM in thiolate), expecting a nine-fold variation of the exchange rate in case of a bimolecular process. The analysis on this set (ESI, Fig. S17, S20, Tables S6 and S9†) shows that the exchange rates of the diluted cluster at each temperature match, within the error, the ones obtained with the 2 mM sample. If we further compare these results with the ones obtained for [Ag25(DMBT)18]−, we observe no significant variation of the exchange rates even with a 30-fold increase of the cluster concentration, meaning that the intracluster LRR is a unimolecular process. We can therefore say that, in the silver clusters there is an internal rearrangement that makes the thiols constantly swing from the IN to the OUT position, with an exchange rate that is dependent on temperature and it's faster than the collisional thiol exchange already reported in the literature that happens in the minute timescale.9 This does not happen for the gold clusters and could be a possible explanation for the structural and stability difference generally found between the gold and the silver based MNCs.
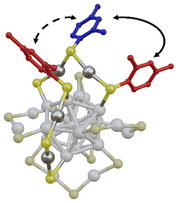
In Fig. 5 we report a schematic representation of the X-ray structure of the [Ag25(DMBT)18]− where two of the six Ag2(DMBT)3 staples are highlighted. While elucidating the precise mechanism of the LRR is beyond the scope of this manuscript, it must be noted that it can involve two different pathways: intrastaple (solid arrow in Fig. 5) where the IN (red) and OUT (blue) ligands belong to the same staple; or interstaple where the rearrangement involves an IN and OUT ligands of two neighbouring staples (dashed arrow in Fig. 5).
Conclusions
To conclude, we show that the intracluster ligand rearrangement reaction (LRR) takes place on [Ag25(DMBT)18]− and [Ag24Au(DMBT)18]− nanoclusters, and we demonstrate that the VT 1H NMR experiments are a suitable technique for the estimation of the thermodynamic activation parameters for this peculiar reaction. In both clusters, data suggest that the intracluster LRR occurs without silver–sulphur bond breaking. This observation agrees with previous studies where no free thiolates were detected during LER between two different MNCs, and with the experimental and theoretical values of Ag–S bond energy available in the literature, which are higher than the activation energy for LRR (Ea) observed in this work. While substituting the core silver atom with a gold atom does not dramatically affect the thermodynamics of the exchange, our study suggests that the intracluster LRR, if happening, is slow on the NMR timescale for Au25 based MNCs. Surprisingly, the intracluster LRR rate is not concentration dependent. This implies that, in the case of silver nanoclusters, the internal rearrangement of the thiols is faster than the exchange through the collisional pathway. Further studies are ongoing in our laboratories with different silver MNCs and ligands to strengthen the knowledge of the LRR and LER mechanisms at a molecular level. This could eventually allow a more precise synthetic control of the MNCs monolayer that will heavily benefit the applicability of such systems for real-world chemistry.Author contributions
D. R.-G. synthesized and characterized the clusters, performed the NMR experiments, analysed the data and drafted the manuscript. M. P. and G. M. performed the NMR experiments. J. V.-G. and T. B. conceptualized and supervised the work and reviewed the manuscript.Conflicts of interest
There are no conflicts to declare.Acknowledgements
The generous support by the university of Geneva and the Swiss National Science Foundation (grant 200020_192232) is kindly acknowledged.References
- K. Saha, S. S. Agasti, C. Kim, X. Li and V. M. Rotello, Chem. Rev., 2012, 112, 2739–2779 CrossRef CAS PubMed.
- D. Astruc, Chem. Rev., 2020, 120, 461–463 CrossRef CAS PubMed.
- X. R. Song, N. Goswami, H. H. Yang and J. Xie, Analyst, 2016, 141, 3126–3140 RSC.
- I. Chakraborty and T. Pradeep, Chem. Rev., 2017, 117, 8208–8271 CrossRef CAS PubMed.
- A. Ghosh, O. F. Mohammed and O. M. Bakr, Acc. Chem. Res., 2018, 51, 3094–3103 CrossRef CAS PubMed.
- X. Kang, Y. Li, M. Zhu and R. Jin, Chem. Soc. Rev., 2020, 49, 6443–6514 RSC.
- Y. Wang and T. Burgi, Nanoscale Adv., 2021, 3, 2710–2727 RSC.
- K. R. Krishnadas, A. Baksi, A. Ghosh, G. Natarajan and T. Pradeep, Nat. Commun., 2016, 7, 13447 CrossRef CAS PubMed.
- B. Zhang, J. Chen, Y. Cao, O. J. H. Chai and J. Xie, Small, 2021, 17, 2004381 CrossRef CAS PubMed.
- G. Salassa, A. Sels, F. Mancin and T. Burgi, ACS Nano, 2017, 11, 12609–12614 CrossRef CAS PubMed.
- C. L. Heinecke, T. W. Ni, S. Malola, V. Makinen, O. A. Wong, H. Hakkinen and C. J. Ackerson, J. Am. Chem. Soc., 2012, 134, 13316–13322 CrossRef CAS PubMed.
- R. Guo, Y. Song, G. Wang and R. W. Murray, J. Am. Chem. Soc., 2005, 127, 2752–2757 CrossRef CAS PubMed.
- Y. Song and R. W. Murray, J. Am. Chem. Soc., 2002, 124, 7096–7102 CrossRef CAS PubMed.
- N. Yan, N. Xia and Z. Wu, Small, 2021, 17, 2000609 CrossRef CAS PubMed.
- P. Pengo, C. Bazzo, M. Boccalon and L. Pasquato, Chem. Commun., 2015, 51, 3204–3207 RSC.
- T. W. Ni, M. A. Tofanelli, B. D. Phillips and C. J. Ackerson, Inorg. Chem., 2014, 53, 6500–6502 CrossRef CAS PubMed.
- C. P. Joshi, M. S. Bootharaju, M. J. Alhilaly and O. M. Bakr, J. Am. Chem. Soc., 2015, 137, 11578–11581 CrossRef CAS PubMed.
- G. Salassa, K. R. Krishnadas, M. Pupier, J. Viger-Gravel and T. Bürgi, J. Phys. Chem. C, 2021, 125, 2524–2530 CrossRef CAS.
- K. Kumaranchira Ramankutty and T. Buergi, Nanoscale, 2022, 14, 16415–16426 RSC.
- S. Knoppe, A. C. Dharmaratne, E. Schreiner, A. Dass and T. Bürgi, J. Am. Chem. Soc., 2010, 132, 16783–16789 CrossRef CAS PubMed.
- Y. Negishi, H. Horihata, A. Ebina, S. Miyajima, M. Nakamoto, A. Ikeda, T. Kawawaki and S. Hossain, Chem. Sci., 2022, 13, 5546–5556 RSC.
- R. S. Dumont, S. Jain and A. Bain, J. Chem. Phys., 1997, 106, 5928–5936 CrossRef.
- R. S. Dumont, P. Hazendonk and A. Bain, J. Chem. Phys., 2000, 113, 3270–3281 CrossRef CAS.
- K. D. Zimmer, R. Shoemaker and R. R. Ruminski, Inorg. Chim. Acta, 2006, 359, 1478–1484 CrossRef CAS.
- Y. R. Luo, Comprehensive Handbook of Chemical Bond Energies, CRC Press, 2007 Search PubMed.
- L. Wu, S. Y. Tang and S. Zhou, ACS Omega, 2021, 6, 34904–34911 CrossRef CAS PubMed.
- K. A. Kacprzak, O. Lopez-Acevedo, H. Häkkinen and H. Grönbeck, J. Phys. Chem. C, 2010, 114, 13571–13576 CrossRef CAS.
- A. H. Pakiari and Z. Jamshidi, J. Phys. Chem. A, 2010, 114, 9212–9221 CrossRef CAS PubMed.
- B. M. Barngrover and C. M. Aikens, J. Phys. Chem. A, 2011, 115, 11818–11823 CrossRef CAS PubMed.
- M. S. Bootharaju, C. P. Joshi, M. R. Parida, O. F. Mohammed and O. M. Bakr, Angew. Chem., Int. Ed., 2016, 55, 922–926 CrossRef CAS PubMed.
- A. Venzo, S. Antonello, J. A. Gascón, I. Guryanov, R. D. Leapman, N. V. Perera, A. Sousa, M. Zamuner, A. Zanella and F. Maran, Anal. Chem., 2011, 83, 6355–6362 CrossRef CAS PubMed.
- C. B. Collins, M. A. Tofanelli, M. F. Crook, B. D. Phillips and C. J. Ackerson, RSC Adv., 2017, 7, 45061–45065 RSC.
- M. De Nardi, S. Antonello, D. E. Jiang, F. Pan, K. Rissanen, M. Ruzzi, A. Venzo, A. Zoleo and F. Maran, ACS Nano, 2014, 8, 8505–8512 CrossRef CAS PubMed.
Footnote |
| † Electronic supplementary information (ESI) available: Cluster characterization, details on the DNMR simulations and additional NMR experiments. See DOI: https://doi.org/10.1039/d3nr00360d. The original data leading to this publication can be found at https://doi.org/10.5281/zenodo.7760401 |
| This journal is © The Royal Society of Chemistry 2023 |

