 Open Access Article
Creative Commons Attribution 3.0 Unported Licence
Controlling local thermal gradients at molecular scales with Janus nanoheaters†
Mingxuan
Jiang
,
Aidan
Chapman
 ,
Juan D.
Olarte-Plata
 and
Fernando
Bresme
 *
*
Department of Chemistry, Molecular Sciences Research Hub, Imperial College London, London, UK. E-mail: f.bresme@imperial.ac.uk; Tel: +44 (0)207 594 5886
First published on 5th May 2023
Abstract
The generation and control of heat transport with nanoparticles is an essential objective of thermoplasmonics. Janus nanoparticles consisting of dissimilar materials with contrasting interfacial Kapitza conductance provide a route to control heat transport at the nanoscale. Here we use the recently introduced Atomistic Nodal Approach to map the surface temperature and Kapitza conductance of Janus nanoparticles to individual atoms. We show that the transition in the thermal transport properties between the hydrophobic and hydrophilic interfaces is exceptionally abrupt, occurring over length scales below 1 nm. We demonstrate the generality of this result using coarse-grained and all-atom models of gold nanoparticles. Further, we show how this behaviour provides a route to sustain significant temperature differences, on the order of tens of degrees for μW heat rates, between adjacent molecular layers attached to heated gold nanoparticles. Our work provides fundamental insight into nanoscale heat transport and a principle to design heterogeneous Janus nanoparticles for thermal transport applications.
1. Introduction
Thermoplasmonics is emerging as an important research area with applications in medicine, catalysis and imaging.1 Thermoplasmonics relies on heating plasmonic materials, such as metallic nanoparticles, which are very efficient at converting light into heat,2 leading to a local temperature increase on the order of tens of degrees over nanoscale length scales.3 One challenge in thermoplasmonics is achieving spatial control of heating, namely, channelling heat in specific directions at the nanoscale. Spatial control could bring benefits in applications in materials science and medicine.4–12 In particular, modest temperature changes of a few to tens of degrees (temperature increase above 41–50 °C)4,12 trigger biological process, such as protein unfolding or DNA denaturation. Loss of protein function is already observed at 47 °C, and cell necrosis has been observed at ∼50 °C.13 Creating localized temperature differences of this size with nanoparticles has the potential to destroy cancer cells in photothermal therapy applications.13,14Recently, we demonstrated that Janus nanoparticles (JNPs) consisting of nano-patches with different wettabilities provide a route to achieving spatial control of nanoscale heating.15 Janus nanoparticles attract significant interest16 as they can be synthesized using a wide range of materials (dielectric, metallic or magnetic) as well as different sizes and shapes.17–20 Hence, JNPs are versatile structures whose properties can be tuned to target specific applications. Using non-equilibrium molecular dynamics simulations and classical heat transfer theory, we showed that adjusting the interfacial Kapitza21 resistance of JNP patches provides an approach to spatially control heat transfer at the nanoscale.
Theoretical methods, particularly computer simulations, provide important information to support the rational design of nanomaterials. This theoretical input is significant in the context of nanoplasmonics, as heating the fluid surrounding the nanomaterial requires energy transfer across nanoscale interfaces, with the interfacial Kapitza resistance21 influencing the heat flowing through the interface. For nanoparticles, the Kapitza resistance impacts the heating process and the dynamic behaviour of the transient temperature profiles.22 The traditional theories of interfacial heat transport often focus on bulk properties, ignoring the interfacial structure.21 However, local interfacial changes are important23 and must be incorporated in theoretical approaches.24–26 The behaviour of the Kapitza conductance at nanometre scales is very relevant to explain heat transport in heterogeneous materials, such as JNPs, since the interfacial conductance must change when moving from one component of a JNP, α, to the other component, β. These transition of the heat transport properties takes place across a three-phase “line” that separates the components α, β and the solvent. However, the characteristic length for the transition in heat transport properties is unknown. Quantifying this length scale can provide insight into designing heterogeneous nanoparticles for plasmonic heating by combining materials of different compositions, and using the properties of different homogeneous bulk materials as input.
In this work, we quantify, with atomistic resolution, the interfacial Kapitza conductance of Janus nanoparticles consisting of hemispheres with contrasting hydrophobicities. To perform our analysis, we use the Atomistic Nodal Approach (ANA) introduced recently to quantify local changes in the thermal transport of nanoscale materials.27 We demonstrate that the interfacial Kapitza conductance features a sharp transition (<1 nm), at the boundary separating the two components of the JNPs. This result opens new avenues to design Janus nanoheaters for spatial control of heat transport, using the Kapitza conductance of the homogeneous materials as input. We illustrate the generality of our conclusions by performing non-equilibrium simulations of coarse-grained and all-atom models of metallic nanoparticles.
2. Janus nanoparticle models
We have spatially resolved the interfacial Kapitza conductance of spherical and rod-shaped Janus nanoparticles (see Fig. 1). We modelled the particles using coarse-grained models, which reproduce the general thermal transport behaviour of gold nanoparticles coated with passivating layers of different hydrophilicity (see ref. 15). To build the coarse grained model we target interfacial properties, as these are relevant in interfacial thermal transport, and adjust the particle-fluid interactions to reproduce experimental contact angles. The nanoparticles feature several facets (see Fig. 1), resulting in distinctive Kapitza conductances (see Results, section 3, below). The spherical particle had a diameter of 40σ, which corresponds to a diameter of ∼14 nm, assuming a typical Lennard-Jones atomic diameter σ = 0.35 nm, a typical value used for converting between Lennard-Jones and real units. The nanorod had a diameter of (9.7σ) (3.4 nm) and a length of 20σ (7 nm). Metallic nanoparticles of these sizes feature photothermal energy conversion.28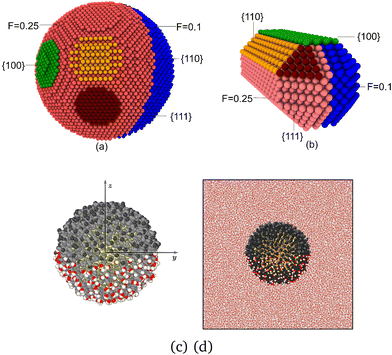 | ||
| Fig. 1 Snapshots of coarse grained models of (a) Janus spherical particle and (b) Janus nanorod, highlighting the different facets. The lyophobic (F = 0.1) and lyophilic (F = 0.25) sides are coloured in salmon and blue, respectively. The different facets, {100}, {110} and {111} are coloured in green, orange and dark red, respectively. (c) Snapshot of the atomistic Janus gold nanoparticle coated with 6-mercapto-1-hexanol (bottom side) and 1-octanethiol (top side) ligands. CH2 and CH3 are coloured in grey and black, respectively, and sulfur and gold in yellow. The oxygen and hydrogen atoms in the OH group in 6-mercapto-1-hexanol are coloured in red and white, respectively. (d) Snapshot of the “realistic” Janus Nanoparticle showing the full simulation box and water molecules. Water molecules from the front 40 Å have been removed. Snapshots were produced with OVITO.31 | ||
We defined two regions in the coarse-grained nanoparticles, interacting differently with the solvent, to mimic JNPs coated with hydrophilic and hydrophobic layers. The particle-solvent interactions were adjusted to reproduce the behaviour of JNP featuring regions with significantly different wettabilities. The interactions were described using the spherically truncated and shifted Lennard-Jones (LJ) potential (see Methods). We adjusted the nanoparticle solvent interactions, targeting contact angles of ∼130° (hydrophobic) and ∼0° (full wetting), for the two JNP hemispheres, respectively. The geometry of our model is similar to experimental JNP made of polystyrene half-coated with a layer of gold,29 while the contact angle for our phobic JNP targets the realistic nanoparticle investigated in section 3.2. The contact angle of the phobic layer of this nanoparticle has been quantified using neutron reflectivity and computer simulations.30
The results of the coarse grained JNP are presented in reduced units of density ρ* = ρσ3, where ρ is the number density, and temperature, T* = kBT/ε, where ε is the solvent–solvent interaction strength (see Methods in section 5 for more details.
To simulate the plasmonic heating, we applied a hot thermostat in the central region of the nanoparticles and a cold thermostat far from the JNP surface in order to reach a stationary temperature profile (see Methods, section 5). The stationary approach offers a good signal-to-noise ratio and the setup mimics the experimental system, where the particle and the fluid are, naturally, at different temperatures. We computed the interfacial thermal conductance projected on each atom, using the recently introduced Atomistic Nodal Approach,27 which provides a full spatial resolution of the interfacial Kapitza resistance, RK, defined by,
 | (1) |
We also investigated the temperature profile around all-atom spherical (∼3 nm radius) gold nanoparticles coated with two thiol ligands of different hydrophilicities, 6-mercapto-1-hexanol and 1-octanethiol in a 1![[thin space (1/6-em)]](https://www.rsc.org/images/entities/char_2009.gif) :
:![[thin space (1/6-em)]](https://www.rsc.org/images/entities/char_2009.gif) 1 ratio, with each half of the particle covered with one type of ligand. This coating results in two regions of contrasting hydrophilicity, with contact angles 38.4 ± 2° for 6-mercapto-1-hexanol and 121 ± 2° for 1-octanethiol (see ref. 15 and 32). The models employed here reproduce the contact angles measured with neutron reflectivity experiments (see ref. 32). The JNP heating was achieved by thermostatting all the gold atoms every timestep and setting a cold boundary far from the particle surface to obtain a stationary temperature profile. See Methods and ref. 15 for further simulation details.
1 ratio, with each half of the particle covered with one type of ligand. This coating results in two regions of contrasting hydrophilicity, with contact angles 38.4 ± 2° for 6-mercapto-1-hexanol and 121 ± 2° for 1-octanethiol (see ref. 15 and 32). The models employed here reproduce the contact angles measured with neutron reflectivity experiments (see ref. 32). The JNP heating was achieved by thermostatting all the gold atoms every timestep and setting a cold boundary far from the particle surface to obtain a stationary temperature profile. See Methods and ref. 15 for further simulation details.
Before we discuss our results we recall that the mechanism of heat generation of the realistic nanoparticle investigated here, relies on light absorption at the plasmon resonance wavelength, for which the Mie's theory can be applied. The heat generated by the nanoparticle depends on the dielectric properties of the nanoparticle, and the high-frequency dielectric constant of the medium. Although the surface properties of the nanoparticle might influence the heat generation due to changes in the effective dielectric constant, we expect this change to be small, given the small width of the coating layer studied here, particularly in the context of larger nanoparticle with characteristic radii in 10's of nm lengthscale. Furthermore, the difference between the high-frequency dielectric constant of water (1.77) and the alkane layer (2.2) is not large. The Mie theory should be applicable for coated materials that exhibit plasmonic properties at the applied wavelengths.
We consider here nanoparticles with sizes approaching 10 nm diameter. According to Mie's theory, the heat rate will increase with particle volume, reaching a maximum in the absorption efficiency at ~40 nm radius. Furthermore, the interfacial thermal conductance varies with particle curvature and size,33 as the ITC depends on the local coordination of the nanoparticle surface atoms.27 Since the nanoparticle composition determines the anisotropy of heat transport discussed here, the discussions presented below hold for larger nanoparticles too.
3. Results
3.1. Coarse grained models of spherical Janus nanoparticles
We performed simulations of coarse-grained JNPs with contrasting lyophilicity. As discussed in section 2, the two hemispheres of the JNP feature different wettabilities, with contact angles of ∼130° and ∼0°. The contact angle corresponding to lyophobic conditions is similar to that of gold nanoparticles fully coated with 1-octanethiol ligands (see ref. 32 and also results below in section 3.2).We show in Fig. 2b the radial density profiles of the lyophobic and lyophilic regions of the nanoparticle using a hemispherical sampling restricted to each unique atom type on the nanoparticle surface. These plots highlight the contrasting interactions of both parts of the JNP with the solvent. There is a significant depletion of the solvent on the lyophobic side and stronger solvent adsorption on the lyophilic side (see Fig. 2b). The oscillations in the density profile serve as an estimate of the correlation length associated with the fluid structuring around the nanoparticle. The characteristic decay length of the minima and maxima of the density profiles can be fitted to an exponential function, giving a decay length of 1.1σ for the lyophobic region and 1σ for the lyophilic region. This result shows that the structuring of the liquid induced by the nanoparticle surface decays in a distance much shorter than the JNP diameter.
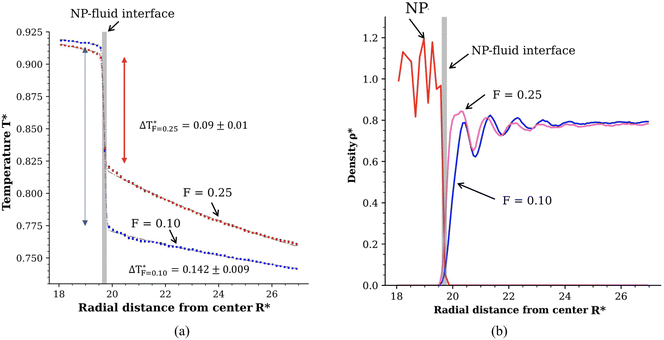 | ||
| Fig. 2 Results obtained with the radial bulk binning method: (a) radial temperature of both the lyophilic and lyophobic parts of the Janus NP follows a 1/R dependence, consistent with the solution of the continuum heat diffusion equation.27 The dashed lines represent the fitting of the data to an error function that also fits the interfacial temperature jump (see main text for a discussion). The vertical blue and arrows show the temperature jump associated with the interfacial thermal conductance. Numerical values for the temperature jump are shown close to the lyophobic and lyophilic profiles. (b) Radial density profile of the NP and fluid. The vertical grey lines in panels (a) and (b) show the location of the nanoparticle-fluid interface. The quantities are given in reduced units, see Methods in section 5. | ||
The contrasting particle-solvent interactions on both sides of the JNP lead to different temperature profiles (see Fig. 2a). The temperature difference of the solvent in contact with either the lyophilic or lyophobic sides is, corresponding to ∼8 K using ε/kB = 120 K as a conversion factor. The heat fluxes at the two surfaces of the nanoparticle using eqn (11) (also see Fig. 1 in the ESI†) are  and
and  for the lyophilic and lyophobic regions, respectively. These heat fluxes correspond to heat rates of
 ![[Q with combining dot above]](https://www.rsc.org/images/entities/i_char_0051_0307.gif) * = 296 and
* = 296 and ![[Q with combining dot above]](https://www.rsc.org/images/entities/i_char_0051_0307.gif) * = 140, or 0.2 μW and 0.09 μW when converting to SI units. These heat rates are very different and lead to solvent temperature increases (with respect to the bulk solvent temperature T* = 0.7) of 0.12 for the philic side, and 0.075 in the lyophobic side, corresponding to ∼14 K and 9 K, respectively. Hence, the wettability properties of this JNP results in a substantial temperature contrast between the hot and cold regions. For the heat rates investigated here, the temperature increase of the solvent at the surface is consistent with data obtained from photothermal microscopy experiments of gold nanoparticles.34 A temperature increase of about 10–20 K, similar to the one we find here, can be achieved using gold nanoparticles of radius 20–30 nm, illuminated with a light intensity of 105 W cm−2 (see e.g. ref. 15 and 35).
* = 140, or 0.2 μW and 0.09 μW when converting to SI units. These heat rates are very different and lead to solvent temperature increases (with respect to the bulk solvent temperature T* = 0.7) of 0.12 for the philic side, and 0.075 in the lyophobic side, corresponding to ∼14 K and 9 K, respectively. Hence, the wettability properties of this JNP results in a substantial temperature contrast between the hot and cold regions. For the heat rates investigated here, the temperature increase of the solvent at the surface is consistent with data obtained from photothermal microscopy experiments of gold nanoparticles.34 A temperature increase of about 10–20 K, similar to the one we find here, can be achieved using gold nanoparticles of radius 20–30 nm, illuminated with a light intensity of 105 W cm−2 (see e.g. ref. 15 and 35).
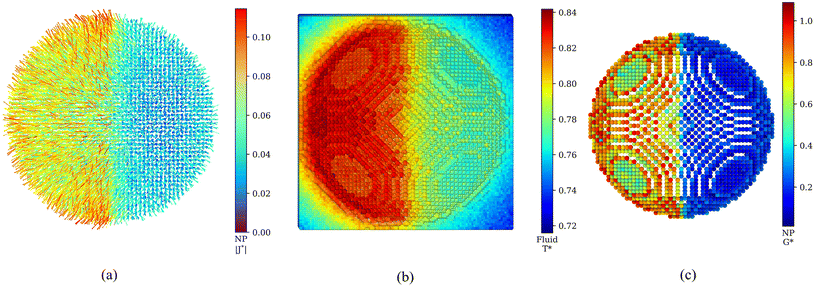
We have discussed the radial average properties, as it is commonly done in the existing literature on nanoparticle heat transport. In the following, we use the ANA introduced in ref. 27 to analyze local heat transport and interfacial thermal conductance. The ANA method projects the interfacial temperature and heat flux on the atomic coordinates of the surface atoms in the nanoparticle. Hence, the ANA approach can access local heat transport properties at angstrom resolution. The ANA method reveals a considerable anisotropy in the heat flux of the lyophilic and lyophobic parts of the JNP (see Fig. 3a), and consistently with our radial profile analysis (see Fig. 1 in the ESI† and discussion above), it shows a significantly higher heat flux flowing through the lyophilic side. Notably, the transition of the heat flux from the lyophobic to the lyophilic region appears to be very sharp. Considering the scale of the figure, we anticipate that the transition will occur in a few atomic diameters.
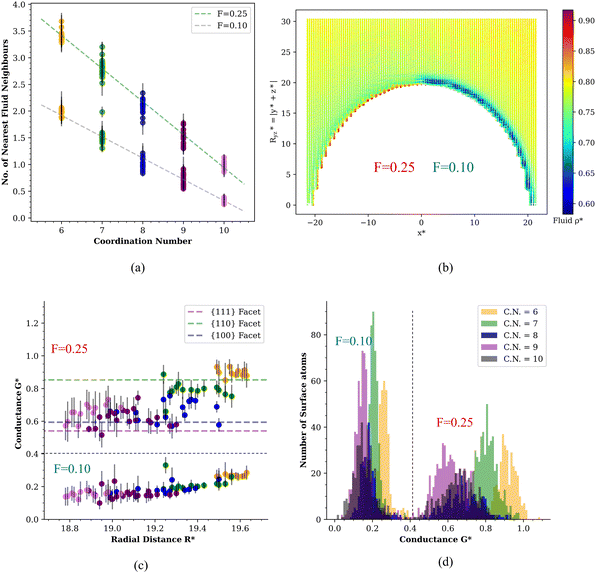
We analyzed the transition of the thermal transport properties across the lyophobic-lyophilic-fluid three-phase region by computing the local temperatures of the fluid solvating the JNP (Fig. 3b), and the local atomic thermal conductances (Fig. 3c). Using the ANA method, we demonstrate that the interfacial thermal conductance changes rapidly between the two regions of the JNP. This rapid transition shows that the lyophobic/lyophilic interface does not noticeably modify the bulk interfacial conductance of each type of material outside from the three-phase boundary (see Fig. 3c). The sharp changes are reflected in the temperature of the solvation layer, which transitions rapidly from an average higher temperature (philic) to a lower (phobic) temperature (see Fig. 3b). The interactions of the solvent with the JNP are stronger with the lyophilic than the lyophobic side, leading to a heterogeneous interfacial conductance (see Fig. 3c), with an average conductance of the lyophobic surface GK = 0.189 ± 0.006, significantly lower than the conductance of the lyophilic side, GK = 0.78 ± 0.01.
Closer inspection of Fig. 3c shows that the heat transport across the nanoparticle surface for the lyophilic hemisphere is not homogeneous either, with the interfacial conductance of facets being generally lower than the computed conductance for edges. This result shows that real nanoparticles, which are not perfectly smooth, will also feature varying interfacial conductances depending on the surface location. These local changes of the interfacial thermal conductance are correlated with the local coordination number of the atoms in the JNP surface. This notion is illustrated in the correlation plot between the number of nearest solvent neighbours from a given atom located at the JNP surface and the coordination of that atom with other atoms in the JNP (see Fig. 4a). The functional dependence of these two coordination numbers can be fitted to the following equation:
| N(1) = mNCN + N(1)CN=0 | (2) |
We now quantify the length scale of the transition of the interfacial conductance from the lyophilic to the lyophobic region. We computed the local Voronoi density of the surface atoms in the JNP to gain information on the local atomic density at the JNP surface. The Voronoi density is defined as the inverse of the Voronoi polyhedron volume associated with a specific atom on the JNP surface. The Voronoi density increases with the surface coordination number (see Fig. 3 in the ESI†). The density is higher for the lyophilic than the lyophobic part, reflecting the solvent depletion in the latter. We projected the local Voronoi densities along an arclength of radius R* = 20 from the centre of the JNP. The arclength is given by L = θR, where θ is the angle defining the path along the latitude of the JNP. The path crosses the boundaries between the lyophobic and lyophilic regions, i.e. the three-phase line. To model the transition of the Voronoi density along the arclength path, we used the equation:
 | (3) |
 | (4) |
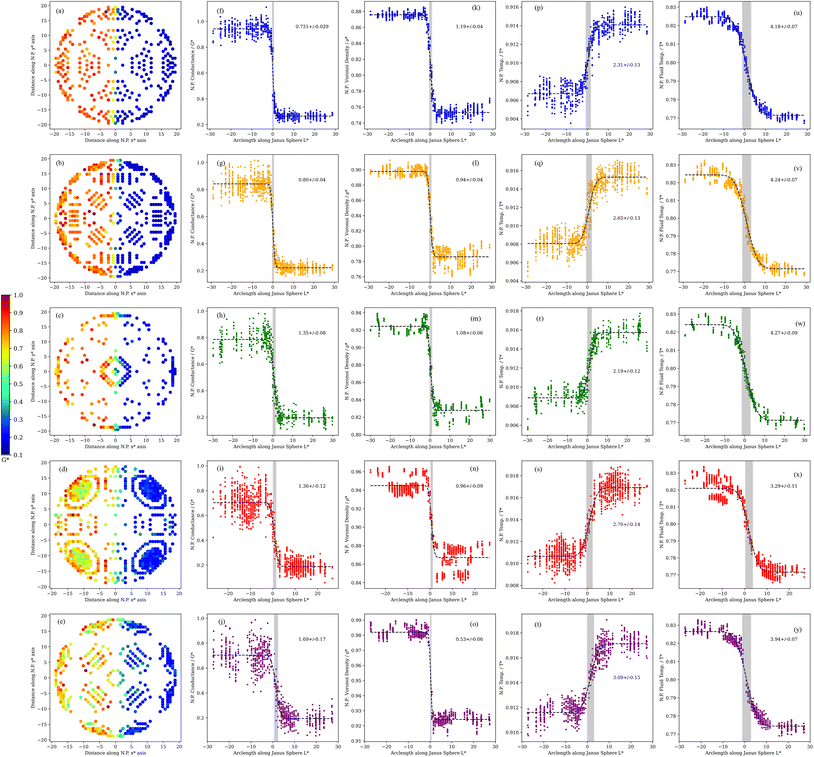 | ||
| Fig. 5 (a–e) Variation of the ITC along the surface of the spherical N.P. Atoms along the surface were classified according to their coordination number (C.N.). Variation of the ITC (f–j), Voronoi density (k–o) and temperature at the JNP surface (p–t) and fluid solvation shell temperature (u–y), along the arc length path, for different coordination numbers (C.N.) ranging from 6 (top panels) to 10 (bottom panels). The lines represent a fitting of the simulated data to eqn (3). The numbers inside each panel represent the computed interfacial width, σ. | ||
We show in Fig. 5 the Voronoi density as a function of the arc length, L*, for surface atoms featuring different coordination numbers. The Voronoi density is constant away from the lyophobic/philic interface, with higher values on the lyophilic side. The density depends strongly on the atom coordination, reflecting different structural environments, with larger coordination resulting in lower densities. Irrespective of the C.N., the widths characterising the transition across the three-phase line, are remarkably short, of the order of one atomic diameter, similar to the decay length computed for the decay of the fluid density from the JNP surface (see discussion above and Fig. 2b).
We repeated the analysis for the interfacial thermal conductance, the nanoparticle surface temperature, and the temperature of the solvent in contact with the JNP. These calculations confirm the transition is very sharp (see Fig. 5), with typical widths of 1–3 σ, again of the order of the correlation length that quantifies the structural perturbations induced by the JNP on the solvent. The larger values reflect the average longer distance of higher coordinated atoms (C.N. = 10) to the three-phase line. The length scale defining the transition in thermal transport, δ, would be tiny for large JNPs with radii, e.g. 50 nm, which are often used in nanoplasmonic applications. We, therefore, conclude that the interfacial thermal transport will be defined almost entirely by the bulk interfacial thermal conductances of the two materials used to make the JNP, with coupling confined to the three-phase region.
3.2. Janus gold nanoparticles functionalised with alkanethiol coatings
We investigate the transition in thermal transport from a lyophobic to a lyophilic region in gold Janus nanoparticles coated with heterogeneous alkyl thiolate layers. Thiolates offer great versatility in manufacturing Janus nanoparticles using a homogeneous metallic nanoparticle core. Fig. 1c shows the nanoparticles, with half of the surface coated with hydrophilic ligands and the other part with hydrophobic ligands, which feature contrasting contact angles when in contact with water (see Methods, section 5, for specific values).In a previous work (ref. 15) on this system, we observed two temperature discontinuities in the radial direction on both the hydrophilic and hydrophobic sides of the nanoparticle, one due to the gold-ligand interface, and one due to the ligand–solvent interface. The heat fluxes on the two halves of the systems are not equal due to the different ligand head-group-water conductances, with a lower heat flux flowing through the hydrophobic half of the system. Consequently, due to both gold-ligand interfaces having similar conductances,15 the temperature in the hydrophobic ligands is higher than in the hydrophilic ligands. Contrarily, the water around the hydrophilic ligands is at a higher temperature than around the hydrophobic ligands due to the much higher thermal conductance of the former (Gk ≳ 1000 MW K−1 m−2 for hydrophilic vs. Gk = 142 MW K−1 m−2 for hydrophobic).15 The temperature jump obtained for the gold nanoparticles investigated here is consistent with the interfacial thermal conductance inferred from thermoreflectance experiments of self-assembled monolayers adsorbed on gold surfaces.37 We estimate interfacial thermal conductances of 260 W K−1 m−2 (see ref. 15), which are of the order of the conductance reported for hydrophilic self-assembled monolayers 100–200 MW K−1 m−2. Larger thermal conductances are expected for nanoparticles, due to curvature effects and change in local atom coordination (see ref. 27 and 33).
In Fig. 6 we show the two-dimensional temperature profile around the coated Janus nanoparticle, by cutting a 10 Å thick slice in which the nanoparticle (which has a radius of 25 Å) is approximately cylindrical, and averaging the temperatures of all atoms within 10 Å × 2 Å × 2 Å cuboids within this slab. From this visualization, we observe the variation in the temperature across the y–z plane. The hydrophobic ligands and the water near the hydrophilic ligands are hotter than their counterparts on the other side of the system, matching the previously observed result. The 2D profile highlights the very different temperature of the hydrophobic and hydrophilic ligands, even at very short distances from the three-phase line. This data suggests that the adsorbed layers feature a nearly homogeneous temperature all around each hemisphere.
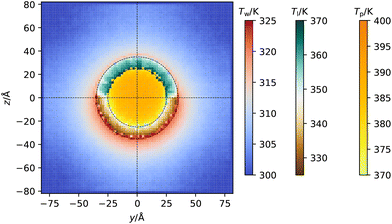 | ||
| Fig. 6 Spatially varying temperature in the y–z plane (see Fig. 1 for information on the axes) in a slab of thickness 10 Å that cuts the centre of the nanoparticle. Three different colour scales are used to highlight the different temperature ranges covered by each component of the system, which from left to right are the temperature of the water (Tw), ligands (Tl) and gold core (Tp). | ||
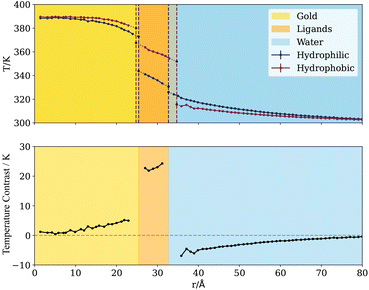
Fig. 7a and b show the temperature of the ligands and water, respectively, projected along the arc length crossing the three-phase line (with zero taken to be the pole of the hydrophobic side) and for several radii. Much like the coarse-grained nanoparticles, we find a sharp change in temperature at the three-phase line, which is observed for both water and the ligands. For the latter, the only difference in chemical composition is the terminal groups, and this is enough to bias significantly the heat rate flowing through hydrophobic or hydrophilic regions. The temperature difference is significant, over 20 K between the hydrophilic and hydrophobic ligands for a total heat rate of ≈1 μW. This “temperature contrast” and transition persists throughout the entire ligand chain (see Fig. 8, bottom). Fig. 8 also shows that the temperature contrast of water next to the nanoparticle approaches 10 K, hence a significant difference in temperature relevant to hyperthermia and thermal therapy applications.12
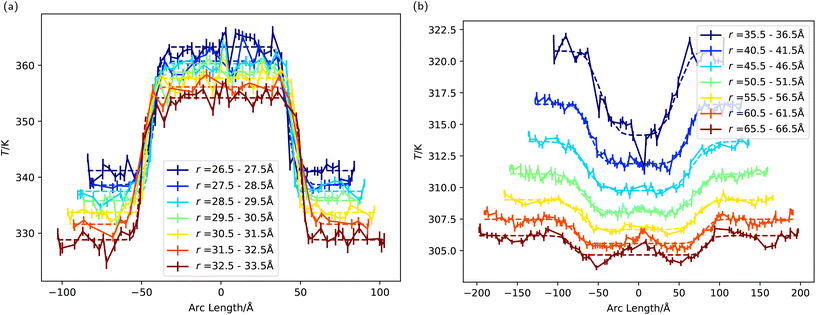 | ||
| Fig. 7 (a) The temperature of the ligands as a function of arc length, with an angle of zero corresponding to the direction parallel to the z axis. These temperature profiles were fitted to eqn (5) (see main text). (b) The water temperature as a function of arc length, with an angle of zero corresponding to the direction parallel to the z axis. | ||
The change in the temperature has been quantified by fitting the arc length profiles to a symmetrical version of eqn (3),
 | (5) |
We quantified the temperature transition, δ, across the three-phase by fitting our temperature profiles to eqn (5). The fittings (see Table 2 in the ESI† for numerical data) on radial temperature profiles (dashed lines in Fig. 7a and b) gives the interfacial thicknesses for the ligands δ ≃ 3.1–5.2 Å, and for water in contact with the JNP surface, δ = 6.9 Å. Using δ = 3 Å as a unit length defining the diameter of one water molecule, these values correspond to δ = 1–1.7σ for the ligands, and δ = 2.3σ for the solvent. These values are of the same order as those reported in the previous section using the coarse grained JNP. Such abrupt temperature changes between neighbouring chains results in strong thermal gradients (≈40 K nm−1) in the direction tangential to the particle surface, which is significantly stronger than the imposed radial gradient.
We observe a significant temperature contrast in the water phase at distances ∼10 Å away from the surface before the difference dies away at the thermostatting cold boundary far from the particle surface (see δT for water in Fig. 8-bottom panel). The impact of the anisotropic heat flux generated by the JNP is visible at these long distances, with persistently sharp transitions in the solvent temperature, e.g. δ ∼ 12 and δ ∼ 15 Å at r = 41 (5 Å from the NP surface) and 51 Å (10 Å from the NP surface), respectively (see ESI Table 2†). Overall, our results for these complex nanoparticles with molecular coatings support the generality of our conclusions regarding the length-scale of heat transport transitions in heterogeneous nanoparticles. Below, we investigate the impact of particle geometry in determining the transition length scale.
The presence of fast rotational Brownian motion could reduce or eliminate the temperature anisotropy of the solvent around the nanoparticle, provided the time scale for rotation is fast compared with the characteristic time scale for heat transfer from the nanoparticle to the solvent. Therefore, estimating the characteristic timescale to set up the anisotropic thermal gradient in the solvent layer around the nanoparticle is instructive. Setting the thermal gradient in a solvent layer of thickness similar to the typical size of the nanoparticle diameter considered in this section (∼6 nm) requires ∼0.25 ns (using the experimental thermal diffusivity of water 1.44 × 10⁻⁷ m2 s−1). The rotational time, assuming Debye–Stokes–Einstein behaviour, would be ∼27 ns, hence a much longer time scale. This time would increase with the radius of the nanoparticle as R3, reaching values of ∼μs for particles of 20 nm radius. Hence, the anisotropic thermal gradient would generally be set up at a time scale much shorter than the one required for the particle to undergo a full rotation. Therefore the JNP is expected to generate an anisotropic temperature distribution around itself even under free motion conditions.
The existence of an anisotropic thermal gradient in time scales much shorter than the rotational diffusion time could influence the translational motion of the nanoparticles at short times, rectifying the motion in a similar way to what is observed in active nano or microparticles propelled anisotropically, e.g. by chemotaxis.38
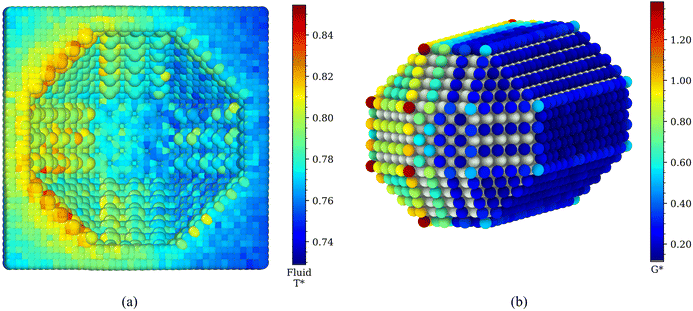
3.3. Janus nanorods
We investigated the impact of the JNP geometry on the thermal transport transition across the three-phase boundary by computing the interfacial heat transport of Janus nanorods (see Fig. 1b). Fig. 9a represents the temperature distribution of the solvent around the nanorod, showing significant differences between the lyophilic or lyophobic sides, with the lyophilic region being ∼0.038 (4.6 K) hotter than the lyophobic one (see also temperature profiles in ESI, Fig. SI-4†). This temperature difference is similar to that obtained above with the coarse-grained spherical JNP, using similar heat fluxes. Hence, temperature contrast can be efficiently achieved with particles of fairly different geometries. The average interfacial thermal conductances G* = 0.76 ± 0.01 and G* = 0.236 ± 0.006, are of the same order as those computed for the spherical nanoparticle, too (see Fig. 4d).Fig. 9b shows the spatial distribution of the ITC projected on the atomic coordinates of the surface atoms in the nanorod. The ITC depends significantly on the facet of the nanocrystal. Local changes in the ITC can be rationalized by considering the location of the atoms in each facet and the local atomic coordination in those facets. Like in the spherical JNP, higher coordination numbers between nanoparticle atoms, result in lower exposure of those atoms to the solvent, which leads to lower ITCs. For the nanorod, the ITC follows the order {111} < {100} < {110} (see Fig. 6a in the ESI†). An analysis of the probability distribution of the ITCs (see Fig. 6b in the ESI†) shows that the lyophilic region features a more heterogeneous distribution, with significant variations in the ITC depending on the local coordination number. The lyophobic region does not show a significant heterogeneity, though. This behaviour resembles the observations for the spherical JNP (cf. Fig. 4d and 6b (ESI)†). Again, the behaviour of the ITC in the nanorod can be rationalized considering the stronger adsorption of the solvent at the lyophilic side and the depletion of the solvent from the lyophobic side, which results in lower Voronoi densities (Fig. 7 in the ESI†), weaker contact nanoparticle-solvent and a more homogeneous ITC.
The local ITC of the nanorod, presented in Fig. 9b, features a sharp transition at the lyophobic/lyophilic three-phase line again. We have quantified the transition following the approach discussed above for spheres. The path follows the coordinates of the surface atoms along the y* axis (see Fig. 10a, b and c) and the 110 facets. The transition in the ITC of the nanorod has a characteristic width of δ* ∼ 1σ, i.e. similar to the one observed in spherical Janus nanoparticles and coated gold nanoparticles. These results support again the generality of our conclusions regarding the behaviour of the heat flux and thermal transport properties at three-phase lines.
 | ||
| Fig. 10 (a) Cross-section of the Janus nanorod of |x*| < 10, with non-surface atoms coloured grey. The surface atoms are coloured according to their local ITC. Variation of the ITC (b) and Voronoi density (c) along the path crossing the lyophobic-lyophilic region. This path is defined by traversing along the y-axis as shown in (a), along the {110} facets, such that the boundary between the two particles in crossed once. The dashed lines represent fittings to eqn (3). The nanorod has an odd number of atoms in the {110} facets, which cannot be split evenly to make the Janus particle (see rectangles in panel a). This is reflected in the shift in the data shown in panels b and c for z* < 0 and z* > 0. The numbers in the middle and right panels indicate the width, δ, of the transition from the philic to the phobic region. | ||
4. Concluding remarks and conclusions
We have used non-equilibrium molecular dynamics simulations combined with the recently introduced atomistic nodal approach to resolve the spatially interfacial thermal transport of Janus nano heaters. The Janus nanoparticles consist of two materials with different wettabilities. One hemisphere models a hydrophobic surface (phobic) with a contact angle 130° and the other a fully wettable surface (philic). The contrasting lyophilicity of these two surfaces results in very different interfacial thermal conductances, biasing the heat transport towards the solvent preferentially through the hydrophilic surface. This physical effect translates into a temperature contrast, with the solvent achieving a higher temperature when it is in contact with the lyophilic surface. Our calculations show that temperature contrasts of the order of 5 K for heat rates of the order of μW are easily achievable using nanoparticles of 20–30 nm illuminated with light intensities of 105 W cm−2. Such conditions are widely targeted in thermoplasmonic applications.1,35Using the ANA method, we find an abrupt transition in the ITC values and behaviour when crossing the three-phase line separating the lyophobic and lyophilic regions. Remarkably, the characteristic length scale for the transition at the nanoparticle surface is <1 nm, indicating that the heat transport of nanoparticles (from a few to tens of nanometres) can be modelled by using the thermal transport properties of the homogeneous materials used to make such particles.
We have demonstrated the generality of our conclusions by investigating spherical and rod-shaped nanoparticles, as well as gold Janus nanoparticles coated with ligands whose hydrophilic character is determined by the terminal group attached to the aliphatic chains, either –CH3 (phobic) or –OH (philic). We showed that the heating of these nanoparticles results in heterogeneous temperature fields around the particles, with abrupt temperature transitions across hydrophobic and hydrophilic regions, ∼0.5 nm. Significant temperature differences are achievable between adjacent molecular layers, whose only difference is the composition of the terminal groups. For example, in the system studied here, we achieved temperature differences of 20 K (for ∼1 μW heat rates) between neighbouring alkanethiolate layers attached to gold, corresponding to very high thermal nanoscale thermal gradients, 40 K nm−1, in the direction tangential to the chains.
The physical behaviour uncovered here with advanced computational techniques, provides a powerful design principle to fabricate nanoparticles to control the direction of heat in thermoplasmonic applications, and to generate significant thermal gradients at the nanoscale. Anisotropic nanoheaters could be used in thermal therapies that rely on plasmonic or magnetic nanoparticles to generate local heating and trigger cell death.5–7 Nanoparticles with homogeneous composition dissipate heat isotropically and therefore lack selectivity. The Janus particles studied here would provide better control of the heat flow by localizing heat in specific directions, reducing the risk of collateral damage on healthy biological structures.
The anisotropic heating produced by Janus nanoparticles should be reflected in distinctive heat rates and nanoparticle temperatures, which could be explored experimentally using photothermal microscopy.34 Furthermore, extending these ideas to larger surfaces with heterogeneous compositions could allow the investigation of the impact of heterogeneous heat transport on the transient temperature relaxation of surfaces using well-established thermoreflectance experimental techniques.39
5. Methods
We built the coarse-grained nanoparticle models by cutting an fcc cubic crystal with density ρ* = (N/V)σ3 = 1, where σ = 0.35 nm corresponds approximately to the location of the first minimum in the oxygen-oxygen radial distribution function of water. The interactions were described using the spherically truncated and shifted Lennard-Jones (LJ) potential, | (6) |
| U(r) = [uLJ(r) − uLJ(rc)]θ(rc − r) | (7) |
The inter-particle interactions were truncated to zero at rc = 2.5σs, and the cross interaction between each half of the JNP, and the solvent was adjusted using,
 | (8) |
To simulate the plasmonic heating, we applied a “HOT” thermostat in the central region of the nanoparticles, within a radial distance of 2σs from the centre of geometry of the spherical particle or main axis of symmetry of the nanorod. The COLD thermostat was located at 7σ from the surface of the JNP. We performed simulations in the stationary state by using a velocity rescaling thermostat with  and
and  .
.
The atomic temperature in the nanoparticle were calculated using the equipartition principle,
 | (9) |
 .
. | (10) |
 | (11) |
To simulate the atomistic gold nanoparticle we used the TraPPe forcefield to represent intramolecular and intermolecular interactions (with flexible bonds), and for the sulfur-gold interactions we used an nm potential.41 Water was modelled with the TIP4P/2005 model,42 which accurately reproduces many of the properties of water, and predicts a high thermal conductivity for the liquid.43 Further details on these simulations can be found in our previous work.15
The “COLD” thermostat for the atomistic simulations was set up by thermostatting every timestep at 300 K, the water molecules located at a radial distance >7.5 nm from the center of mass of the nanoparticle. For the “HOT” thermostat, all the gold atoms in the nanoparticle core were thermostatted at 400 K. We used the canonical sampling velocity rescaling (CSVR) thermostat44 for water and a Langevin thermostat for the gold atoms. We used a damping time of 2.5 ps for both thermostats. Local temperature profiles were computed by using 2D bins of 0.2 nm × 0.2 nm in the y–z plane, perpendicular to the 3 phase line of the JNP. Atoms within a slab of thickness of 1 nm were used to compute the corresponding temperatures. By changing the random seeds of the thermostats, 99 statistically independent simulation were performed, each for a total of 0.625 ns of production after 0.125 ns of equilibration, performed with a 0.5 fs timestep.
Conflicts of interest
There are no conflicts to declare.Acknowledgements
We thank the Leverhulme Trust (UK grant RPG-2018-384) for financial support, the Imperial College RCS High Performance Computing facility and the UK Materials and Molecular Modelling Hub for computational resources partially funded by the EPSRC (EP/P020194/1 and EP/T022213/1). AC thanks the EPSRC and the Imperial College of London Department of Chemistry for a DTP studentship (Project Ref. 2438823).References
- G. Baffou, F. Cichos and R. Quidant, Nat. Mater., 2020, 19, 946–958 CrossRef CAS PubMed.
- J. E. Reiner, J. W. F. Robertson, D. L. Burden, L. K. Burden, A. Balijepalli and J. J. Kasianowicz, J. Am. Chem. Soc., 2013, 135, 3087–3094 CrossRef CAS PubMed.
- A. O. Govorov, W. Zhang, T. Skeini, H. Richardson, J. Lee and N. A. Kotov, Nanoscale Res. Lett., 2006, 1, 84 CrossRef.
- G. Baffou, R. Quidant and F. J. García de Abajo, ACS Nano, 2010, 4, 709–716 CrossRef CAS PubMed.
- X. Chen, Y. Chen, M. Yan and M. Qiu, ACS Nano, 2012, 6, 2550–2557 CrossRef CAS PubMed.
- L. R. Hirsch, R. J. Stafford, J. A. Bankson, S. R. Sershen, B. Rivera, R. E. Price, J. D. Hazle, N. J. Halas and J. L. West, Proc. Natl. Acad. Sci. U. S. A., 2003, 100, 13549–13554 CrossRef CAS PubMed.
- L. C. Kennedy, L. R. Bickford, N. A. Lewinski, A. J. Coughlin, Y. Hu, E. S. Day, J. L. West and R. A. Drezek, Small, 2011, 7, 169–183 CrossRef CAS PubMed.
- S. Lal, S. E. Clare and N. J. Halas, Acc. Chem. Res., 2008, 41, 1842–1851 CrossRef CAS PubMed.
- M. H. Falk and R. D. Issels, Int. J. Hyperthermia, 2001, 17, 1–18 CrossRef CAS PubMed.
- Q. A. Pankhurst, J. Connolly, S. K. Jones and J. Dobson, J. Phys. D: Appl. Phys., 2003, 36, R167–R181 CrossRef CAS.
- J. van der Zee, Ann. Oncol., 2002, 13, 1173–1184 CrossRef CAS PubMed.
- D. Jaque, L. Martínez Maestro, B. del Rosal, P. Haro-Gonzalez, A. Benayas, J. L. Plaza, E. Martín Rodríguez and J. García Solé, Nanoscale, 2014, 6, 9494–9530 RSC.
- Y. Zhang, X. Zhan, J. Xiong, S. Peng, W. Huang, R. Joshi, Y. Cai, Y. Liu, R. Li and K. Yuan, et al. , Sci. Rep., 2018, 8, 1–9 Search PubMed.
- Y. Zhang, X. Zhan, J. Xiong, S. Peng, W. Huang, R. Joshi, Y. Cai, Y. Liu, R. Li, K. Yuan, N. Zhou and W. Min, Sci. Rep., 2018, 8, 8720 CrossRef PubMed.
- J. D. Olarte-Plata, J. Gabriel, P. Albella and F. Bresme, ACS Nano, 2022, 16, 694–709 CrossRef CAS PubMed.
- C. Casagrande, P. Fabre, E. Raphaël and M. Veyssié, Europhys. Lett., 1989, 9, 251–255 CrossRef CAS.
- M. D. McConnell, M. J. Kraeutler, S. Yang and R. J. Composto, Nano Lett., 2010, 10, 603–609 CrossRef CAS PubMed.
- J. Hu, S. Zhou, Y. Sun, X. Fang and L. Wu, Chem. Soc. Rev., 2012, 41, 4356–4378 RSC.
- B. Zhao, H. Zhou, C. Liu, Y. Long, G. Yang, C.-H. Tung and K. Song, New J. Chem., 2016, 40, 6541–6545 RSC.
- T. C. Le, J. Zhai, W.-H. Chiu, P. A. Tran and N. Tran, Int. J. Nanomed., 2019, 14, 6749–6777 CrossRef CAS PubMed.
- E. T. Swartz and R. O. Pohl, Rev. Mod. Phys., 1989, 61, 605–668 CrossRef.
- K. Metwally, S. Mensah and G. Baffou, J. Phys. Chem. C, 2015, 119, 28586–28596 CrossRef CAS.
- J. T. Gaskins, G. Kotsonis, A. Giri, S. Ju, A. Rohskopf, Y. Wang, T. Bai, E. Sachet, C. T. Shelton, Z. Liu, Z. Cheng, B. M. Foley, S. Graham, T. Luo, A. Henry, M. S. Goorsky, J. Shiomi, J.-P. Maria and P. E. Hopkins, Nano Lett., 2018, 18, 7469–7477 CrossRef CAS PubMed.
- A. Giri and P. E. Hopkins, Adv. Funct. Mater., 2020, 30, 1903857 CrossRef CAS.
- S. Neogi and G. D. Mahan, Lattice dynamics model calculation of Kapitza conductance at solid-fluid interfaces, 2016 Search PubMed.
- B. N. J. Persson, A. I. Volokitin and H. Ueba, J. Phys.: Condens. Matter, 2011, 23, 045009 CrossRef CAS PubMed.
- M. Jiang, J. D. Olarte-Plata and F. Bresme, J. Chem. Phys., 2022, 156, 044701 CrossRef CAS PubMed.
- K. Jiang, D. A. Smith and A. Pinchuk, J. Phys. Chem. C, 2013, 117, 27073–27080 CrossRef CAS.
- A. P. Bregulla and F. Cichos, Optical Trapping and Optical Micromanipulation XIII, 2016, vol. 9922, p. 99221L Search PubMed.
- J. Reguera, E. Ponomarev, T. Geue, F. Stellacci, F. Bresme and M. Moglianetti, Nanoscale, 2015, 7, 5665–5673 RSC.
- A. Stukowski, Modell. Simul. Mater. Sci. Eng., 2010, 18, 015012 CrossRef.
- J. Reguera, E. Ponomarev, T. Geue, F. Stellacci, F. Bresme and M. Moglianetti, Nanoscale, 2015, 7, 5665–5673 RSC.
- A. S. Tascini, J. Armstrong, E. Chiavazzo, M. Fasano, P. Asinari and F. Bresme, Phys. Chem. Chem. Phys., 2017, 19, 3244–3253 RSC.
- A. Gaiduk, P. V. Ruijgrok, M. Yorulmaz and M. Orrit, Chem. Sci., 2010, 1, 343–350 RSC.
- A. O. Govorov and H. H. Richardson, Nano Today, 2007, 2, 30–38 CrossRef.
- M. González-Melchor, F. Bresme and J. Alejandre, J. Chem. Phys., 2005, 122, 104710 CrossRef PubMed.
- Z. Ge, D. G. Cahill and P. V. Braun, Phys. Rev. Lett., 2006, 96, 186101 CrossRef PubMed.
- W. F. Paxton, K. C. Kistler, C. C. Olmeda, A. Sen, S. K. St Angelo, Y. Cao, T. E. Mallouk, P. E. Lammert and V. H. Crespi, J. Am. Chem. Soc., 2004, 126, 13424–13431 CrossRef CAS PubMed.
- Z. Ge, D. G. Cahill and P. V. Braun, J. Phys. Chem. B, 2004, 108, 18870–18875 CrossRef CAS.
- J. H. Irving and J. G. Kirkwood, J. Chem. Phys., 1950, 18, 817–829 CrossRef CAS.
- K. A. Tay and F. Bresme, J. Am. Chem. Soc., 2006, 128, 14166–14175 CrossRef CAS PubMed.
- J. L. F. Abascal and C. Vega, J. Chem. Phys., 2005, 123, 234505 CrossRef CAS PubMed.
- F. Römer, A. Lervik and F. Bresme, J. Chem. Phys., 2012, 137, 074503 CrossRef PubMed.
- G. Bussi, D. Donadio and M. Parrinello, J. Chem. Phys., 2007, 126, 014101 CrossRef PubMed.
Footnote |
| † Electronic supplementary information (ESI) available: Additional numerical results and figures showing heat fluxes, local temperatures, Voronoi densities and coordination numbers of Janus nanoparticles. Fitting parameters for the temperature profiles are also provided. See DOI: https://doi.org/10.1039/d3nr00560g |
| This journal is © The Royal Society of Chemistry 2023 |

