 Open Access Article
Creative Commons Attribution 3.0 Unported Licence
A combined 3D-atomic/nanoscale comprehension and ab initio computation of iron carbide structures tailored in Q&P steels via Si alloying
Sumit
Ghosh
 *a,
Khushboo
Rakha
 b,
Assa
Aravindh Sasikala Devi
 c,
Shahriar
Reza
 d,
Sakari
Pallaspuro
 a,
Mahesh
Somani
 a,
Marko
Huttula
 c and
Jukka
Kömi
 a
a
aMaterials and Mechanical Engineering, Centre for Advanced Steels Research, University of Oulu, Oulu, 90014, Finland. E-mail: sumit.ghosh@oulu.fi
bDepartment of Metallurgical and Materials Engineering, Indian Institute of Technology Ropar, Rupnagar, 140001, India
cNano and Molecular Systems Research Unit, University of Oulu, Oulu, 90014, Finland
dMaterials and Metallurgical Division, Spica Research, Dhaka, 1229, Bangladesh
First published on 9th May 2023
Abstract
The essences of the quenching and partitioning (Q&P) process are to stabilize the finely divided retained austenite (RA) via carbon (C) partitioning from supersaturated martensite during partitioning. Competitive reactions, i.e., transition carbide precipitation, C segregation, and decomposition of austenite, might take place concurrently during partitioning. In order to maintain the high volume fraction of RA, it is crucial to suppress the carbide precipitation sufficiently. Since silicon (Si) in the cementite θ (Fe3C) is insoluble, alloying Si in adequate concentrations prolongs its precipitation during the partitioning step. Consequently, C partitioning facilitates the desired chemical stabilization of RA. To elucidate the mechanisms of formation of transition η (Fe2C) carbides as well as cementite, θ (Fe3C), besides the transformation of transition carbides to more stable θ during the quenching and partitioning (Q&P) process, samples of 0.4 wt% C steels tailored with different Si contents were extensively characterized for microstructural evolution at different partitioning temperatures (TP) using high resolution transmission electron microscopy (HR-TEM) and three-dimensional atom probe tomography (3D-APT). While 1.5 wt% Si in the steel allowed only the formation of η carbides even at a high TP of 300 °C, reduction in Si content to 0.75 wt% only partially stabilized η carbides, allowing limited η → θ transformation. With 0.25 wt% Si, only θ was present in the microstructure, suggesting a η → θ transition during the early partitioning stage, followed by coarsening due to enhanced growth kinetics at 300 °C. Although η carbides precipitated in martensite under paraequilibrium conditions at 200 °C, θ carbides precipitated under negligible partitioning local equilibrium conditions at 300 °C. Competition with the formation of orthorhombic η and θ precipitation further examined via ab initio (density functional theory, DFT) computation and a similar probability of formation/thermodynamic stability were obtained. With an increase in Si concentration, the cohesive energy decreased when Si atoms occupied C positions, indicating decreasing stability. Overall, the thermodynamic prediction was in accord with the HR-TEM and 3D-APT results.
Introduction
The quenching and partitioning (Q&P) treatment has gained considerable attention due to its ability to impart a superior combination of ultimate tensile strength and elongation to fracture, as stipulated in 3rd generation (3G) advanced high-strength steels.1–4 The Q&P process, first proposed by Speer et al., involves austenitizing the steel, interrupted quenching it to a temperature (TQ) between the martensite start (Ms) and finish (Mf) temperatures, followed by holding for an appropriate time (Pt) at a preferred partitioning temperature (TP; often TP ≥ TQ) to permit the carbon (C) atoms to partition from martensite to untransformed austenite.5 Further cooling to room temperature (RT) can then fully or partially stabilize the C-enriched austenite.1–7 The stabilized austenite is often finely distributed as lath-like, thin film interlayers between martensitic laths or as tiny pools between the blocks of martensite. While the martensite matrix conveys the required ultrahigh strength in the steel, the requisite elongation and work hardening are imparted by the thin films of austenite divided finely between the martensitic laths due to the opportunity of the transformation-induced plasticity (TRIP) effect.1–7 During partitioning, C atoms are redistributed, and this has long been a matter of scientific interest. Besides C partitioning, a number of additional microstructural processes, including austenite decomposition into bainite or isothermal martensite, tempering of martensite, clustering of C atoms, and carbide precipitation, also became apparent during the Q&P processing.8–10 Final cooling sometimes leads to the formation of a fraction of untempered high-C martensite from the carbon-enriched austenite depending on its stability. In general, a fraction of C atoms available for partitioning is often trapped in the martensite due to clustering or locking at the dislocation walls or other defects or otherwise participate in carbide formation.11–14 In the course of partitioning, carbide precipitation can also occur due to partial decomposition of austenite enriched with C, in addition to tempering of martensite.11–14 It is essential to effectively hinder carbide precipitation during the Q&P treatment in order to retain a desired volume fraction of retained austenite (RA) with good stability. The presence of coarse carbides in steel is undesirable for many engineering applications since these can often worsen the mechanical properties, especially with regard to fatigue and fracture toughness.15–17 Like in TRIP steels, Si and/or Al are purposefully alloyed to avoid the carbide reaction and/or austenite decomposition, unlike in the case of tempering.8,18,19 However, high-Si steels may develop an undesirable adherent fayalite layer (red scale) on the surface under specific conditions of hot rolling.20 Hence, considerable industrial interest in the Q&P concept led to the optimization of steel alloying in order to prevent the formation of these carbides as well as improve the surface quality and properties. Still, the nature and types of initial transition carbides formed during the early stages of low-temperature partitioning and/or tempering of steels constitute a matter of debate, as there is still no general agreement so far. Moreover, the effect of Si on the characteristics and kinetics of transition carbide precipitation is still imprecise. In Q&P steels, Si (and/or Al) addition in desired amounts can prevent the occurrence of precipitation and growth of Fe3C (θ) during the partitioning treatment.18–23 Kim et al. examined the effect of Si on the C partitioning process in 1 wt% C steels with or without 2 wt% Si addition.22 They clarified that the precipitation of carbide did occur independent of the Si content; however, the rate and extent of the precipitation varied with the Si content. This occurrence was most likely due to relatively high C content in the steel, but Si addition did enhance austenite stabilization during partitioning in addition to delaying the decomposition process. Moreover, it has been reported that Si does increase the stability of transition ε-carbide (Fe2.4C).22 According to HajyAkbary et al., prior to the partitioning, immediately after the initial quenching of 0.3C-1.6Si steel ε-carbide precipitation occurred.23 They claimed that the main reason for lower C partitioning than predicted by thermodynamic simulations was due to carbide formation. Using Mössbauer spectroscopy (MS), Pierce et al. investigated the precipitation of iron carbides in Q&P-treated 0.38C-1.48Si steel and demonstrated the concomitant precipitation of η-carbide alongside the C partitioning.14 Although several investigations were conducted to elucidate different variants of transition carbides, utilizing high resolution transmission electron microscopy (HR-TEM) and MS, the likely presence of C clusters prior to the precipitation of transition carbides might have been influenced by TEM and MS data.22–24 The direct demonstration of the identification of C atoms segregating to lattice defects within martensite was first provided by Miller et al. using atom probe field ion microscopy (AP-FIM).25 Most recently, the modern three-dimensional atom probe tomography (3D-APT) technique is capable of resolving not only the distribution effectively, but can also illustrate the 3D distribution of substitutional solute elements through the carbide–ferrite/martensite and/or carbide–austenite interfaces. By understanding the interplay between the type of carbide and C distribution at the matrix/precipitate interface, the Q&P conditions can be precisely tailored for a given composition to achieve the optimized combination of mechanical properties.The major goals of the current work are to comprehend the stability and growth characteristics of transition carbides formed during the Q&P process of 0.4 wt% C steels containing different Si contents and to clarify the influence of Si on C partitioning as well as austenite decomposition, besides the evaluation of different types of carbides formed during Q&P treatments. Another objective was to investigate the feasibility of using a low-temperature partitioning step in order to be able to lower the Si level in the steel through detailed quantitative and qualitative microstructural characterisation. Thus, advanced microstructural characterisation techniques, viz. HR-TEM and 3D-APT, were employed to elucidate the formation of different types of carbides, C distribution, and segregation during different conditions of Q&P treatments. Moreover, ab initio (density-functional theory, i.e., DFT) calculations were conducted to evaluate the thermodynamics related to the formation of orthorhombic transition carbide η and its competition with the precipitation of stabler orthorhombic θ carbide (i.e., cementite). Furthermore, the feasibility of η carbide and the configuration of C atoms in orthorhombic η carbide were further examined in terms of thermodynamic simulations.
Experimental section
Alloy selection
For this work, three medium C (0.4 wt% C) steels with various Si concentrations (i.e., 0.25, 0.75, and 1.5 wt%) were designed. Vacuum-cast ingots weighing 70 kg were obtained from OCAS, Belgium. Table 1 displays the chemical compositions of the three experimental steels used in this study. While the C content was estimated using combustion analysis, the other alloying elements were determined by spark-optical emission spectroscopy.| Steel code | C | Mn | Si | Al | Cr | Ni |
|---|---|---|---|---|---|---|
| High-Si | 0.4 | 2.05 | 1.51 | 0.02 | 1.0 | 0.5 |
| Medium-Si | 0.4 | 2.04 | 0.68 | 0.02 | 1.0 | 0.5 |
| Low-Si | 0.4 | 2.02 | 0.25 | 0.02 | 1.0 | 0.5 |
Materials processing
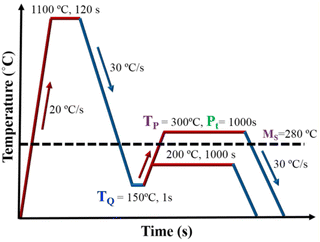
A 1-MN Carl Wezel rolling mill was used for hot-rolling the experimental steel blocks of dimensions 200 × 80 × 60 mm to 12 mm thick plates, after soaking at 1200 °C for 2 h. Cylindrical specimens of ∅ 6 × 9 mm were sectioned from rolled plates for conducting physical simulation experiments and dilatation measurements using a Gleeble® 3800 thermomechanical simulator. A schematic test plan displaying Q&P simulation experiments carried out for all three experimental steels is illustrated in Fig. 1. All the samples were reheated at 20 °C s−1 to an austenitization temperature of 1100 °C, held for 120 s, and then cooled at 30 °C s−1 to a desired quenching temperature in the Ms–Mf range. A quench interruption temperature (TQ) of 150 °C was chosen based on the linear analysis of preliminary Q&P tests in order to achieve ∼80% martensite prior to partitioning at two different temperatures (TP ∼300 and 200 °C). To prevent extensive carbide precipitation and/or growth, as well as austenite to bainite decomposition during isothermal holding, partitioning was carried out at a relatively low temperature. A constant partitioning time (Pt) of 1000 s was selected to examine the effect of partitioning time (Pt) on the microstructural processes at various TP temperatures. For each of the experimental steps consisting of cooling from austenitization temperature to the desired TQ in the Ms–Mf temperature range, reheating to TP at 200 and 300 °C s−1, subsequent partitioning at TP for Pt = 1000 s, and final cooling to RT at 30 °C s−1, the dilatometer data were recorded.Characterisation
Results
Characterisation of microstructures and iron carbide precipitates through TEM
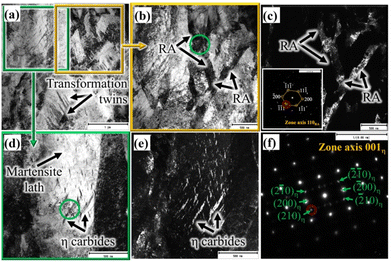
Both TEM bright and dark field (BF and DF) imaging techniques together with nano beam diffraction (NBD) were used to characterise the complex martensitic-austenitic microstructures, as well as different carbides. Fig. 2a presents the BF micrograph of a high-Si steel specimen Pt for 1000 s at 300 °C, showing the typical martensitic lath structure along with traces of transformation twins.A higher magnification picture of the selected location, as marked in Fig. 2a, is shown in Fig. 2b, which reveals the features of martensitic laths along with interlath RA. The corresponding DF image, as presented in Fig. 2c, recorded using the (−1−11) diffraction spot in the NBD pattern recorded on the [110]RA zone axis (inset), distinctly reveals finely divided interlath RA films together with pool-like structures. In Fig. 2a, twinned martensite identified in the microstructure is possibly due to the formation of untempered high-C martensite from C-enriched austenite at lower temperatures during the final cooling. It is well known that the martensitic transformation in high/medium C steels often accompanies twinning to accommodate the transformation of strains.30 Apart from martensite and RA, the presence of fine carbide precipitates inside the martensite laths is evident in some locations, as revealed more clearly in the higher magnification BF image of the location marked in Fig. 2a and shown in Fig. 2d. The corresponding DF image is shown in Fig. 2e recorded using the (210) diffraction spot of the NBD pattern in the [001]η zone axis (Fig. 2f). The carbide precipitates with the typical wave-like character were identified as η carbides (Fe2C) having an orthorhombic crystal structure and orientation relationships of [100]α∥[001]η and (101)α∥(110)η with the martensitic matrix.31 The interplanar spacing determined using the NBD pattern based on the [001]η zone axis (Fig. 2f) confirms the formation of orthorhombic η carbide. Cementite (θ) was not observed in this specimen.
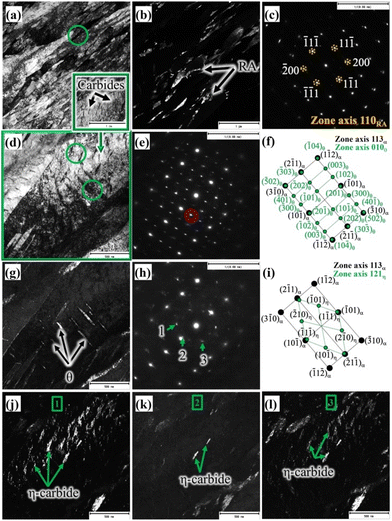
A TEM BF micrograph of the medium-Si steel sample partitioned at 300 °C is shown in Fig. 3a, which shows typical martensite laths together with interlath RA. The corresponding DF image (Fig. 3b) was recorded using the (200) diffraction spot of the NBD pattern based on the [110]RA zone axis (Fig. 3c), revealing the finely divided interlath RA. A slightly lower proportion of RA in comparison with to that of the high-Si steel treated with the same Q&P parameters (Fig. 2c) is evident from Fig. 3b. The volume fractions of the RA of the similar Q&P-treated specimens quantified by XRD and reported in our earlier work are in agreement with the TEM results.8 Fine carbides precipitated inside the martensite laths are apparent, as seen in Fig. 3a, marked by a green rectangle. Fig. 3d presents the high magnification image of the corresponding green rectangle region, as depicted in Fig. 3a, which was recorded on the [113]α zone axis. Two different carbide variants are revealed; one with precipitation as fine platelets inside the martensite laths, and the other as coarse precipitates in the interlath/boundary regions (Fig. 3d). The corresponding NBD patterns (green circles in Fig. 3d) are presented in Fig. 3e and h, respectively. The corresponding schematic index diagrams of the two NBDs are presented in Fig. 3f and i. The orientation relationship of θ precipitates with the martensite matrix was identified as [113]α∥[010]θ, and the recorded diffraction pattern in Fig. 3e was consistent with this relationship, as also schematically indexed in Fig. 3f.31
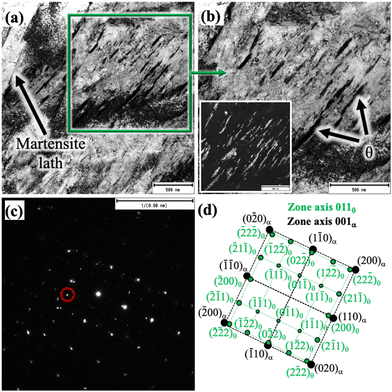
On the other hand, η carbides have the orientation relationship with the matrix such that [113]α∥[121]η,31 which is evident from the corresponding NBD in Fig. 3h and the respective schematic indexing in Fig. 3i. Overall, this observation indicates that fine precipitation of η carbide occurred inside the martensite laths, together with the occurrence of θ platelets in the interlath areas. The corresponding existence of interlath θ was identified in the TEM DF image, as shown in Fig. 3g, recorded on the encircled NBD spot in Fig. 3e. Presumably, this is an effect of the medium level of Si (0.75%) in the steel in comparison with that of the high-Si steel (1.5% Si). The TEM DF images presented in Fig. 3j–i confirmed the presence of η carbides, recorded from three respective NBD spots marked as 1, 2, and 3 in Fig. 3h. In spite of carbide precipitation, significant RA fraction was still stabilized at RT (Fig. 3b). Fig. 4a shows the TEM BF micrograph of the low-Si steel TP at 300 °C, showing numerous precipitations of carbides in martensitic laths, obviously because of the low Si content (0.25%) in the steel in comparison with those of medium-Si (0.75%) and high-Si (1.5%) steels. Fig. 4b presents a magnified view of the corresponding region indicated by a green square in Fig. 4a. The NBD (Fig. 4c) was recorded in the coarse interlath carbide region, as marked by green coloured circles in Fig. 4b. The DF image (inset in Fig. 4b) captured from the selected spot, marked by a red circle in the NBD pattern recorded along the [011]θ zone axis (Fig. 4c), clearly shows the presence of only θ carbides both in intra- and inter-lath positions. The NBD pattern has been further schematically presented in Fig. 4d with complete indexing both for martensite along the [001]α zone axis and for θ on the [011]θ zone axis, confirming the existence of only θ precipitates in the microstructure. Furthermore, relatively larger θ plates were found to be dispersed in tempered martensite, indicating the unhindered growth of θ precipitates during the partitioning process at 300 °C, apparently due to the low Si content in the steel.
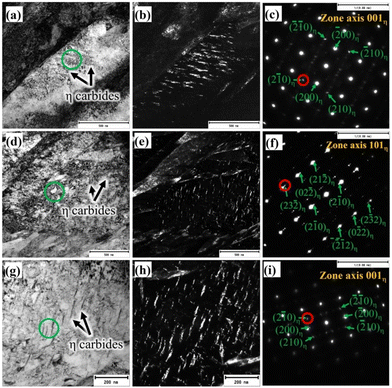
Furthermore, representative TEM BF micrographs have been recorded on all the steels partitioned at 200 °C for 1000 s, together with recording of NBD patterns from the corresponding carbide region as marked by green coloured circles and DF imaging of selected diffraction spots corresponding to the respective carbides present in the high-, medium- and low-Si steels. The results are summarized in Fig. 5a–i. Martensitic laths containing nanosized carbides were present in all the steels regardless of their Si contents, as can be seen in the BF micrographs of high-, medium-, and low-Si steels, as depicted in Fig. 5a, d and g, respectively. The NBD patterns of carbide precipitates detected in all the three steels revealed an orthorhombic η carbide structure (Fig. 5c, f and ifor the high-, medium- and low-Si steels, respectively). The interplanar spacing calculated from the NBD patterns on the [001] and [101] zone axes confirmed the existence of η carbides. However, θ was not detected in the interlath sites of any specimens including the low-Si steel. As the Si content decreased from high-Si to low-Si steels, their respective η carbide fractions surged correspondingly.
Overall, these results indicate that Si functions as a potential graphitizing agent, which promotes partitioning of C from the supersaturated martensite to untransformed austenite, enabling its stabilization at RT. Earlier studies22,31 concluded that high Si levels in the steel inhibit cementite formation but have only marginal effect on transition carbide precipitation. One previous study22 has suggested the formation of transition ε-carbides, which become more stable in the presence of a high Si concentration. In contrast to this, our study illustrates the formation of orthorhombic η-carbides in the steel. The evolution of orthorhombic η-carbide was also reported by Pierce et al. for a 0.38C–1.54Mn–1.48Si steel quenched at 225 °C, followed by partitioning at 400 °C.14 It is certainly possible to prevent or postpone carbide formation, if there is an adequately high content of Si in the given steel. However, it cannot be fully inhibited during prolonged partitioning at a particular temperature. In particular, it should be noted that a heterogeneous distribution of carbides was observed across the martensite laths and the precipitation of η carbides mainly took place inside the martensitic laths. Because a fine crystal offers better chances for C to escape from the interlath RA films (clustering) and equilibrate prior to precipitation. However, locking of C atoms at dislocations and the lack of an interlath untransformed austenite film might lead to carbide precipitation, since C atoms would then have no immediate sinks.
Compositional analysis
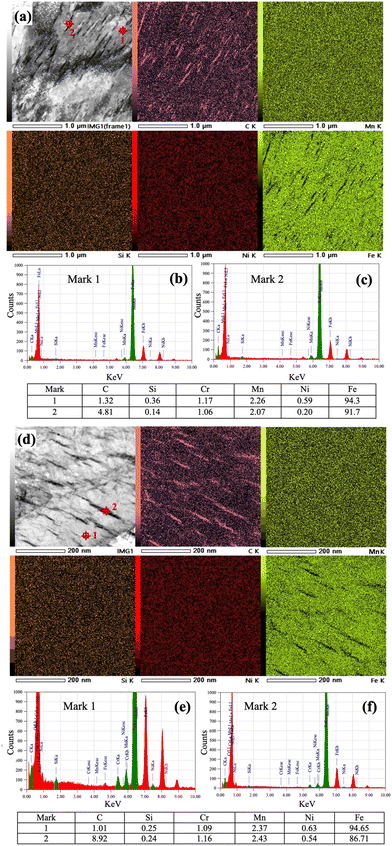
Fig. 6a and d depict high resolution STEM images of the low-Si steel partitioned at 300 and 200 °C for 1000 s, respectively. STEM images are recorded along the [011] and [001] zone axes, respectively, and corresponding EDS elemental maps of C, Mn, Si, Ni and Fe are presented in Fig. 6a and d, respectively. C mainly got enriched inside the θ and η carbides, while Fe was depleted in these regions. The distribution of Mn seems to be rather homogeneous throughout the measured regions, while Si and Ni are slightly depleted in θ carbides (Fig. 6a) but almost homogeneous in η carbides (Fig. 6d). STEM-EDS measurements, however, can only provide a fairly qualitative confirmation of the elemental distribution. Furthermore, EDS spot analyses were conducted both on the matrix and θ/η carbide, as marked 1 and 2, respectively, in Fig. 6a and d to check the compositional differences. The corresponding EDS spectra are presented in Fig. 6b,c, e and f respectively. It was noticed that the C concentration within the θ precipitate was ∼4.81 wt%, whereas it reached ∼8.92 wt% in the case of η carbide.On the other hand, the Si concentration in θ was found to be much lower compared to that of the matrix, indicating that Si atoms were rejected from θ. The concentration of Si seemed depleted to ∼0.14 wt% in θ carbide compared to an average value of ∼0.36 wt% in the matrix. However, the concentration seemed practically unchanged (0.25 wt%) in the case of η carbide. The solubility of Si in θ is known to be negligibly small and, hence, during partitioning, Si was rejected from θ in sharp contrast to nearly unchanged Si concentration in η carbide, suggesting its nearly complete solubility. This observation is consistent with the previous investigation, where it was assumed that an aging time on the order of one year was necessary for the precipitation of transition carbides.31
Identification of C-rich regions through 3D-APT
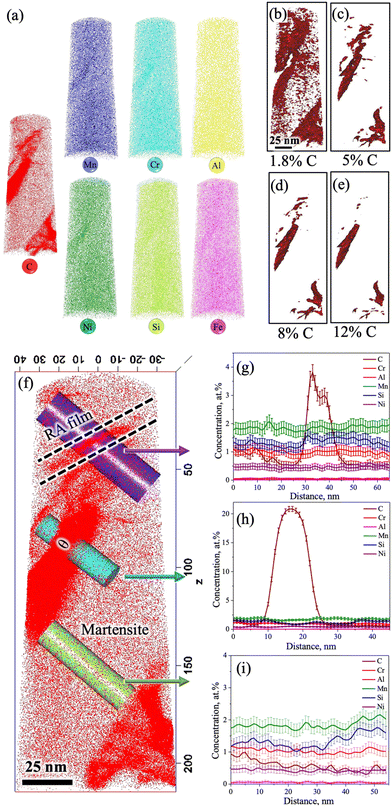
The 3D-APT atom maps as presented in Fig. 7a show the atomic scale distribution of different elemental alloys among different phase constituents (austenite/martensite) including the carbides in the medium-Si steel specimen partitioned at 300 °C. The existence of C-rich regions/carbides with different morphologies was clearly noticed in the C atom map. The enrichment of Cr and Mn inside the C-rich regions is clearly evident from the Cr and Mn atom maps (Fig. 7a). This observation is in accordance with their carbide forming tendencies.32,33 In contrast, Si and Ni, the non-carbide-forming elements, were expected to be depleted from the carbides/C-rich region. However, Si and Ni are also found to be concentrated slightly inside the carbides/C-rich region. A phenomenon known as local magnification effect is attributed to be the reason behind this observation.32 Detection of these atoms inside carbides is higher due to the lower evaporation field than the surrounding matrix. Even though this artefact affects the position and/or width of the interface, it does not have significant impact on the elemental concentration inside the carbide.32Fig. 7b–e show the iso-concentration surfaces with varied C thresholds, i.e., 1.8 at% (nominal C), 5 at%, 8 at%, and 12 at%. The C-gradients around the C-rich features are observed in different at% C iso-concentration surface maps. Apart from C-rich features, the C concentration in the matrix is low (∼1.8 at%), which supports its identification as a martensitic region. Furthermore, two different morphologies of C-rich features with different size scales were located inside the martensite region in Fig. 7c: (i) an ultrafine film-like morphology with ∼5 nm thickness was located at the top corner and (ii) a slightly coarser morphology with ∼20 nm thickness was located at the central region and at the bottom corner.
Fig. 7f shows an enlarged view of the C atom map presented in Fig. 7a. At the top corner side of the 3D-APT map (Fig. 7f), a C-enriched area (thickness ∼5 nm) with a film-like morphology is located near the tip, as marked by the dashed lines. The 1D concentration profiles of C and other alloying elements were extracted along the purple-coloured cylindrical region of interest covering the martensite and film-like C-enriched region, as marked in Fig. 7f. The average C content of the film was measured to be ∼3.8 at% (Fig. 7g). This value is well above the nominal C content of the steel (1.8 at%). This C-enriched film corresponds to RA, and this clearly indicates that C partitioning did occur during the Q&P processing. Furthermore, Fig. 7g shows a gradient of C distribution within RA. The C concentration in RA rises to ∼4 at% adjacent to the interface and drops to ∼3 at% in the interior. This is attributed to the sluggish diffusivity of C in RA and this observation is consistent with the published literature.34–36 Apart from the RA film, other C-enriched regions can also be observed in Fig. 7f. The elemental partitioning between the martensite and the coarser C-enriched region (thickness ∼20 nm) along the turquoise-coloured cylinder is presented in Fig. 7h. The concentration of C within the C-enriched region has appreciably increased to ∼23 at% (Fig. 7h), which is corroborated with the stoichiometric composition of C in θ carbide (Fe3C). The manganese content was found to have increased slightly, while a clear depletion of Si is visible in Fig. 7g. No significant partitioning of other alloying elements was observed between the carbide and the adjacent matrix. These results are consistent with previous APT studies reporting the rejection of Si and the enrichment of Mn in θ following the tempering of the as-quenched 4340 steel.36 The distribution of different alloying elements and C within the martensite matrix along the green coloured cylinder is presented in Fig. 7i. The average C concentration within martensite was estimated as ∼1.8 at% (Fig. 7i). These observations indicate that most of the C had either partitioned from martensite to RA or was used up in the formation of carbides during the Q&P processing.
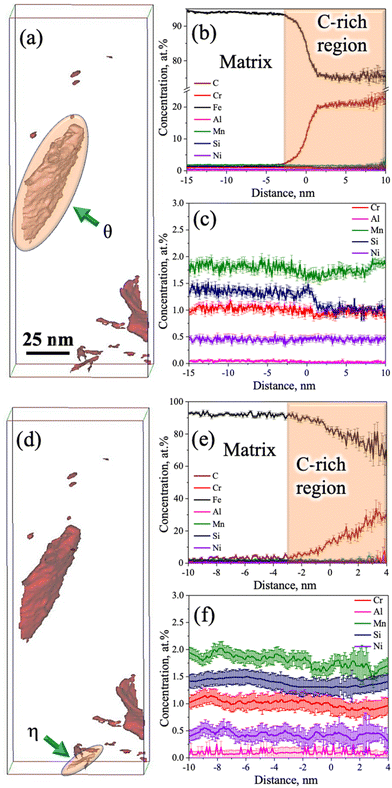
Furthermore, the redistribution of C across the martensite/carbide interface was assessed through proximity histograms. Fig. 8a shows the coarse C-enriched region (thickness ∼20 nm) corresponding to the 12 at% C iso-concentration surface (see Fig. 7e), as marked by an arrow in the 3D atom map and the respective proximity histogram is presented in Fig. 8b. The C concentration was found to have increased to ∼25 at% based on the calculated proximity histogram as shown in Fig. 8b. Distribution of other alloying elements can also be seen in Fig. 8c with the scale of the y-axis (in Fig. 8b) further magnified in the location of interest. The enrichment of Mn content and the depletion of Si in the carbide are clearly evident. Similarly, the proximity histogram of a fine C-enriched particle (thickness ∼5 nm) is located at the bottom corner, as indicated by an arrow in the 12 at% C iso-concentration surface (Fig. 8d), is displayed in Fig. 8e. The C concentration in this region has been found to increase from 1.8 at% to 33 at%, while Si concentration did not show any visible decrease (Fig. 8f). All other alloying elements were found to have uniform distribution too. Orthorhombic η carbide (Fe2C) is associated with a theoretical C content of ∼33 at% and Si is also soluble in Fe2C.31 Hence, this particle is attributed to η carbide, consistent with the relatively small precipitates observed in the TEM study with a similar morphology (Fig. 3j–l).
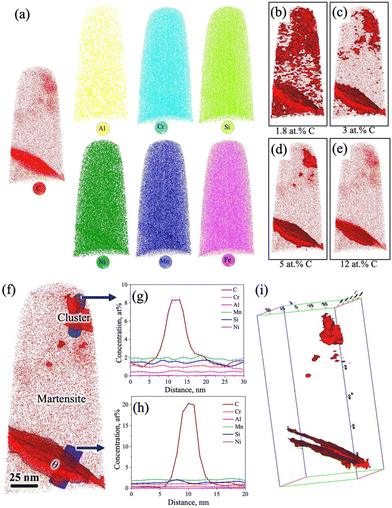
Fig. 9a shows the atom maps of C, Mn, Cr, Al, Ni, Si, and Fe in the low-Si steel sample Pt for 1000 s at 300 °C. The existence of a lens-shaped elongated C-rich region noticed in the C atom map (Fig. 9a) confirms the presence of carbide, but there seems to be no significant partitioning of other alloying elements (Mn, Cr, Al, Ni, and Si) between the carbide and the adjacent matrix phase. This result agrees well with previous APT studies of medium-C steels.15,32,33 There was no sign of C enrichment across any RA film in this low-Si steel specimen. Fig. 9b–e shows the iso-concentration surfaces with different carbon thresholds, i.e., 1.8 at%, 3 at%, 5 at%, and 12 at%, respectively. Small globular-shaped C-enriched features were observed within the martensite matrix on the 3 at% and 5 at% C iso-concentration surfaces, as shown in Fig. 9c and d, respectively. These globular-shaped features ranged in size from ∼5 to 50 nm. However, no such globular-shaped C-rich features were detected on the 12 at% iso-concentration surface, except for the lens-shaped elongated C-enriched plate at the lower end of the sample (Fig. 9e).
Fig. 9f shows an enlarged view of the 5 at% C iso-concentration surface (Fig. 9d). As mentioned, a globular-shaped C-enriched area is located at the top corner of the tip (Fig. 9f). The 1D concentration profiles of C and other alloying elements between martensite and the globular C-concentrated region were extracted along the blue-coloured cylinder across the C-enriched region, as shown in Fig. 9f. The average C-content of the globular C-enriched region was measured to be ∼9 at% (Fig. 9g), suggesting clustering of C in this globular C-enriched region. No significant partitioning of other alloying elements was observed between the globular C-concentrated region and the adjacent matrix. On the other hand, elemental partitioning between martensite and the coarse elongated C-enriched plate was ascertained along another blue-coloured cylinder located at the bottom corner (Fig. 9f), as shown in Fig. 9h. The average C concentration in this region surged to ∼22 at% (Fig. 9h), whereas the Si concentration decreased slightly, similarly as noticed in the case of medium-Si steel (Fig. 8c). This confirms the presence of θ carbide in the low-Si steel following partitioning at 300 °C for 1000 s. Fig. 9i represents a 3D atom map rotated by 45° relative to the atom map of C in Fig. 9f, which clearly reveals the presence of two parallel plates of θ carbides. A similar morphology of θ carbides was also noticed in TEM study for these samples (Fig. 4a and b).
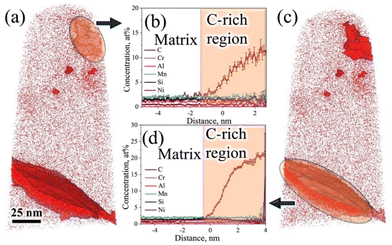
The proximity histograms of globular C-enriched and θ carbide regions, as marked by arrows in the corresponding locations in the 3D atom map with a 5 at% C iso-concentration surface (see Fig. 10a and c, respectively), are shown in Fig. 10b and d, respectively. These proxigrams illustrate the redistribution of C across martensite/C-rich interfaces as shown in Fig. 10b and d, respectively. Fig. 10b indicates that the maximum C level is ∼12 at%, which is well below the expected level for carbides, but greater than that expected for RA, signifying that these features are essentially clusters of C atoms. Similar clusters of C atoms within the martensite matrix have also been noticed in the quenched and tempered 4340 steel, as revealed by APT.36 On the other hand, the C level was found to be ∼22 at% across the coarse C-enriched plate interface, as presented in Fig. 10d, and this has been ascribed to the presence of θ carbide.
Computational methods
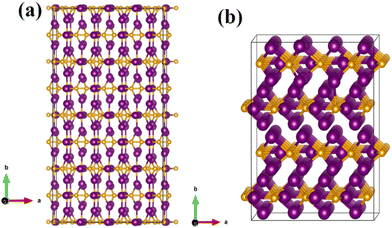 | ||
| Fig. 11 Optimized structures of (a) a 4 × 4 × 1 supercell of Fe2C and (b) the optimized 2 × 2 × 4 supercell of Fe3C. The purple and golden atoms represent Fe and C atoms, respectively. | ||
The concentrations of Si are indicated in Table 2 along with the corresponding cohesive energies. The formation energies reported were calculated using the ground state DFT, and the thermal contributions were not taken into account. This is due to the fact that phonon calculations on such large supercells with alloying elements are computationally too demanding and the phonon contribution to formation energies is rather insignificant to alter the values considerably. The resulting cohesive energy varies the most when Si replaces C in Fe2C. The structures with Si atoms, when substituted at the Fe sites, gain only slightly higher cohesive energies with Fe2C than when substituted for the C sites. This indicates that the given iron carbides can have slightly decreasing stability with an increase in the Si concentration. For further analysis, substitution of Si atoms at the Fe sites was considered. With an increase in the Si concentration occupying the Fe position, cohesive energy increases, suggesting a consequent decrease in the stability of iron carbide. On the other hand, if Si occupies C positions, the cohesive energy decreases, indicating decreasing stability. This indicates that the probability of Si carbide (SiC) formation is more feasible, rather than the formation of FeSi complexes with an increase in Si concentrations.
| Compound | Concentration of Si (wt%) | Cohesive energy (eV) | |
|---|---|---|---|
| Si substituted for C | Si substituted for Fe | ||
| Fe2C | 0.34% | 5.39 | 5.40 |
| 0.69% | 5.38 | 5.40 | |
| 1.38% | 5.27 | 5.42 | |
| Fe3C | 0.39% | 5.59 | 5.59 |
| 0.78% | 5.57 | 5.60 | |
| 3.1% | 5.56 | 5.61 | |
| System | Supercells | Total energy (eV) | Formation energy (eV) |
|---|---|---|---|
| BCC Fe | 4 × 4 × 4 (Fe-128 atoms) | −1054.4 | — |
| 102 Fe– 25 C–1 Si | −1052.1 | –2.34 | |
| 101 Fe–25 C–2 Si | −1049.7 | –2.31 | |
| FCC Fe | 3 × 3 × 3 (Fe-108 atoms) | −880.4 | — |
| 71 Fe–36 C–1 Si | −886.7 | –1.79 | |
| 70 Fe–36 C–2 Si | −885.3 | –1.74 |
Discussion
C redistribution, clustering, and transition carbide formation
This study clearly verifies the occurrence of C atom redistribution during the partitioning treatment of Si-bearing experimental 0.4 C steels. Irrespective of the Si content and partitioning temperatures, nucleation of η carbides in martensite was quite apparent prior to the formation of more stable θ carbides. During quenching to TQ, austenite to martensite transformation places C atoms in the unfavourable octahedral sites.37,38 Transition carbide precipitation during partitioning is mainly driven by lattice strains associated with the accommodation of C atoms, and in the early stages of partitioning, it is commonly assumed that C concentrations greater than 1 wt% can cause precipitation of orthorhombic η carbide directly from C-saturated martensite, thus avoiding the formation of hexagonal ε (Fe2.4C) carbide.38 During atom probe tomography, the ex situ analyses of samples from both low- and medium-Si steels revealed segregated coherent C clusters, randomly dispersed throughout the martensite with a C content of ∼9–12 at%, though there was no evidence of any partitioning of substitutional solutes. A fine-scale distribution of C-enriched clusters was noticed in the medium-Si steel, whereas, relatively coarse clusters formed in the low-Si steel. Presumably, these C-enriched regions denote the onset of η carbide precipitation. Transition carbides or other carbides exhibit specific crystal structures with defined atomic planes and interplanar spacing and explicit orientation relationships with the matrix phase, whereas clusters are only segregations of C atoms aggregated in the martensite matrix. The composition of clusters was first reported by Choo et al. with a stoichiometric ratio similar to the Fe4C structure.39 In our present study, the C contents within the cluster regions were estimated to be ∼9–12 at% C, which is lower than Fe4C. The estimated composition of a typical cluster in our case is closely similar to the Fe8C-type structure. Based on 3D-APT analysis, Zhu et al. identified the presence of fine C-enriched regions in an Fe–Ni–C alloy with C contents of ∼10 at% (Similar to the stoichiometry of Fe8C), in good agreement with our study.40 Through APT analysis, the existence of randomly dispersed C-enriched regions within the bainitic matrix of a nanobaintic steel following tempering at 400 °C for 30 min was also ascertained by Caballero et al.41 The approximate thickness and C content of these clusters were estimated to be ∼6 nm and ∼14 at%, respectively. Taylor et al. demonstrated that the C atom clustering process occurs by a continuous increase in the composition amplitude, which is a characteristic of the spinodal decomposition mechanism.37 Alternatively, the redistribution of solute atoms to dislocations in ferrite might also be associated with this fluctuation of solute concentration.42 Regardless of their formation mechanism, these C clusters might imply the prelude to the onset of transition carbide precipitation.η to θ transformation
A high Si (1.5 wt%) concentration in the high-Si steel retarded the transformation of transition η carbide to more stable θ carbide both at low (200 °C) and high (300 °C) partitioning temperatures, whereas partial transformation of η to θ carbide form might have occurred in the case of medium-Si steel. Barrow et al. reported that the conversion of transition carbides to θ relies on the partitioning of Si out of the carbide.38 According to this hypothesis, a Si-free region in the matrix was required for the nucleation of θ. Based on the 3D-APT results of the medium-Si steel partitioned at 300 °C, it can be noticed that the measured Si content within θ was lower than the Si present in the martensite matrix (Fig. 10c). However, at low partitioning temperature (200 °C), the existence of only η precipitates was observed (Fig. 5d and e). At low partitioning temperature, the diffusion of substitutional elements was negligible, but under prolonged partitioning duration at a relatively high temperature (300 °C), the trapped Si within θ diffused out from θ carbides to the interfaces. According to Owen, Si rejected from θ acts as a growth barrier and inhibits θ precipitation.43 In a recent study, Zhu et al. noticed that the rejected Si built up a layer rich in Si at the interface.33 For continuous carbide growth, further diffusion of C atoms is needed. The presence of a Si-rich layer, however, will reduce the C flux into the carbide across the interface. Hence, the carbide growth would be controlled by the diffusion rate of Si within θ. This mechanism has also been reported by Barrow and Rivera-Díaz-del-Castillo.44Growth of θ
In the low-Si steel TP at 300 °C, the occurrence of both inter- and intra-lath θ precipitation was revealed. The size of θ plates appeared to be slightly large in the low-Si steel (Fig. 4a and b), suggesting an unhindered carbide growth during the partitioning process at 300 °C, apparently due to the low level of Si in the steel and hence, a negligible barrier to carbide growth. This might be due to the completion of η to θ transition at the very early stage of partitioning, followed by the growth of θ that is controlled by C diffusion under these conditions. On the other hand, the growth of θ was remarkably retarded by the addition of Si in high/medium-Si steels.Cementite is incoherent with the ferrite/martensite matrix and generally strengthens the steel by Orowan mechanisms, thus providing high hardness and wear resistance, though at the expense of ductility and toughness. Under plastic deformation, stress concentration is generated at the cementite interface, eventually leading to the occurrence of microcracks. Therefore, the toughness of the steel decreases with an increase in the cementite size. In contrast, the transition carbides have some degree of coherency with the matrix and introduce strengthening by coherency mechanisms and enhance the work hardening rate.44 Barrow et al. conducted systematic investigation of the low temperature precipitation reaction in 100Cr5 steel (1C-0.3Si-0.3Mn-1.4Cr) and achieved optimal properties by aptly tailoring the precipitation of transition carbide and preventing the formation of cementite.44 Therefore, it is important to carefully control the amount and distribution of transition carbides in the steel to obtain optimal mechanical properties.
DFT simulation
DFT simulated results showed that when Si is substituted in an Fe lattice, it is more energetically favourable to precipitate as θ rather than η carbide. Based on the experimental results, however, it is evident that Si-alloying effectively suppresses θ formation, but it has seemingly a minor influence on the precipitation of η carbide. Our observation agrees well with previous studies that reported the stabilization of ε-carbide in a steel containing high Si content.22 Moreover, Jang et al. demonstrated that Si has a coherency effect on stabilizing transition carbides, since incorporating Si increases coherency at carbide–matrix interfaces.45 A similar finding was made by Barrow et al., which showed that precipitation is dependent on the misfit energy between carbide and the matrix.44 Hence, to gain a detailed insight into the phase transformations/carbide transition/precipitation occurring during partitioning, new model needs to be developed considering both thermodynamic and misfit factors.Conclusions
(1) C clusters were randomly dispersed throughout the martensitic ferrite matrix of all the steels with different Si variants and at all the partitioning temperatures, with the C content varying in a narrow range of ∼10–12 at%, though there was no evidence of substitutional solute partitioning. These C-enriched regions are likely to be associated with C segregations at lattice defects and possibly denote a prelude to the commencement of η-carbide precipitation.(2) The TEM analysis of high-Si steel Pt for 1000 s at 300 °C showed the presence of η-carbides. The η-carbide partially decomposed into θ in the case of medium-Si steel, whereas θ was solely seen in low-Si steel under the identical Q&P conditions. However, irrespective of the Si-level, all three steels after partitioning for 1000 s at 200 °C revealed the formation of only η-carbides within the martensitic laths. Also, a gradual increase in η carbide fraction was observed from high-Si to low-Si steels as a consequence of the decrease in Si content.
(3) Although alloying with Si in 0.4 wt% steel was intended to prevent carbide formation, it was found to have only delayed the formation of θ, rather than completely avoid it. Overall, the observations made in the study suggest that Si-alloying does inhibit θ formation effectively, at least for a certain duration. For the studied Q&P conditions, it can be postulated that a high Si content (1.5 wt%) in the steel can stabilize η-carbides, whereas a decrease in Si level can lead to a gradual decrease in the stability of η-carbide, thus leading to its transformation into more stable θ carbides.
(4) In contrast, first-principles calculations show that the thermodynamic stability of η-carbide and θ depended on the Si atom substituted in the Fe lattice. It was predicted that Si atoms, when substituted at the Fe sites, possessed higher cohesive energy than when substituted in the C sites. This indicates that there is a general trend of decrease in the stability of carbides with an increase in Si. A comparison of how Si affects the enthalpy of carbide formation for austenite and martensite revealed that carbide formation was energetically more favourable in martensite rather than austenite, in agreement with the experimentally measured concentration ratios.
Author contributions
S. G. performed the experiments and wrote the original draft. K. R. and S. R. performed the APT investigation and data analysis. A. A. S. D. conducted the DFT calculation and data analysis. S. P. and M. S. co-wrote, reviewed, and edited the manuscript. M. H. and J. K supervised, reviewed, and edited the manuscript, and acquired the financial support for the project leading to this publication. All the authors proofread and approved the final manuscript for submission.Conflicts of interest
There are no conflicts to declare.Acknowledgements
The authors express their gratitude to Jane ja Aatos Erkon säätiö (JAES), Tiina ja Antti Herlinin säätiö (TAHS), and the Academy of Finland (grant No. #311934) for their financial support on the Advanced Steels for Green Planet project and the Genome of Steel (Profi3) project. Special thanks are also due to Prof. (Emer.) David A. Porter for assisting with the design of the alloys. The NFAPT, India (National Facility for Atom Probe Tomography) facility, coordinators, and engineers are gratefully acknowledged for support towards critical 3D APT. The CSC-IT Center for Science, Finland is acknowledged for computational resources.References
- E. J. Seo, L. Cho, Y. Estrin and B. C. De Cooman, Acta Mater., 2016, 113, 124–139 CrossRef CAS.
- S. Ghosh, P. Kaikkonen, V. Javaheri, A. Kaijalainen, I. Miettunen, M. Somani, J. Kömi and S. Pallaspuro, J. Mater. Res. Technol., 2022, 17, 1390–1407 CrossRef CAS.
- M. C. Somani, D. A. Porter, L. P. Karjalainen and D. K. Misra, Int. J. Metall. Eng., 2013, 2, 154–160 Search PubMed.
- S. Ghosh, I. Miettunen, M. C. Somani, J. Kömi and D. Porter, Mater. Today: Proc., 2021, 46, 2131–2134 CAS.
- J. Speer, D. K. Matlock, B. C. De Cooman and J. G. Schroth, Acta Mater., 2003, 51, 2611–2622 CrossRef CAS.
- D. V. Edmonds, K. He, F. C. Rizzo, B. C. De Cooman, D. K. Matlock and J. G. Speer, Mater. Sci. Eng. A, 2006, 438, 25–34 CrossRef.
- M. J. Santofimia, L. Zhao, R. Petrov, C. Kwakernaak, W. G. Sloof and J. Sietsma, Acta Mater., 2011, 59, 6059–6068 CrossRef CAS.
- I. Miettunen, S. Ghosh, M. C. Somani, S. Pallaspuro and J. Kömi, J. Mater. Res. Technol., 2021, 11, 1045–1060 CrossRef CAS.
- M. C. Somani, D. A. Porter, L. P. Karjalainen and R. D. K. Misra, Metall. Mater. Trans. A, 2014, 45, 1247–1257 CrossRef CAS.
- S. Wang, A. A. Kistanov, G. King, S. Ghosh, H. Singh, S. Pallaspuro, A. Rahemtulla, M. Somani, J. Kömi, W. Cao and M. Huttula, Acta Mater., 2021, 221, 117361 CrossRef CAS.
- Z. Dai, Z. Yang, C. Zhang and H. Chen, Acta Mater., 2020, 200, 597–607 CrossRef CAS.
- Y. Toji, G. Miyamoto and D. Raabe, Acta Mater., 2015, 86, 137–147 CrossRef CAS.
- S. Ghosh, K. Rakha, S. Reza, M. Somani and J. Kömi, Mater. Today: Proc., 2022, 62, 7570–7573 CAS.
- D. T. Pierce, D. R. Coughlin, D. L. Williamson, K. D. Clarke, A. J. Clarke, J. G. Speer and E. De Moor, Acta Mater., 2015, 90, 417–430 CrossRef CAS.
- J. Zhang, Z. Dai, L. Zeng, X. Zuo, J. Wan, Y. Rong, N. Chen, J. Lu and H. Chen, Acta Mater., 2021, 217, 117176 CrossRef CAS.
- M. Koyama, Y. Yu, J. X. Zhou, N. Yoshimura, E. Sakurada, K. Ushioda and H. Noguchi, Mater. Sci. Eng. A, 2016, 667, 358–367 CrossRef CAS.
- Z. Wu, Z. Liu and X. Li, Microstructural effects on the fracture toughness of advanced high strength steels, Mater. Lett., 2020, 271, 127761 CrossRef CAS.
- M. Wallner, R. Schneider, K. Steineder and C. Sommitsch, Effect of Si and Al on microstructure-property-relationship of Q&P-steels during galvannealing, Mater. Sci. Technol., 2021, 37, 182–189 CrossRef CAS.
- E. Kozeschnik and H. K. D. H. Bhadeshia, Influence of silicon on cementite precipitation in steels, Mater. Sci. Technol., 2008, 24, 343–347 CrossRef CAS.
- H. Okada, T. Fukagawa, H. Ishihara, A. Okamoto, M. Azuma and Y. Matsuda, Prevention of red scale formation during hot rolling of steels, ISIJ Int., 1995, 35, 886–891 CrossRef.
- P. Huyghe, M. Caruso, J. L. Collet, S. Dépinoy and S. Godet, In Situ Quantitative Assessment of the Role of Silicon During the Quenching and Partitioning of a 0.2C Steel, Metall. Mater. Trans. A, 2019, 50, 3486–3494 CrossRef CAS.
- B. Kim, J. Sietsma and M. J. Santofimia, The role of silicon in carbon partitioning processes in martensite/austenite microstructures, Mater. Des., 2017, 127, 336–345 CrossRef CAS.
- F. HajyAkbary, J. Sietsma, G. Miyamoto, T. Furuhara and M. J. Santofimia, Interaction of carbon partitioning, carbide precipitation and bainite formation during the Q&P process in a low C steel, Acta Mater., 2016, 104, 72–83 CrossRef CAS.
- J. H. Jang, I. G. Kim and H. K. D. H. Bhadeshia, ε-Carbide in alloy steels: first-principles assessment, Scr. Mater., 2010, 63, 121–123 CrossRef CAS.
- M. K. Miller, P. A. Beaven, S. S. Brenner and G. D. W. Smith, An atom probe study of the aging of iron-nickel-carbon martensite, Metall. Trans. A, 1983, 14A, 1021–1024 Search PubMed.
- G. Kresse and J. Hafner, Ab initio molecular-dynamics simulation of the liquid-metal-amorphous semiconductor transition in germanium, Phys. Rev. B: Condens. Matter Mater. Phys., 1994, 49, 14251–14269 CrossRef CAS PubMed.
- G. Kresse and D. Joubert, From ultrasoft pseudopotentials to the projector augmented-wave method, Phys. Rev. B: Condens. Matter Mater. Phys., 1999, 59, 1758–1775 CrossRef CAS.
- J. Perdew, K. Burke and M. Ernzerhof, Generalized gradient approximation made simple, Phys. Rev. Lett., 1996, 77, 3865–3868 CrossRef CAS PubMed.
- H. J. Monkhorst and J. D. Pack, Special points for brillouin-zone integrations, Phys. Rev. B: Solid State, 1976, 13, 5188–5192 CrossRef.
- P. Zhang, Y. Chen, W. Xiao, D. Ping and X. Zhao, Twin structure of the lath martensite in low carbon steel, Prog. Nat. Sci.: Mater. Int., 2016, 26, 169–172 CrossRef CAS.
- W. Lu, M. Herbig, C. H. Liebscher, L. Morsdorf, R. K. W. Marceau, G. Dehm and D. Raabe, Formation of eta carbide in ferrous martensite by room temperature aging, Acta Mater., 2018, 158, 297–312 CrossRef CAS.
- Y. Toji, H. Matsuda, M. Herbig, P. P. Choi and D. Raabe, Atomic-scale analysis of carbon partitioning between martensite and austenite by atom probe tomography and correlative transmission electron microscopy, Acta Mater., 2014, 65, 215–228 CrossRef CAS.
- C. Zhu, X. Y. Xiong, A. Cerezo, R. Hardwicke, G. Krauss and G. D. W. Smith, Three-dimensional atom probe characterization of alloy element partitioning in cementite during tempering of alloy steel, Ultramicroscopy, 2007, 107, 808–812 CrossRef CAS PubMed.
- M. J. Santofimia, L. Zhao and J. Sietsma, Model for the interaction between interface migration and carbon diffusion during annealing of martensite–austenite microstructures in steels, Scr. Mater., 2008, 59, 159–162 CrossRef CAS.
- M. J. Santofimia, J. G. Speer, A. J. Clarke, L. Zhao and J. Sietsma, Influence of interface mobility on the evolution of austenite–martensite grain assemblies during annealing, Acta Mater., 2009, 57, 4548–4557 CrossRef CAS.
- A. J. Clarke, J. Klemm-Toole, K. D. Clarke, D. R. Coughlin, D. T. Pierce, V. K. Euser, J. D. Poplawsky, B. Clausen, D. Brown, J. Almer, P. J. Gibbs, D. J. Alexander, R. D. Field, D. L. Williamson, J. G. Speer and G. Krauss, Perspectives on Quenching and Tempering 4340 Steel, Metall. Mater. Trans. A, 2020, 51, 4984–5005 CrossRef CAS.
- K. A. Taylor, G. B. Olson, M. Cohen and J. B. Vander Sande, Carbide precipitation during stage I tempering of Fe-Ni-C martensites, Metall. Trans. A, 1989, 20, 2749–2765 CrossRef.
- A. T. W. Barrow, J. H. Kang and P. E. J. Rivera-Díaz-del-Castillo, The ε → η → θ transition in 100Cr6 and its effect on mechanical properties, Acta Mater., 2012, 60, 2805–2815 CrossRef CAS.
- W. K. Choo and R. Kaplow, Mössbauer measurements on the aging of iron-carbon martensite, Acta Metall., 1973, 21, 725–732 CrossRef CAS.
- C. Zhu, A. Cerezo and G. D. W. Smith, Carbide characterization in low-temperature tempered steels, Ultramicroscopy, 2009, 109, 545–552 CrossRef CAS PubMed.
- F. G. Caballero, M. K. Miller, C. Garcia-Mateo, C. Capdevila and S. S. Babu, Redistribution of alloying elements during tempering of a nanocrystalline steel, Acta Mater., 2008, 56, 188–199 CrossRef CAS.
- F. G. Caballero, M. K. Miller and C. Garcia-Mateo, Atom Probe Tomography Analysis of Precipitation during Tempering of a Nanostructured Bainitic Steel, Metall. Mater. Trans. A, 2011, 42, 3660–3668 CrossRef CAS.
- W. S. Owen, The effect of silicon on the kinetics of tempering, Trans. ASM, 1954, 46, 812–829 Search PubMed.
- A. T. W. Barrow and P. E. J. Rivera-Díaz-del-Castillo, Nanoprecipitation in bearing steels, Acta Mater., 2011, 59, 7155–7167 CrossRef CAS.
- J. H. Jang, I. G. Kim and H. K. D. H. Bhadeshia, ε-Carbide in alloy steels: First-principles assessment, Scr. Mater., 2010, 63, 121–123 CrossRef CAS.
| This journal is © The Royal Society of Chemistry 2023 |

