 Open Access Article
Understanding the thermomechanical behavior of graphene-reinforced conjugated polymer nanocomposites via coarse-grained modeling†
Yang
Wang
 ab,
Zhaofan
Li
c,
Dali
Sun
d,
Naisheng
Jiang
a,
Kangmin
Niu
*a,
Andrea
Giuntoli
*b and
Wenjie
Xia
 *c
*c
aSchool of Materials Science and Engineering, University of Science and Technology Beijing, Beijing, 100083, China. E-mail: niukm@ustb.edu.cn
bZernike Institute for Advanced Materials, University of Groningen, Groningen, 9747AG, The Netherlands. E-mail: giuntoli@rug.nl
cDepartment of Aerospace Engineering, Iowa State University, Ames, IA 50011, USA. E-mail: wxia@iastate.edu
dDepartment of Electrical & Computer Engineering, University of Denver, Denver, CO 80210, USA
First published on 18th October 2023
Abstract
Graphene-reinforced conjugated polymer (CP) nanocomposites are attractive for flexible and electronic devices, but their mechanical properties have been less explored at a fundamental level. Here, we present a predictive multiscale modeling framework for graphene-reinforced poly(3-alkylthiophene) (P3AT) nanocomposites via atomistically informed coarse-grained molecular dynamics simulations to investigate temperature-dependent thermomechanical properties at a molecular level. Our results reveal reduced graphene dispersion with increasing graphene loading. Nanocomposites with shorter P3AT side chains, lower temperatures, and higher graphene content exhibit stronger mechanical responses, which correlates with polymer dynamics. The elastic modulus increases linearly with the graphene content, which slightly deviates from the “Halpin–Tsai” micromechanical model prediction. Local stiffness analysis shows that graphene possesses the highest stiffness, followed by the P3AT backbone and side chains. Deformation-induced stronger chain alignment of the P3AT backbone compared to graphene may further promote conductive behavior. Our findings provide insights into the dynamical heterogeneity of nanocomposites, paving the way for understanding and predicting their thermomechanical properties.
1. Introduction
Solution-processable conjugated polymers (CPs) are an important class of materials that possess considerable potential for low-cost and scaled production of light weight, flexible, and large-area optical and electronic devices, such as bulk heterojunction (BHJ) organic solar cells,1,2 organic field-effect transistors (OFETs),3 light-emitting diodes,4 and electronic skin.5 CPs combine a relatively rigid π-conjugation backbone and a long flexible peripheral side chain for enabling the charge travel along the backbone and improving the devices with mechanical robustness, respectively. Among diverse CPs, poly(3-alkylthiophene) (P3AT) and its derivatives have been extensively utilized in various fields due to their glass-forming capability, ease of solution processing, and ease of production in large quantities (>10 kg).6–9 In general, for stretchable, flexible, portable, and wearable devices of CPs, thermomechanical properties (e.g., glass transition, tensile modulus, and toughness) are of critical importance during fabrication and application. Naturally, carbonaceous materials, like graphene and carbon nanotubes, which behave as an electrically conducting bridge between the CP domains in the composites, are considered promising reinforcements to CP-based composites.10–14 Moreover, the low consumption of high-cost semiconductor polymers and the mass production of high-performance graphene contribute to the low-cost fabrication of conjugated polymer–graphene composite materials.Numerous studies have explored the electronic properties of CPs; the thermomechanical behaviors are equally important from a pratical standpoint but poorly studied when CPs are utilized for flexible devices, especially when soft devices have been miniaturized down to the nanometer scale. Therefore, understanding the chemical composition and structural information that govern the mechanical properties of semiconducting polymers is vital for the fabrication of large-scale flexible devices. Side chain length is a useful parameter for tuning mechanical properties; Jiang et al.15 studied the side chain length effect on the mechanical properties of crystalline P3AT nanofibers using thermal shape fluctuation analysis and single-molecule force spectroscopy, revealing the highest strength of P3HT among all P3ATs due to different unfolding schemes. As for the P3AT thin film, Lipomi et al.16 reported that the tensile modulus decreased dramatically as the side chain length increased from 4 to 8 alkyl carbons, which was also reproduced in their molecular simulation work.17 Furthermore, conductive graphene and carbon nanotubes are appropriate nanomaterials for enhancing the electron conduction and thermomechanical behavior of CPs.18,19 Theoretically, Zhang et al.20 recently explored the enhancement of the mechanical properties of graphene and carbon-nitride reinforced P3HT nanocomposites using an atomistic model, which serves for the detailed observation of the fracture mechanism but the sample scale is too small to compare with the actual size.
Coarse-grained molecular dynamics (CG-MD) simulation allows for “bottom-up” investigations of polymer nanocomposite systems over extended spatiotemporal as the atomistic model can hardly be accessible, making the modification of the monomer structure and chemical composition relatively easier than that in a real experiment. The coarse-graining approach usually treats a cluster of atoms as one super-bead. It simultaneously preserves the key chemical features, improving the computational efficiency by decreasing the degree of freedom.86 However, the energy landscape of the CG model is smoother than that of the atomistic model due to the inevitable loss of atomic friction and configurational entropy (sc) upon coarse-graining, causing artificially accelerated dynamics and softer mechanical responses,21–24 and further limiting the practical application of the CG model. For example, Huang et al.25 first developed a CG model of P3HT using a three-bead-per-monomer mapping scheme (three-site model); although their model captures the self-assembly and dynamic evolution of P3HT and its mixtures with C60, further study26 revealed that this model would cause significant deviation in the density and diffusion coefficients compared to the AA counterpart at varying temperatures. A coarser mapping scheme by Lee et al.27 treated one P3HT monomer as one single bead (one-site model), which causes a severe loss of chemical-specific character. Lipomi et al.17 subsequently showed that one-site CG model yields significantly inaccurate values of density and tensile modulus compared to the three-site model due to the insufficient details to reflect the underlying atomistic system, necessitating accurate CG modeling and precise force field development.
To address this issue, we proposed a novel dynamically consistent coarse-graining strategy, termed the energy-renormalization (ER) approach, to develop a temperature-transferable P3HT CG model that enables the reappearance of thermodynamic (density) and dynamic (Debye–Waller factor, DWF) properties of the P3HT AA model over a wide temperature range.28 In general, the methodology of the ER approach originated from the Adam and Gibbs (AG) theory of cooperative relaxation in glass-forming systems and the generalized entropy theory (GET) of glass formation,29–31 both of which emphasize the critical effect of sc on polymer dynamics. Our previous work has shown that this sc loss of the CG model could be compensated by renormalizing the enthalpy of the system (i.e., the “entropy-enthalpy compensation” effect).32 Specifically, we introduced ER factors α(T) and β(T) to rescale the nonbonded LJ potential parameters, enabling the CG model to preserve the temperature-dependent Debye–Waller factor 〈u2〉 and the density of the target AA model. Encouragingly, the CG P3HT system reproduces the mechanical response of the target AA model.28
In the present work, we reparametrize ER factors for P3AT CG models with different side chain lengths to explore the dynamical behavior and thermomechanical properties of P3ATs and graphene-reinforced P3AT composites at different temperatures and graphene contents. Specifically, we examined the mechanical response of graphene-reinforced P3AT nanocomposites and analyzed them with a modified Halpin–Tsai micromechanical model. By evaluating the dynamical heterogeneity, we could gain a general relationship between the local stiffness and thermomechanical properties of the nanocomposite system. The chain alignment was also studied under the strain effect. This work highlights the critical role of temperature in accurately coarse-grained modeling polymers and offers a valuable tool for designing and predicting nanocomposites with tailored properties accommodating to different application scenarios.
2. Computational method and simulation procedures
2.1. Simulation model setup
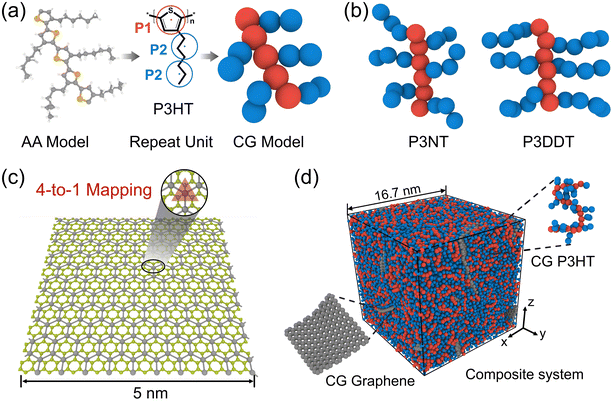
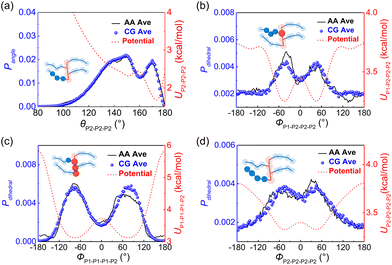
Following our previous CG modeling framework,28 the atomistically informed P3HT CG model in this work is depicted in Fig. 1a, where each P3HT monomer is represented by two types of CG bead, i.e., P1 and P2, corresponding to the thiophene ring and three consecutive hexyl side chain methyl groups, respectively. The coarse-grained mapping scheme in this work is slightly different from the previous work to explore the side chain length effect of P3AT. It is to be noted that the general class of poly(3-alkylthiophenes) (P3ATs) containing side chains longer than hexyl groups, i.e., nonyl (N) and dodecyl (DD) groups, are also considered in the present work, corresponding to P3NT and P3DDT with three and four P2 beads per side chain, respectively (Fig. 1b). The force center is located at the center of mass of atoms underlying the CG bead. The general CG potentials of P3HT used in this work are shown in Table S1† which were systematically developed in our previous work using the iterative Boltzmann inversion (IBI) approach.28 To explore P3ATs with different architectures, we derived the extra bonded interactions of CG P3ATs with longer side chain lengths. Specifically, we chose the all-atom P3DDT model to obtain the extra bonded potentials of the P2–P2–P2 angle term, P1–P1–P1–P2, P1–P2–P2–P2, and P2–P2–P2–P2 dihedral terms. The initial configuration of atomistic P3DDT is constructed using the Materials Studio platform. The Dreiding force field containing bonded (bond, angle, and dihedral) and non-bonded terms are employed for AA P3DDT33 and the Gasteiger34 method is adopted to calculate system atomic charges for electrostatic interactions. The Dreiding force field has been successfully utilized to describe the self-organization and structure of pure crystalline and amorphous P3HT35 and the solution conformation of donor–acceptor conjugated polymers in the implicit solvent.36 It should be noted that a single P3DDT chain system with chain length N = 50 and 800 P3DDT monomer is employed to derive the CG bonded and nonbonded interactions for computational expediency. Energy minimization is first performed using the conjugate gradient algorithm.37 Then the system was equilibrated in the melt state at a high T of 1000 K under the NPT ensemble for 2.5 ns with the pressure ramping from the initial 1000 atm to the final 100 atm. Afterward, the system is further cooled down to 300 K and 1 atm pressure under an NPT ensemble for 4 ns before sampling. Following equilibration, a 2 ns duration NPT ensemble simulation is performed to collect the atomistic trajectories with a sampling interval of 1 ps. The periodic boundary conditions are applied in all three directions to simulate the bulk behavior. An integration timestep Δt of 1 fs and 3 fs is used for the AA and CG simulations, respectively. A Nose/Hoover barostat and thermostat are applied to control the temperature and pressure of the system. The temperature-damping and pressure-damping parameters are assigned to be 100 fs and 1000 fs for the AA model, and 300 fs and 3000 fs for the CG models, respectively.Based on the defined CG mapping scheme, the target bonded probability distributions can be directly obtained using the center of mass of atoms underlying the CG bead through AA simulation, as the black solid lines are shown in Fig. 2. Then the CG-bonded interactions are derived using the IBI method.28,38,39
 | (1) |
Generally, atomic friction and configurational entropy (sc) of the CG model are inevitably lost upon coarse-graining due to the elimination of some unnecessary degrees of freedom,40 making the CG model overestimate the dynamics and underestimate the mechanical response, especially when the temperature rises.23,41 To address this issue, we successfully employed the ER approach for the P3HT CG model in our previous work, capturing the density, dynamics, and mechanical behaviors of the CG model compared to the target AA model over a wide temperature range.28 Here, we extend this approach to P3ATs with longer side chain lengths, yielding a generalized temperature-dependent 12-6 Lennard-Jones (LJ) potential function:
 | (2) |
| UTotal = Ubond + Uangle + Udihedral + Uimproper + UvdW | (3) |
The parameters related to the nonbonded cohesive interaction as well as α(T) and β(T) are summarized in Table 1. For a more in-depth discussion of the ER approach for deriving a temperature-transferable P3HT CG model, we refer the reader to our recent work for details.28
2.2. P3AT/graphene nanocomposite model
To construct P3AT/graphene (P3AT/Gr) nanocomposites, we utilized a recently developed mechanically consistent 4-1 mapping CG graphene model (C bead) and the corresponding CG potential TersoffCG(4-1),48 building upon the modified Tersoff potential49 and ‘hard’ cut-off scheme (Fig. 1c).50 The CG graphene model possesses Young's modulus of 1 TPa, and fracture strengths of 99.26 and 128.04 GPa for the armchair and zigzag monolayer CG graphene, respectively, which is consistent with the experimental results obtained by Lee et al.51 and utilized to study the interfacial mechanics of the PMMA/graphene composite.48 All parameters of the modified TersoffCG(4-1) potential are listed in Table S2.† The nonbonded interaction parameters of εCC and σCC for different CG graphene flakes are chosen as 0.82 kcal mol−1 and 3.46 Å.52 We refer readers to our previous work50 about the coarse-graining procedure of the CG graphene model, where the parameterization of the original Tersoff potential is well elaborated. For describing the nonbonded interactions between different CG bead species, i.e., P1, P2, and C, we utilized the cross-interaction terms taking the arithmetic average for σij = (σii + σjj)/2 and the geometric average for , respectively, which was a common choice for graphene-reinforced polymer nanocomposites in previous work.53,54 The choice of the LJ parameter and interaction between polymer and graphene is characterized in Fig. S5 of the ESI.† It should be noted that graphene retains superior mechanical properties at elevated temperatures, and Young's modulus decreases by 2.2% from 0 to 1000 K.55 Thus, the LJ parameters of the graphene CG model are not considered to vary with temperature due to the small amount of graphene addition and limited temperature range studied in the present work. Next, we combined the P3ATs with the CG graphene sheet to generate graphene-reinforced P3AT nanocomposites, as shown in Fig. 1d.
2.3. Simulation details
To generate a representative P3AT/graphene nanocomposite, an in-house Python script is used to randomly pack 800 P3HT, 600 P3NT, and 480 P3DDT chains with 20 monomers per chain into an initial simulation box to keep the same number of beads in all the pristine CP systems. Different numbers of polymer chains are also tested for pristine P3NT systems, where no significant size dependence of mechanical properties is observed, as shown in Fig. S6.† The initial simulation box is in a relatively low-density state to avoid chain entanglement. To explore the effect of the graphene content, we randomly insert graphene sheets into the polymer matrix, yielding P3AT/graphene composites with 5, 10, and 15 wt% content of graphene. The graphene flake has a size of 50 Å × 50 Å. Periodic boundary conditions are applied in all directions to simulate bulk behavior. Before the simulation, a randomly distributed initial velocity based on a temperature of 500 K is used to initialize the structure. Then the composite system is minimized using the iterative conjugant gradient algorithm.37 We perform a 3 ns duration annealing cycle to condense the composite system with the temperature ramping from 500 to 300 K and pressure ramping from 1000 to 1 atm. After that, the system is further equilibrated under the NPT ensemble with a temperature of 300 K and a pressure of 1 atm for 400 ps, accompanied by sampling data with sampling intervals of 60 fs. An integration timestep of 3 fs is adopted for all CG molecular simulations. The tensile deformation is conducted using the strain-controlled method with a strain rate of 0.5 ns−1, which is widely used in MD simulation22,28,47,56,57 although it is much higher than the experiment due to the current computational limitation. It is noted that the main conclusions of this work remain the same with different strain rates, as discussed in the ESI.† Model establishment and simulations in this paper are implemented in the large-scale atomic/molecular massively parallel simulator (LAMMPS) package.58 The MDAnalysis (https://www.mdanalysis.org),59 an object-oriented Python toolkit, is used to analyze molecular dynamics trajectories. Simulation visualizations are implemented using the software OVITO.602.4. Properties calculation
The virial stress was used to relate to the macroscopic (continuum) stress in molecular dynamics computations.61 | (4) |
 | (5) |
 | (6) |
3. Results and discussion
3.1. Glass transition temperature
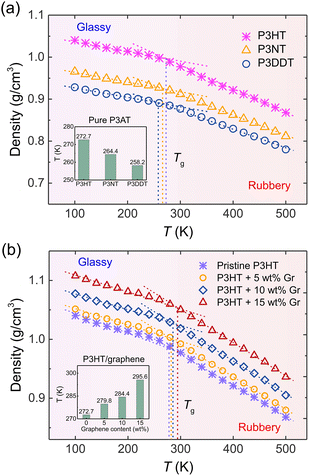
The thermal property of CP is one of the most important indicators for the processing and stability of semiconducting devices, which is closely related to mechanical responses, like tensile modulus and toughness.17 Experimentally, researchers utilized side chain engineering to tune a polymer's physical properties, such as adsorption, molecular packing, glass transition temperature (Tg), and solubility by introducing linear and branched alkyl chains to the rigid backbone.65–67 To test the thermal properties of our nanocomposite systems, we systematically characterized Tg under the effects of the side chain length of P3ATs and the graphene content using the step-cooling method. As shown in Fig. 3, the Tg was determined as the intersection point of the linear fitting of high- and low-temperature ranges, respectively, showing that P3HT has the highest Tg value among three P3ATs, i.e., 272.7 K (inset of Fig. 3a), which agrees well with experimental Tg ∼ 270 to 282 K for regio-random P3HT,68 demonstrating the efficiency of the ER corrected CG model in describing the different architecture of P3ATs. Next, we determined the Tg of the P3HT/graphene system with different graphene contents. The dashed line and inset of Fig. 3b shows the glass transition regime, revealing slightly elevated Tg values from 272.7 K, 279.8 K, 284.4 K, to 295.6 K with the addition of graphene from 0 to 15 wt%. Although the results show that the a shorter side chain of the P3ATs and higher graphene content of P3HT/graphene nanocomposites lead to a higher density and slightly higher Tg, it is to be noted that the choice of the fitting region of temperature significantly impacts the Tg value,69 demonstrating that significant care should be taken in the analysis.3.2. Tensile deformation and micromechanical model
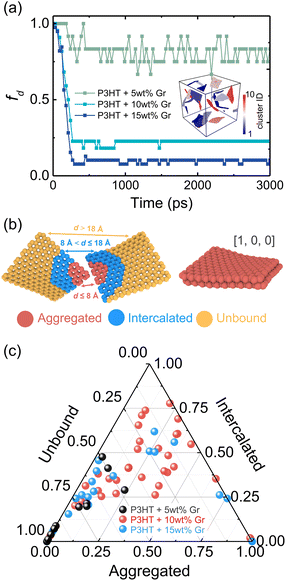
The dispersion state of graphene in composites is a critical factor, in shaping their overall performance and capabilities. It directly impacts mechanical strength, conductivity, thermal, and barrier properties.71 Before conducting the tensile deformation, we characterized the dispersion state of graphene sheets based on the distribution of nearest neighbor distances for CG graphene flake atoms. Cha et al.72 proposed that when the minimum separation between CG beads in two different graphene flakes was less than 3.5 × σCC, they were regarded as agglomerated. The degree of dispersion can be quantified with fd in the range 0–1: | (7) |
 | (8) |
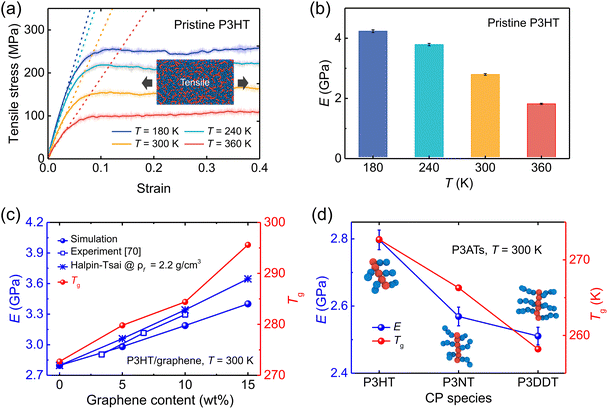 | ||
| Fig. 5 Mechanical properties (tensile deformation) of the pristine P3ATs and graphene-reinforced P3AT nanocomposites. (a) Stress–strain curves of pristine P3HT bulk systems under different temperatures of 180, 240, 300, and 360 K, respectively. The translucent fluctuating lines denote the original rough stress–strain curves, and the highlighted lines represent the smoothed stress values. Dashed lines represent the linear fitting of the elastic stage (strain < 4%) and are used to determine Young's modulus. (b) Young's modulus of the pristine P3HT under different temperatures. (c) Young's modulus (left y-axis) and glass transition temperatures (right y-axis) vs. graphene content of P3HT/graphene nanocomposites. The experimental,70 Halpin–Tsai predictive Young's modulus of P3HT/graphene nanocomposites is also shown for comparison. (d) Effect of the side chain length of pristine P3ATs on Young's modulus (left y-axis) and glass transition temperatures (right y-axis). | ||
To predict the elastic properties of the P3HT/graphene nanocomposites, we introduce the well-established Halpin–Tsai micromechanical model, which is widely used for graphene-reinforced nanocomposites since it is the only model accounting for the effects of geometry and size of plate-like graphene fillers:74–76
 | (9) |
 | (10) |
 | (11) |
 | (12) |
 | (13) |
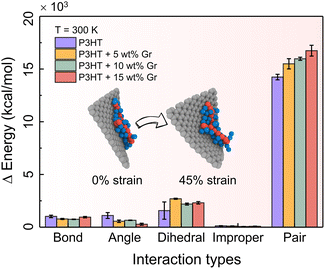
To enhance the comprehension of the impact of energy branches within the system on tensile response, we undertake a comparative assessment of the energy contributions originating from bonds, angles, dihedrals, impropers, and cohesive (or pair) interactions within the bulk systems of pristine P3HT and P3HT/graphene nanocomposites at various graphene contents during tensile deformation at T = 300 K. Fig. 6 shows the energy contributions at the ultimate tensile stage, elucidating that cohesive energy exerts the most significant influence on the tensile deformation of nearly all nanocomposites. This analysis underscores the predominant role played by cohesive (pair) interactions in the tensile deformation of the polymer nanocomposites, overshadowing the impact of bonded interactions such as bonds, angles, dihedrals, and impropers. Moreover, it is noteworthy that the cohesive (pair) energy exerts a greater influence on the tension experienced by the P3HT/graphene nanocomposite system with a higher graphene loading, attributable to the heightened likelihood of sliding between the P3HT polymer chain and graphene during tensile deformation (inset of Fig. 6).
Furthermore, Fig. 5d shows the plots of Young's modulus and Tg for pristine P3AT systems with different side chain lengths. The elastic modulus shows an obvious reduction with increasing side chain length, which is attributed to the nature of CPs that the side chain is more flexible than the backbone. Our temperature-dependent CG potential modified by the ER approach faithfully captures the architecture-related mechanical response of P3ATs. In the previous work by Lipomi et al.,17 they observed mechanical response trends of P3ATs with different side chain lengths that were in contradiction with the experimental results using original parameters from the three-site model for P3HT, indicating that the P3HT model with the constant LJ potential was not transferable switching to different chemical structures. Additionally, Tg follows the same trend as that of the mechanical response (Fig. 5c and d), revealing that the system is stronger with a higher Tg. Additionally, P3ATs with longer side chain lengths, i.e., P3NT and P3DDT, also exhibit a similar downward trend of E with increasing temperature (Fig. S14a and b†). It is also noted that increasing side chain length causes a softer mechanical response at certain temperatures although P3DDT exhibits a tiny decrease of E as compared to P3NT (Fig. S14c†), which is validated by previous work16 showing that E reaches a plateau when the alkyl side chain length is beyond eight.
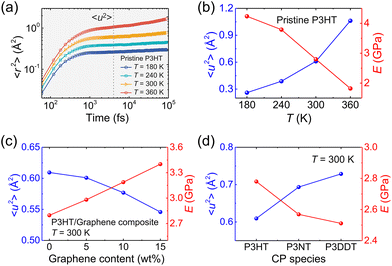
To have a deep understanding of the influence of temperature, side chain length, and graphene content on the mechanical response of P3AT/graphene nanocomposites, we next evaluated the Debye–Waller factor 〈u2〉, a fast-dynamics property at a picosecond time scale that is closely related to the local free volume and therefore inversely related to molecular stiffness, i.e., 1/〈u2〉.78Fig. 7a shows the segmental 〈r2(t)〉 as a function of time for the pristine CG P3HT model using the T-dependent cohesive interaction factor α(T) at different T values, and 〈u2〉 is determined as the 〈r2(t)〉 value at t = 4 ps, a “caging” time scale from previous works.28,32 As expected, elevating the temperature significantly increases the 〈r2(t)〉 of the system due to enhanced segmental mobility. Additionally, we obtained the 〈r2(t)〉 curves for simulation systems with different graphene contents and side chain length under different temperatures (Fig. S15–S17†). Fig. 7b–d summarizes the results of the Debye–Waller factor 〈u2〉 (left-axis) and tensile modulus (right-axis), which reveals an obvious inverse relationship between dynamics and mechanical properties. Elevating the temperature and extending the side chain length enhance the segmental mobility and thus reduce the tensile mechanical response (Fig. 7b and d), which is consistent with the pristine polycarbonate system.79 Additionally, more graphene addition causes a smaller 〈u2〉 value of the system due to the slow dynamics of the graphene sheet compared with the polymer and yields a stronger mechanical response (Fig. 7c). Notably, the opposite trend between E and 〈u2〉 is observed for the P3AT/graphene nanocomposites at different temperatures, with different graphene contents and side chain lengths.
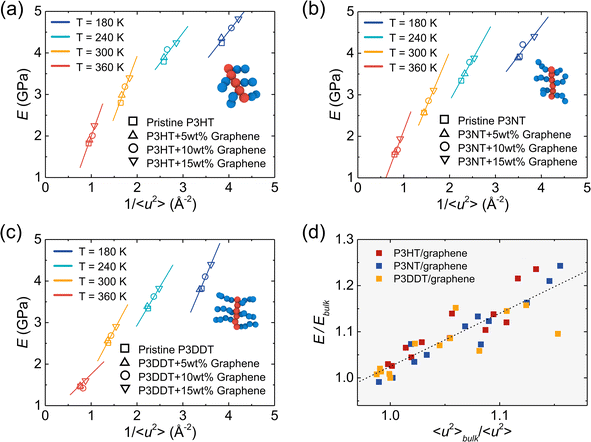
As mentioned above, 1/〈u2〉 can be alternatively perceived as a measure of local molecular stiffness, and previous studies have revealed a correlation between 1/〈u2〉 and shear modulus G, i.e., G ≈ A + B/〈u2〉, where A and B are fitting parameters. Specifically, the linear glassy polymers,21 nano cellulose network,47 and cross-linked glass-forming thermoset material80 present a clear linear scaling relationship between G and 1/〈u2〉, while the graphene foam56 and P3HT28 exhibit an apparent power-law relationship due to the high porosity and heterogeneity in the molecular structure, respectively. Fig. 8a–c show tensile modulus vs. molecular stiffness 1/〈u2〉 of the P3HT, P3NT, and P3DDT CG models at different temperatures and graphene contents. As the graphene content increases and temperature decreases, both tensile modulus and molecular stiffness 1/〈u2〉 increase correspondingly, with an evident linear relationship (solid line in Fig. 8a–c).
Additionally, tensile modulus E increases with molecular stiffness 1/〈u2〉 in an apparent power-law scaling relationship for each P3AT/graphene nanocomposite at a certain temperature, which is consistent with our previous study on the pristine P3HT system.28 The previous study showed that the polymer dynamics is affected almost until distances of around 2–3 nm from the graphene surface.53,81 Particularly, polymers behave like in a bulk system and do not feel the presence of the graphene sheet when the polymer is located 2 nm away from the graphene surface. And polymers near the graphene surface show suppressed dynamics or a high stiffness.53 Therefore, we normalized the molecular stiffness 1/〈u2〉 of the P3AT/graphene nanocomposites with the relative 1/〈u2〉bulk of pristine P3AT bulk systems at the same temperature and under the same treatment for the tensile modulus. Fig. 8d shows the data of 〈u2〉bulk/〈u2〉 versus E/Ebulk, where a roughly linear master curve is held for all P3AT/graphene nanocomposites under various temperatures and graphene contents, indicating the positive (or negative) relation between molecular stiffness (or dynamic) and mechanical response.
3.3. Dynamical heterogeneity
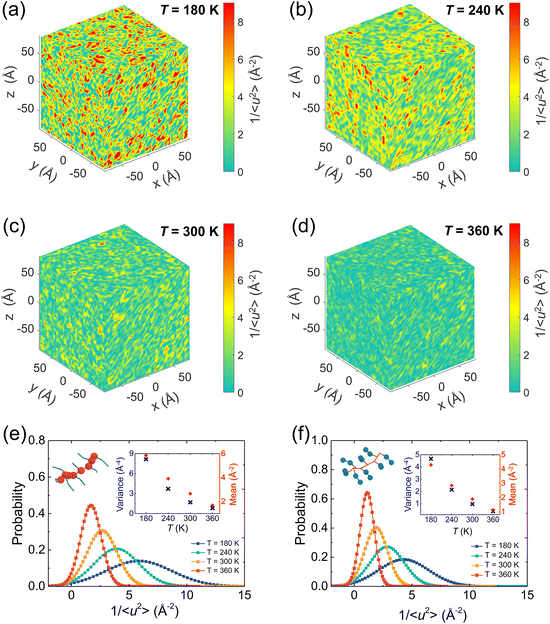
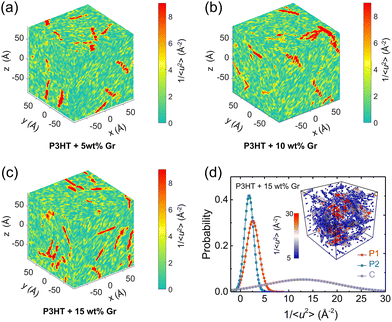
It has been broadly observed that when a polymer melt is cooled close to or even lower than its Tg, a pronounced fluctuation of local dynamics would occur, resulting in dynamic heterogeneity of the system, namely, excessively high and low mobility regions coexist. To gain clear visualization of the effect of the temperature on the local stiffness of the model, we take a pristine P3HT CG model as an example and plot three-dimensional (3D) color maps of the local molecular stiffness 1/〈u2〉 of each CG bead (P1 and P2) in Fig. 9a–d, where red domains indicate the regions of particles with relatively high stiffness and thus slower mobility, while green domains indicate regions with lower stiffness. As expected, more significant dynamical heterogeneity is observed under lower temperature conditions, corresponding to the larger variance 1/〈u2〉 value and strengthened mechanical response of the system as we discussed in Fig. 8. More precisely, we quantified the origin of the contributions of the system's dynamic heterogeneity by separately extracting the 1/〈u2〉 distribution of backbone bead P1 (Fig. 9e) and side chain bead P2 (Fig. 9f) at different temperatures. The results show that as the temperature decreases, the peak value of the probability distribution becomes smaller and shifts toward a higher mean 1/〈u2〉 for both P1 and P2 beads. In addition, probability distributions of 1/〈u2〉 for P1 and P2 become broader with decreasing temperature, in which a significant increase in the variance of the probability distribution is observed (insets of Fig. 9e and f), demonstrating a greater degree of dynamic heterogeneity. Notably, under each certain temperature, backbone P1 beads present higher mean and variance values of 1/〈u2〉 than the side chain P2 beads (insets of Fig. 9e and f), revealing the structural heterogeneity of CPs consisting of a relatively rigid backbone and a flexible side chain.We next explored the effect of graphene on the molecular local stiffness at 300 K by evaluating the 3D distribution of 1/〈u2〉 for each CG bead in the P3HT/graphene nanocomposites with different graphene contents. In the isolated red region shown in Fig. 10, the dynamical heterogeneity of the system is more pronounced with the increase of graphene content, contributing to the stronger mechanical response of the system due to the more rigid graphene compared to P3HT. Previous studies revealed that the stronger interaction between the polymer and the nanofiller induces the densification of monomers associated with lower mobility at the interface.81,82 Thus, more graphene addition would cause more low-mobility polymer regions with large stiffness, further strengthening the mechanical properties of the nanocomposites. Concretely, Fig. 10d shows the probability distribution of 1/〈u2〉 for P1, P2, and C beads for the P3HT/graphene system with 15 wt% graphene content at 300 K. It is clear that graphene shows the largest mean and variance value of 1/〈u2〉, and then the P1 and P2 beads, making the system more divergent in dynamical homogeneity with increasing graphene content. The typical snapshot of 1/〈u2〉 for each CG bead of the P3HT/graphene system with 15 wt% graphene content in the inset of Fig. 10b further demonstrated that the highest local molecular stiffness 1/〈u2〉 is mostly concentrated on the graphene sheet (i.e., the clusters in darker color indicate higher values of 1/〈u2〉). As for the pristine P3AT systems at certain temperatures, the dynamical heterogeneity with a longer side chain length is slightly stronger than P3HT, as shown in Fig. S18.†
3.4. Strain-induced chain conformation
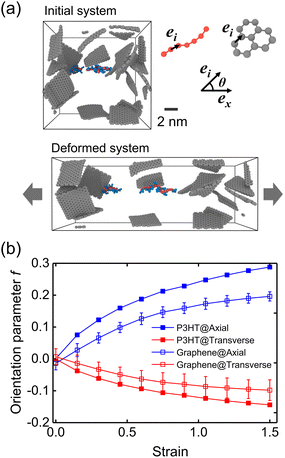
We next evaluated the strain-induced chain conformation of the P3AT/graphene nanocomposites. It is widely observed that exerting a uniaxial strain on an amorphous or semicrystalline polymer system yields the chain segments to plastically deform and align along the axial direction. Experimentally, the UV-vis absorption spectroscopy method has been widely applied to study the orientation of conjugated polymer chains due to peaks.83,84 The highly aligned nano fibrillar structure of the P3HT nanofiber shows an optimal value of the charge carrier mobilities along the chain's well-aligned direction.85 Here, the molecular orientation behavior for the CG P3HT/graphene nanocomposite (5 wt% graphene content) under 300 K with varying strains is presented. The orientation parameters f of P3HT and graphene are defined as the bond vectors between two consecutive backbone P1 beads and the nearest C beads, respectively (Fig. 11a). Note that f = 1 and −0.5 indicate all bond vectors are perfectly aligned and perpendicular to the stretching direction. Fig. 11a shows the representative simulation snapshots of the uniaxial tension deformation. The evolution of axial and transverse components of f is shown in Fig. 11b, where both the P3HT backbone and graphene show increasing alignment of chains with increasing strain along the stretching direction while a decreasing trend along the transverse direction. Additionally, graphene presents a lower degree of alignment due to its planar architecture and high stiffness attribute. The strain-induced chain alignment behavior along the deformation direction under the effect of temperature, graphene content, and side chain length is summarized in Fig. S19,† indicating that the chain orientation is insensitive to temperature and graphene content. However, the longer side chain of the P3AT system causes a higher tendency of chain alignment along the deformation direction (Fig. S19c†), which can be attributed to the stronger segment dynamics of the P3DDT system with a longer side chain from the above explanation.4. Conclusion
In this study, we proposed a novel multiscale CG modeling framework to study the thermomechanical, dynamic, and conformational properties of P3AT/graphene nanocomposites at a fundamental molecular scale. Specifically, we performed uniaxial tension deformation of P3ATs and its graphene-reinforced P3AT/graphene nanocomposites under the effect of temperature, graphene content, and side chain length by utilizing the temperature-transferable CG P3AT model and the mechanically consistent graphene CG model. The results revealed that more graphene addition and shorter side chain length of P3AT cause a higher density and Tg of the composite system. And high graphene loading yields a poor dispersion state of the nanocomposites. Additionally, a strong correlation between the dynamics and mechanical response of the system is detected, i.e., strong dynamics corresponding to a weaker mechanical response. Lower temperature and higher graphene content exhibit a higher degree of dynamical heterogeneity compared to the effect of the side chain lengths of P3AT by evaluating the distribution of local molecular stiffness via the inversed Debye–Waller factor 1/〈u2〉. Specifically, graphene shows the highest molecular stiffness in the system, and then the backbone and side chain of P3AT, revealing the strengthened mechanism of graphene-reinforced polymer composites. The conformation study of P3AT/graphene nanocomposites reveals that P3AT shows a higher degree of alignment along the deformation direction than graphene due to the difference in architecture and stiffness. Our findings are fundamentally important for understanding the thermomechanical properties of P3AT/graphene nanocomposites under the effects of temperature, graphene content, and chemical composition of P3AT, where the strengthening effect of P3AT/graphene nanocomposites is highly correlated with the high local stiffness of the system. This multiscale strategy and analysis approach can be readily converted to other nano-filler-reinforced nanocomposite models for exploring the thermomechanical properties at the fundamental molecular level.Author contributions
Yang Wang: conceptualization, writing – original draft, software, analysis, methodology, and investigation; Zhaofan Li: software and analysis; Naisheng Jiang: resources and review & editing; Kangmin Niu: supervision, resources, and review; Andrea Giuntoli: conceptualization, supervision, resources, and writing, editing & review; Wenjie Xia: conceptualization, supervision, resources, and review.Conflicts of interest
The authors declare that they have no known competing financial interests or personal relationships that could have appeared to influence the work reported in this paper.Acknowledgements
The authors acknowledge the financial support from the China Scholarship Council under Grant No. 202106460027 (Y. Wang) and the University of Science & Technology Beijing (N. Jiang, K. Niu). Y. W. and A. G. thank the Center for Information Technology of the University of Groningen for their support and for providing access to the Hábrók high-performance computing cluster. Z. Li and W. Xia acknowledge the support from the National Science Foundation (NSF) under NSF CMMI Award No. 2331017 and the Department of Aerospace Engineering at Iowa State University.References
- M. Planells, A. Abate, H. J. Snaith and N. Robertson, ACS Appl. Mater. Interfaces, 2014, 6, 17226–17235 CrossRef CAS PubMed.
- M. Kaltenbrunner, M. S. White, E. D. Glowacki, T. Sekitani, T. Someya, N. S. Sariciftci and S. Bauer, Nat. Commun., 2012, 3, 770 CrossRef PubMed.
- R. D. McCullough, Adv. Mater., 1998, 10, 93–116 CrossRef CAS.
- I. Perepichka, D. Perepichka, H. Meng and F. Wudl, Adv. Mater., 2005, 17, 2281–2305 CrossRef CAS.
- J. Koo, V. Amoli, S. Y. Kim, C. Lee, J. Kim, S.-M. Park, J. Kim, J. M. Ahn, K. J. Jung and D. H. Kim, Nano Energy, 2020, 78, 105199 CrossRef CAS.
- M. T. Dang, L. Hirsch and G. Wantz, Adv. Mater., 2011, 23, 3597–3602 CrossRef CAS PubMed.
- J. W. Jung, J. S. Park, I. K. Han, Y. Lee, C. Park, W. Kwon and M. Park, J. Mater. Chem. A, 2017, 5, 12158–12167 RSC.
- B. Friedel, C. R. McNeill and N. C. Greenham, Chem. Mater., 2010, 22, 3389–3398 CrossRef CAS.
- R. Po, A. Bernardi, A. Calabrese, C. Calabrese, G. Corsoa and P. Andrea, Energy Environ. Sci., 2014, 7, 925–943 RSC.
- C.-J. Lin, C.-L. Liu and W.-C. Chen, J. Mater. Chem. C, 2015, 3, 4290–4296 RSC.
- C. Shen, S. Chai, S. Zou and L. Zhai, Polymer, 2018, 144, 168–178 CrossRef CAS.
- Y. Liu, W. Hao, H. Yao, S. Li, Y. Wu, J. Zhu and L. Jiang, Adv. Mater., 2018, 30, 1705377 CrossRef PubMed.
- A. Yadav, A. Upadhyaya, S. K. Gupta, A. S. Verma and C. M. S. Negi, Thin Solid Films, 2019, 675, 128–135 CrossRef CAS.
- D. Yu, Y. Yang, M. Durstock, J. B. Baek and L. Dai, ACS Nano, 2010, 4, 5633–5640 CrossRef CAS PubMed.
- K. Jiang, L. Wang, X. Zhang, Z. Ma, Y. Song and W. Zhang, Macromolecules, 2020, 53, 10061–10068 CrossRef CAS.
- S. Savagatrup, A. S. Makaram, D. J. Burke and D. J. Lipomi, Adv. Funct. Mater., 2014, 24, 1169–1181 CrossRef CAS.
- S. E. Root, S. Savagatrup, C. J. Pais, G. Arya and D. J. Lipomi, Macromolecules, 2016, 49, 2886–2894 CrossRef CAS.
- S. Das, D. Pandey, J. Thomas and T. Roy, Adv. Mater., 2019, 31, 1802722 CrossRef PubMed.
- S. K. Behura, C. Wang, Y. Wen and V. Berry, Nat. Photonics, 2019, 13, 312–318 CrossRef CAS.
- Q. Zhang, B. Mortazavi, X. Zhuang and F. Aldakheel, Compos. Struct., 2022, 281, 115004 CrossRef CAS.
- W. Xia, J. Song, C. Jeong, D. D. Hsu, F. R. Phelan Jr., J. F. Douglas and S. Keten, Macromolecules, 2017, 50, 8787–8796 CrossRef CAS PubMed.
- D. D. Hsu, W. Xia, S. G. Arturo and S. Keten, Macromolecules, 2015, 48, 3057–3068 CrossRef CAS.
- T. W. Rosch, J. K. Brennan, S. Izvekov and J. W. Andzelm, Phys. Rev. E: Stat., Nonlinear, Soft Matter Phys., 2013, 87, 042606 CrossRef PubMed.
- S. Chattaraj and S. Basu, J. Mater. Res., 2021, 37, 1–12 CrossRef.
- D. M. Huang, R. Faller, K. Do and A. J. Moulé, J. Chem. Theory Comput., 2010, 6, 526–537 CrossRef CAS PubMed.
- M. Jones, D. Huang, B. Chakrabarti and C. Groves, J. Phys. Chem. C, 2016, 120, 4240–4250 CrossRef CAS.
- C.-K. Lee, C.-W. Pao and C.-W. Chu, Energy Environ. Sci., 2011, 4, 4124–4132 RSC.
- Y. Wang, Z. Li, K. Niu and W. Xia, Polymer, 2022, 256, 125159 CrossRef CAS.
- G. Adam and J. H. Gibbs, J. Chem. Phys., 1965, 43, 139–146 CrossRef CAS.
- J. Dudowicz, K. F. Freed and J. F. Douglas, Adv. Chem. Phys., 2008, 137, 125–222 CrossRef CAS.
- J. Dudowicz, K. F. Freed and J. F. Douglas, J. Phys. Chem. B, 2005, 109, 21350–21356 CrossRef CAS PubMed.
- W. Xia, N. K. Hansoge, W. S. Xu, J. Phelan, F. R., S. Keten and J. F. Douglas, Sci. Adv., 2019, 5, eaav4683 CrossRef CAS PubMed.
- S. L. Mayo, B. D. Olafson and W. A. Goddard, J. Phys. Chem., 1990, 94, 8897–8909 CrossRef CAS.
- J. Gasteiger and M. Marsili, Tetrahedron, 1980, 36, 3219–3228 CrossRef CAS.
- O. Alexiadis and V. G. Mavrantzas, Macromolecules, 2013, 46, 2450–2467 CrossRef CAS.
- Z. Cao, S. A. Tolba, Z. Li, G. T. Mason, Y. Wang, C. Do, S. Rondeau-Gagné, W. Xia and X. Gu, Adv. Mater., 2023, 2302178 CrossRef CAS PubMed.
- M. C. Payne, M. P. Teter, D. C. Allan, T. A. Arias and J. D. Joannopoulos, Rev. Mod. Phys., 1992, 64, 1045–1097 CrossRef CAS.
- D. Reith, M. Pütz and F. Müller-Plathe, J. Comput. Chem., 2003, 24, 1624–1636 CrossRef CAS PubMed.
- F. Müller-Plathe, ChemPhysChem, 2002, 3, 755–769 CrossRef.
- G. G. Rondina, M. C. Bohm and F. Muller-Plathe, J. Chem. Theory Comput., 2020, 16, 1431–1447 CrossRef CAS PubMed.
- D. Fritz, K. Koschke, V. A. Harmandaris, N. F. van der Vegt and K. Kremer, Phys. Chem. Chem. Phys., 2011, 13, 10412–10420 RSC.
- W.-S. Xu and K. F. Freed, Macromolecules, 2014, 47, 6990–6997 CrossRef CAS.
- W.-S. Xu, J. F. Douglas and K. F. Freed, Macromolecules, 2016, 49, 8341–8354 CrossRef CAS.
- W.-S. Xu, J. F. Douglas and K. F. Freed, Macromolecules, 2016, 49, 8355–8370 CrossRef CAS.
- W.-S. Xu, J. F. Douglas and X. Xu, Macromolecules, 2020, 53, 9678–9697 CrossRef CAS.
- W.-S. Xu, J. F. Douglas, W. Xia and X. Xu, Macromolecules, 2020, 53, 7239–7252 CrossRef CAS.
- Z. F. Li and W. J. Xia, Extreme Mech. Lett., 2020, 40, 100942 CrossRef.
- Y. Wang, W. Nie, L. Wang, D. Zhang, K. Niu and W. Xia, Comput. Mater. Sci., 2023, 222, 112109 CrossRef CAS.
- J. Tersoff, Phys. Rev. Lett., 1988, 61, 2879–2882 CrossRef CAS PubMed.
- Y. Wang, K. Niu and Y. Wu, Compos. Struct., 2021, 276, 114416 CrossRef CAS.
- C. Lee, X. Wei, J. W. Kysar and J. Hone, Science, 2008, 321, 385–388 CrossRef CAS PubMed.
- L. Ruiz, W. Xia, Z. Meng and S. Keten, Carbon, 2015, 82, 103–115 CrossRef CAS.
- A. N. Rissanou and V. Harmandaris, Soft Matter, 2014, 10, 2876–2888 RSC.
- L. Yuan, X. Yao and H. Yang, Nanoscale, 2019, 11, 21554–21568 RSC.
- T. Shao, B. Wen, R. Melnik, S. Yao, Y. Kawazoe and Y. Tian, J. Chem. Phys., 2012, 137, 194901 CrossRef PubMed.
- W. Xia, F. Vargas-Lara, S. Keten and J. F. Douglas, ACS Nano, 2018, 12, 5427–5435 CrossRef CAS PubMed.
- Z. Li, Y. Liao, Y. Zhang, Y. Zhang and W. Xia, Extreme Mech. Lett., 2022, 50, 101519 CrossRef.
- S. Plimpton, J. Comput. Phys., 1995, 117, 1–19 CrossRef CAS.
- N. Michaud-Agrawal, E. J. Denning, T. B. Woolf and O. Beckstein, J. Comput. Chem., 2011, 32, 2319–2327 CrossRef CAS PubMed.
- A. Stukowski, Modell. Simul. Mater. Sci. Eng., 2010, 18, 015012 CrossRef.
- R. E. Roman, K. Kwan and S. W. Cranford, Nano Lett., 2015, 15, 1585–1590 CrossRef CAS PubMed.
- R. Weiss, J. DeMarco, G. Weremchuk, L. Corliss and J. Hastings, Acta Crystallogr., 1956, 9, 42–44 CrossRef CAS.
- M. Bellissent-Funel, A. Filabozzi and S. Chen, Biophys. J., 1997, 72, 1792–1799 CrossRef CAS PubMed.
- M. S. Lavine, N. Waheed and G. C. Rutledge, Polymer, 2003, 44, 1771–1779 CrossRef CAS.
- J. Mei and Z. Bao, Chem. Mater., 2013, 26, 604–615 CrossRef.
- D. L. Meyer, N. Schmidt-Meinzer, C. Matt, S. Rein, F. Lombeck, M. Sommer and T. Biskup, J. Phys. Chem. C, 2019, 123, 20071–20083 CrossRef CAS.
- S. Zhang, A. Alesadi, M. Selivanova, Z. Cao, Z. Qian, S. Luo, L. Galuska, C. Teh, M. U. Ocheje, G. T. Mason, P. B. J. St. Onge, D. Zhou, S. Rondeau-Gagné, W. Xia and X. Gu, Adv. Funct. Mater., 2020, 30, 2002221 CrossRef CAS.
- C. Müller, Chem. Mater., 2015, 27, 2740–2754 CrossRef.
- D. McKechnie, J. Cree, D. Wadkin-Snaith and K. Johnston, Polymer, 2020, 195, 122433 CrossRef CAS.
- Y. Kim, Y. J. Kwon, S. Ryu, C. J. Lee and J. U. Lee, Polymers, 2020, 12, 1046 CrossRef CAS PubMed.
- X. Fan, Q. Gao, Y. Gao, G. Zhang, F. Huang, R. Xiao, W. Liu, F. Wang, J. Qin, E. Bilotti, H. Zhang, X. Shi and G. Zhang, Compos. Sci. Technol., 2021, 215, 109000 CrossRef CAS.
- J. Cha, W. Kyoung, K. Song, S. Park, T. Lim, J. Lee and H. Kang, Nanoscale Res. Lett., 2016, 11, 136 CrossRef PubMed.
- J. L. Suter, R. C. Sinclair and P. V. Coveney, Adv. Mater., 2020, 32, 2003213 CrossRef CAS PubMed.
- J. C. H. Affdl and J. L. Kardos, Polym. Eng. Sci., 1976, 16, 344–352 CrossRef.
- A. Navidfar and L. Trabzon, Composites, Part B, 2019, 176, 107337 CrossRef CAS.
- S. Alwekar, P. Yeole, V. Kumar, A. A. Hassen, V. Kunc and U. K. Vaidya, Composites, Part A, 2021, 144, 106349 CrossRef CAS.
- Z. Shen, H. Ye, C. Zhou, M. Kröger and Y. Li, Nanotechnology, 2018, 29, 104001 CrossRef PubMed.
- B. A. Pazmiño Betancourt, P. Z. Hanakata, F. W. Starr and J. F. Douglas, Proc. Natl. Acad. Sci. U. S. A., 2015, 112, 2966–2971 CrossRef PubMed.
- A. Alesadi and W. Xia, Macromolecules, 2020, 53, 2754–2763 CrossRef CAS.
- X. Zheng, Y. Guo, J. F. Douglas and W. Xia, Macromolecules, 2022, 55, 9990–10004 CrossRef CAS.
- P. Bačová, A. N. Rissanou and V. Harmandaris, Macromolecules, 2015, 48, 9024–9038 CrossRef.
- Y. Zhu, A. Giuntoli, W. Zhang, Z. Lin, S. Keten, F. W. Starr and J. F. Douglas, J. Chem. Phys., 2022, 157, 094901 CrossRef CAS PubMed.
- S. Zhang, A. Alesadi, G. T. Mason, K.-L. Chen, G. Freychet, L. Galuska, Y.-H. Cheng, P. B. J. St. Onge, M. U. Ocheje and G. Ma, et al. , Adv. Funct. Mater., 2021, 31, 2100161 CrossRef CAS.
- B. O'Connor, R. J. Kline, B. R. Conrad, L. J. Richter, D. Gundlach, M. F. Toney and D. M. DeLongchamp, Adv. Funct. Mater., 2011, 21, 3697–3705 CrossRef.
- P.-H. Chu, N. Kleinhenz, N. Persson, M. McBride, J. L. Hernandez, B. Fu, G. Zhang and E. Reichmanis, Chem. Mater., 2016, 28, 9099–9109 CrossRef CAS.
- Z. Li, Y. Wang, A. Alesadi, L. A. R. Pestana and W. Xia, Particle-based mesoscale modeling and coarse-graining methods, Fundamentals of Multiscale Modeling of Structural Materials, 2023, pp. 75–111 Search PubMed.
Footnote |
| † Electronic supplementary information (ESI) available. See DOI: https://doi.org/10.1039/d3nr03618a |
| This journal is © The Royal Society of Chemistry 2023 |

