
Post-functionalization of sulfur quantum dots and their aggregation-dependent antibacterial activity†
Avijit
Mondal
 a,
Subrata
Pandit
a,
Jagabandhu
Sahoo
a,
Yogeswari
Subramaniam
b and
Mrinmoy
De
*a
a,
Subrata
Pandit
a,
Jagabandhu
Sahoo
a,
Yogeswari
Subramaniam
b and
Mrinmoy
De
*a
aDepartment of Organic Chemistry, Indian Institute of Science, Bangalore 560012, India. E-mail: md@iisc.ac.in
bDepartment of Biochemistry, Indian Institute of Science, Bangalore 560012, India
First published on 31st October 2023
Abstract
Sulfur quantum dots (SQDs) have emerged as an intriguing class of luminescent nanomaterial due to their exceptional physiochemical and optoelectronic properties. However, their biomedical application is still in its infancy due to the limited scope of their surface functionalization. Herein, we explored the surface functionalization of SQDs through different thiol ligands with tuneable functionality and tested their antibacterial efficacy. Notably, very high antibacterial activity of functionalized SQDs (10–25 ng ml−1) was noted, which is 105 times higher compared to that of nonfunctionalized SQDs. Moreover, a rare phenomenon of the reverse trend of antibacterial activity through surface modification was observed, with increasing surface hydrophobicity of various nanomaterials as the antibacterial activity increased. However, we also noted that as the surface hydrophobicity increased, the SQDs tended to exhibit a propensity for aggregation, which consequently decreased their antibacterial efficacy. This identical pattern was also evident in in vivo assessments. Overall, this study illuminates the importance of surface modifications of SQDs and the role of surface hydrophobicity in the development of antibacterial agents.
Introduction
Quantum dots (QDs) are prevalent due to their versatile distinctive physiochemical properties that are harnessed in a wide variety of applications, ranging from device fabrication to biomedical research.1–6 Thus far, most of the reported semiconducting QDs contain cadmium, lead, or other toxic heavy metal elements, which significantly limits their use in biological and environmental systems.7–9 Over the past decade, intensive research has been performed to study metal-free QDs such as carbon QDs (CQDs) and silicon QDs (SiQDs) because of their biocompatibility and chemical inertness.10–18 However, for effective biological applications, control and specific interactions with the biosystem are required.19–22 This can be accomplished through surface functionalization with synthetic ligands to which is attached a desirable functional group.There are two methods for incorporating desirable functionality on the surface of non-metallic QDs.23 The first method involves solvothermal treatment of suitable precursors. However, harsh reaction conditions must be used, and there is limited control over the desired functionality to be incorporated.24–26 The second method involves surface chemical modifications and multistep chemical synthesis.27–30 Because of these suboptimal conditions, there is a need to design and develop a facile approach to modify the surface of non-metallic QDs. In this regard, there has been great interest in thiol molecule-based surface functionalization of gold and other nanomaterials because the ability to fine-tune the surface functionality and the occurrence of specific interactions with biomolecules would be gained.31–38 Similarly, thiol molecule-based surface modification of non-metallic QDs has the potential to open a new avenue for biomedical research.
Sulfur quantum dots (SQDs), a new class of metal-free QDs, have been used in numerous applications in the field of sensing, cell imaging, photocatalysis, light emitting diodes, and polymer nanocomposites due to their unique composition, favourable optical properties, low toxicity, excellent processability, and low preparation cost.39–45 For SQDs to become a suitable candidate for biomedical research, adequate surface modification is essential. Herein, we developed a simple procedure for thiol ligand-based surface functionalization of SQDs, with possible direct dithiol bond formation. To the best of our knowledge, this is the first attempt to establish post-synthetic surface functionalization of SQDs.
In this work, we engineered the preparation of SQDs through a hydrothermal method using sublimed sulfur and p-phenylenediamine as the precursor and tetraethylene glycol as the stabilizer. The as-prepared SQDs were purified through column chromatography, and then exhibited precise photophysical properties and low polydispersity. To achieve post-synthetic surface modification of SQDs by thiol ligands, surface functionalization was performed using ligands synthesized with different head groups possessing different charges (–+N(CH3)3, –OH, –COOH) (Scheme 1a). The functionalized SQDs were characterized through various techniques that established effective surface functionalization.
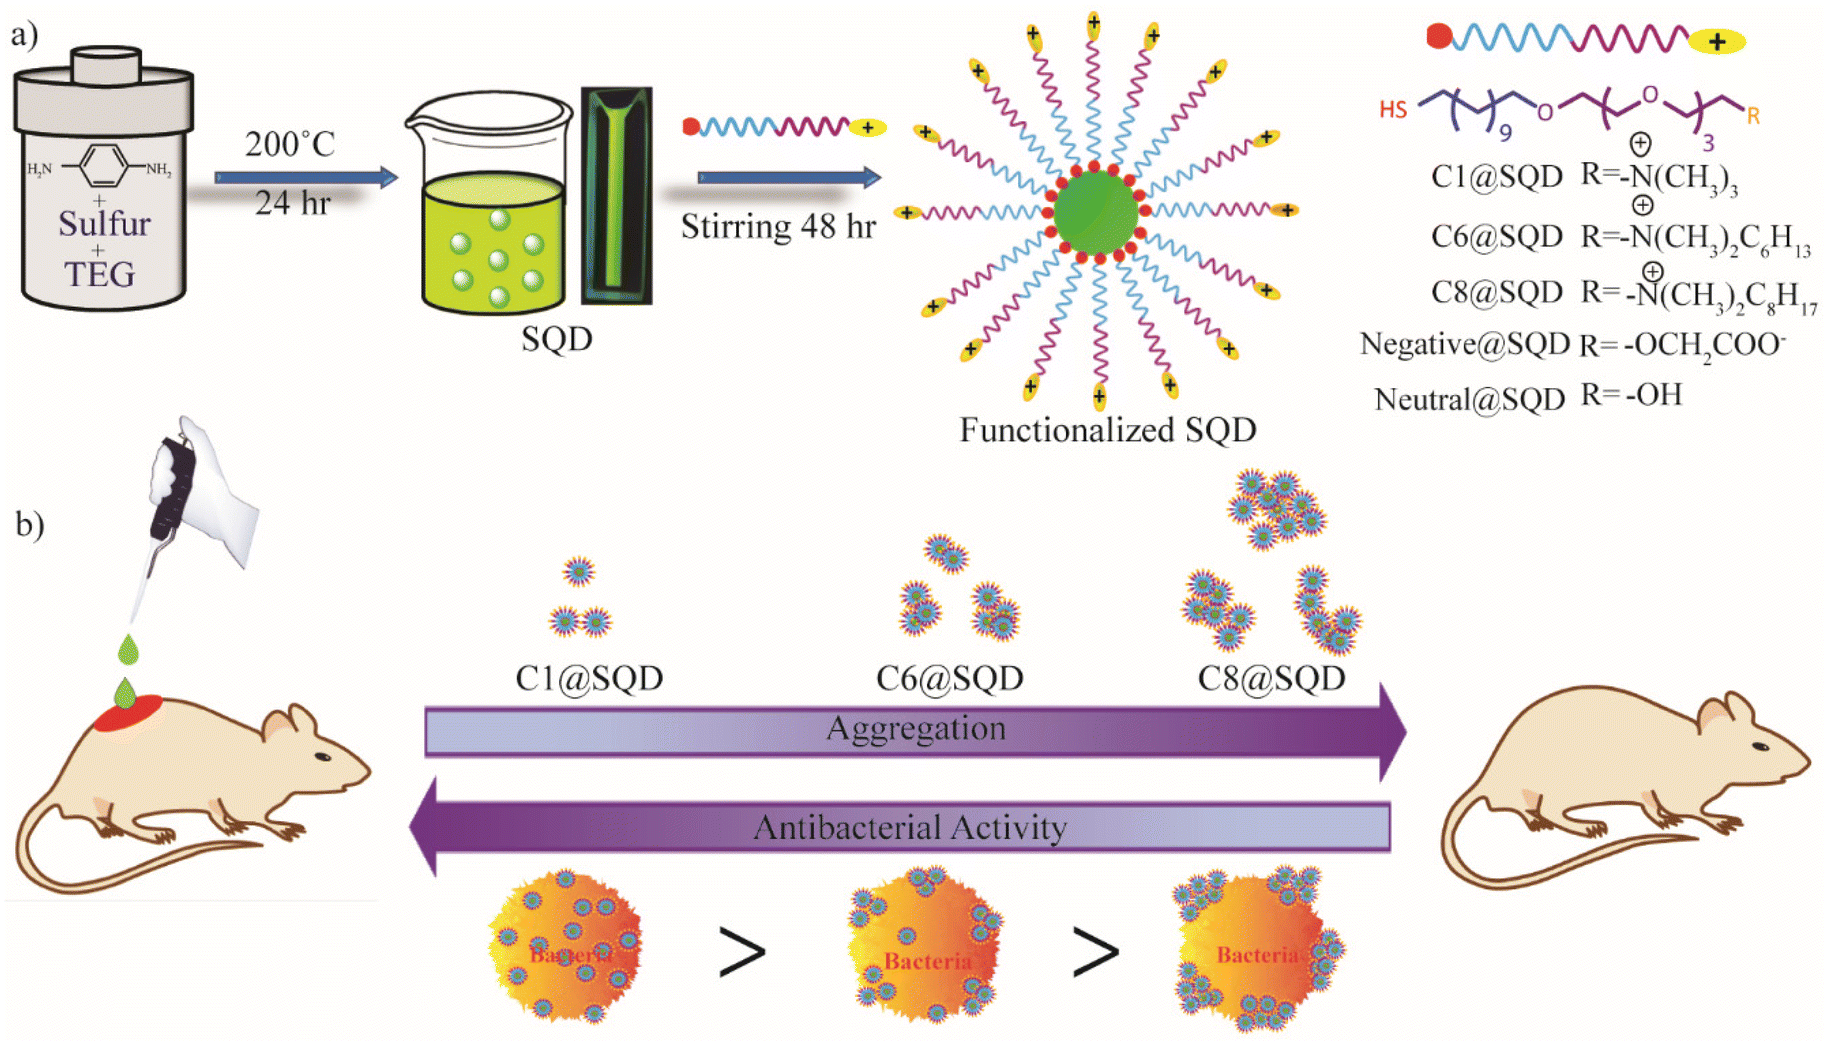 | ||
| Scheme 1 (a) Synthesis and functionalization of SQDs. (b) The effect of surface hydrophobicity of functionalized SQDs on the antibacterial activity and their potency in a wound healing application. | ||
Because a well-equipped toolbox is available to chemists to provide functional diversity through synthesis, the establishment of thiol functionalization is a factor that would contribute to SQDs becoming a promising candidate for numerous applications. Out of the various applications, the development of antimicrobial agents based on SQDs is still in its infancy.46 The reason behind the continuous need to design and develop a new generation of antibacterial agents is the excessive use and misuse of conventional antibiotics that led to the emergence of several drug-resistant bacterial strains.47–49 The mode of antibacterial actions of SQDs or other nanomaterials is novel to bacteria, and thus, they would not be able to respond using their natural defense system. The inhibitory action of QD-based nanomaterials against bacteria mainly takes place through the generation of reactive oxygen species (ROS), which can disrupt the cell membrane integrity and damage important internal cellular components.50–52
In this regard, Wang et al. first developed SQDs for the treatment of bacterial infection, using a minimum inhibitory concentration (MIC) value of 1.2 mg mL−1.46 It was reported that there is less toxicity of these SQDs up to 2× MIC, and they exhibited inhibitory activity at a very high concentration compared to conventional nanomaterial-based antibiotics, whose antibacterial activity is within 1–10 μg mL−1.53–55 Because there is a negative charge on the surface of bacteria, there is a high affinity for positively charged nanomaterials to adhere to bacterial membranes through electrostatic interaction.56–60 Therefore, we proceeded to examine the antibacterial efficacy of functionalized SQDs against Gram-positive and Gram-negative bacteria. As expected, there was no antibacterial activity by neutral (–OH) or negatively charged (–COOH) thiol ligand-conjugated SQDs up to a concentration of 5 μg mL−1. There was high antibacterial activity by positively charged ligand-conjugated SQDs (–+N(CH3)3) against Gram-positive bacteria (methicillin-resistant Staphylococcus aureus (MRSA) and Enterococcus faecalis) at very low concentrations, in the range of 10–25 ng mL−1. However, we did not observe any notable antibacterial activity against Gram-negative bacteria (Pseudomonas aeruginosa (PA) and Escherichia coli) with up to 5 μg mL−1 of SQDs. Because the cell wall of Gram-negative bacteria contains an outer lipopolysaccharide layer over the peptidoglycan layers, positively charged ligand-functionalized SQDs are unable to penetrate the cell wall of these bacteria.61 It has been reported that when the hydrophobicity on the nanomaterial surface increases, its antibacterial efficacy increases.54
Hence, to further increase the antibacterial efficacy of SQDs so that they are effective against Gram-negative bacteria, positively charged thiol ligands with different hydrophobic head groups were synthesized (–+N(CH3)2n-C6H13 and –+N(CH3)2n-C8H17) and functionalized. To our surprise, we observed that not only are the positively charged SQDs containing n-hexyl and n-octyl head groups ineffective against Gram-negative bacteria, but they also exhibited less activity towards Gram-positive bacteria compared to the methyl head group. This reverse trend of antibacterial activity is unique from the nanomaterial surface functionalization point of view (Scheme 1b). A careful mechanistic investigation led to the conclusion that the nanomaterial state after hydrophobic ligand conjugation is responsible for the reverse trend in antibacterial activity.
Jiang et al. recently showed that the antimicrobial potency of smaller silica nanoparticles is higher compared to larger nanoparticles.62 Hayden et al. reported that there is a tendency for hydrophobic ligand-functionalized cationic gold nanoparticles to aggregate on the bacterial surface.63 Through a theoretical calculation, Linklater et al. showed that greater stretching of a bacterial membrane occurs when gold nanoparticles are spatially distributed, as compared to when they are in an aggregated form.64 These reports indicate that not only the nanomaterial surface charge and hydrophobicity, but also nanomaterial aggregation contribute to its antibacterial activity. The development of antibacterial agents based on SQDs and their acquired biocompatibility encouraged us to explore possible in vivo applications. The in vivo experiment suggested that there was high effectiveness for wound healing without any harmful effect on normal tissue when a less hydrophobic methyl head group was used. Therefore, it is important to understand the role of a hydrophobic moiety on the surface of nanoantibiotics to continue the war against bacterial illness at the clinical level.
Results and discussion
Synthesis and characterization of SQDs
We prepared the SQDs through a hydrothermal method using sublimed sulfur and p-phenylenediamine as the precursors and tetraethylene glycol (TEG) as the stabilizer. Sublimed sulfur exists as S8 units, which upon solvothermal treatment with a linker, results in polymeric nanoparticles.40 These nanoparticles are known as SQDs, and they exhibit luminescence properties. In our experiment, we used p-phenylenediamine as a cross-linker because it is well known to be effective in producing many polymeric nanoparticle formations.65,66 Hence, a mixture of sublimed sulfur and p-phenylenediamine in a 1![[thin space (1/6-em)]](https://www.rsc.org/images/entities/char_2009.gif) :1 ratio was hydrothermally heated to 200 °C for 24 hours in the presence of TEG. After the reaction, the crude mixture emitted luminescence, which indicates the formation of SQDs (Fig. 1a). Column chromatography was used to purify the crude mixture, with ethyl acetate and hexane as the eluent, and a specific fraction was collected, as shown by the TLC plate under UV light in Fig. 1b. This enabled precise control over the size and composition of the QDs.
:1 ratio was hydrothermally heated to 200 °C for 24 hours in the presence of TEG. After the reaction, the crude mixture emitted luminescence, which indicates the formation of SQDs (Fig. 1a). Column chromatography was used to purify the crude mixture, with ethyl acetate and hexane as the eluent, and a specific fraction was collected, as shown by the TLC plate under UV light in Fig. 1b. This enabled precise control over the size and composition of the QDs.
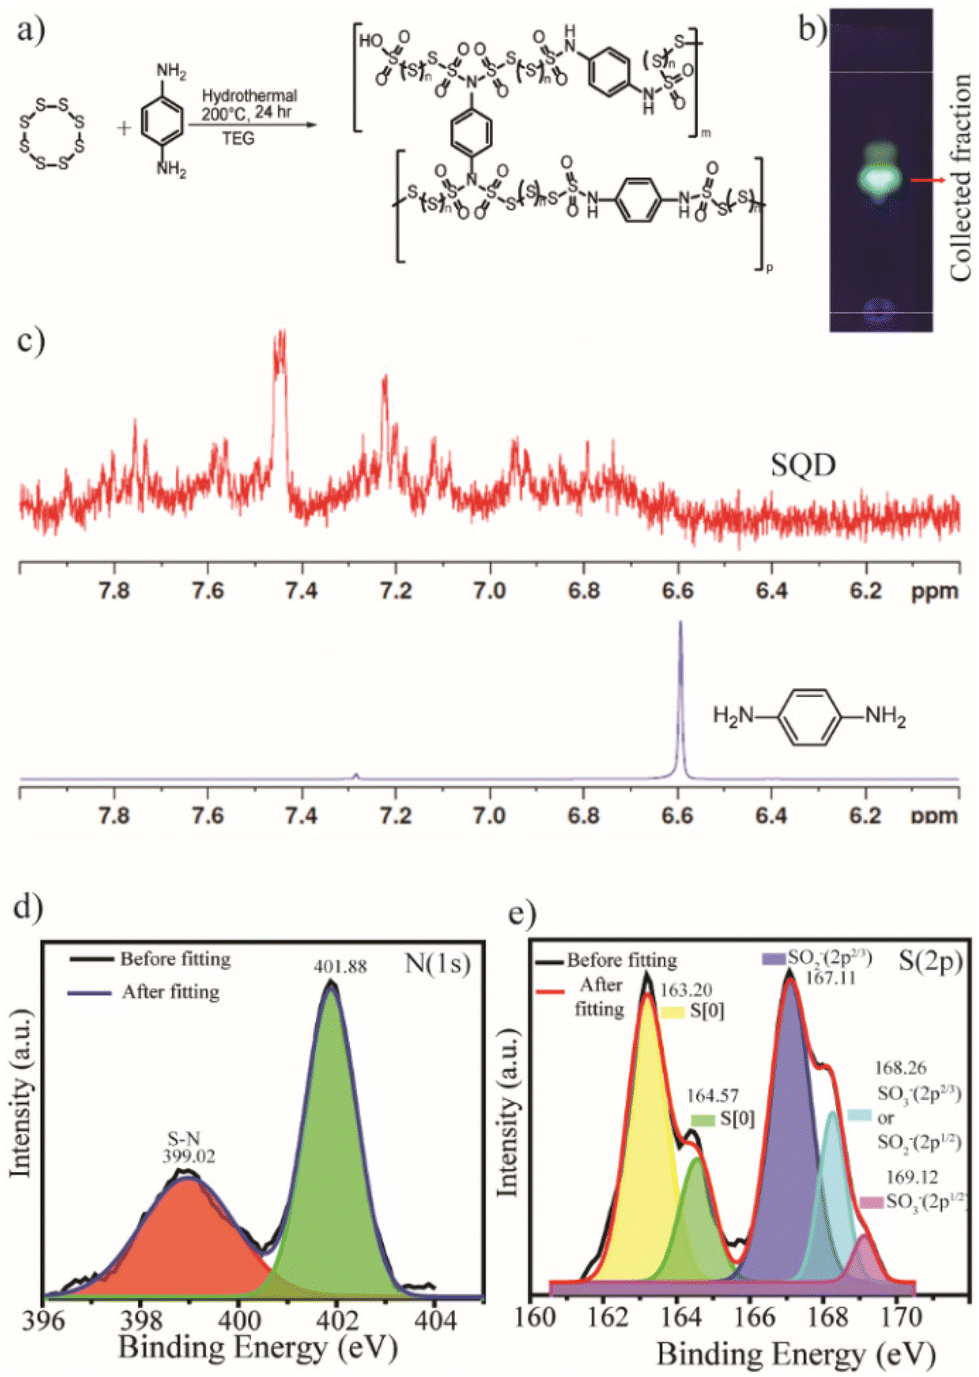 | ||
| Fig. 1 Analysis of the structural composition of SQDs: (a) scheme for hydrothermal synthesis of SQDs using sublimed sulfur and p-phenylenediamine as the precursors and tetraethylene glycol (TEG) as the stabilizer. (b) Image of a TLC plate of the reaction mixture under UV light. For the mobile phase, 1:1 ethyl acetate–hexanes were used. (c) 1H NMR spectra of p-phenylenediamine and SQDs in CDCl3 and CD3OD. (d) High-resolution XPS spectra of N (1s), and (e) high-resolution XPS of S (2p). | ||
The composition of the SQDs was determined using 1H NMR and X-ray photoelectron spectroscopy (XPS). The 1H NMR spectrum of p-phenylenediamine showed a sharp singlet peak in the aromatic region. In contrast, there were multiple peaks in the aromatic regions of the SQDs, due to the variable proton environment (Fig. 1c). This clearly signified that after the formation of QDs, the aromatic protons were in different environments. The chemical composition of SQDs was investigated by XPS, which showed that the SQDs are mainly composed of C, O, S, and N (Fig. S12a†). In the high-resolution XPS spectra of N (Fig. 1d), the peak near 399.02 eV signified the presence of different S–N bonds (–SO2NH and –SO2NSO2–).67–69 The high-resolution XPS spectrum of sulfur is mainly composed of five different peaks (Fig. 1e). The peaks at 163.2 eV and 164.57 eV were assigned to atomic sulfur S[0]. The peak at 167.11 eV was due to the sulfur of SO2− (2p2/3). The peak at 168.26 eV was due to SO2− (2p1/2) or SO3− (2p2/3), and the peak at 169.12 eV was attributed to SO3− (2p1/2).41
After evaluating the structural composition, we explored the optical properties and morphology of the SQDs. The UV-Vis spectra of the synthesized material show two major absorption peaks at 247 nm and 410 nm (Fig. 2a). The peak in the range of 150–250 nm corresponded to the transition of nonbonding electrons of heteroatoms (S, O) from n → σ*.42 The broad peak centered at 410 nm signified the presence of Sx2− (S42−, S62−, S82−), which can be correlated with the XPS analysis.70 The photoluminescence spectrum of SQDs shows an excitation-independent emission (Fig. 2b), which indicates that only a single domain of a chromophore is present in the synthesized material. The maximum excitation and emission wavelength of SQDs are 400 nm and 546 nm, respectively.
 | ||
| Fig. 2 Optical and microscopic characterization of SQDs: (a) UV-Vis spectra of SQDs. (b) Fluorescence emission spectra of SQDs upon excitation at various wavelengths. (c) AFM and (d) TEM images of SQDs. (e) HAADF-HRSTEM image of SQDs, with the inset showing the SAED pattern. (f–h) HAADF-STEM image of SQDs, with elemental mapping of sulfur and oxygen. | ||
After examining the optical properties, the morphology of the SQDs was determined by atomic force microscopy (AFM) and transmission electron microscopy (TEM) imaging. The AFM analysis showed a uniform distribution of quantum dots, with heights ranging from 2 to 3 nm (Fig. 2c). The TEM analysis showed that the average size of the SQDs is approximately 3 nm (Fig. 2d). The high angle annular dark field-high resolution scanning transmission electron microscopy (HAADF-HRSTEM) image of SQDs (Fig. 2e) reveals the nanocrystalline structure of QDs, as evident from the luminescence properties. The d-spacing obtained from the selected area electron diffraction (SAED) pattern is 0.32 nm, and is consistent with the (311) plane of S8 (Fig. 2e).71 To more closely study the composition and structure of SQDs, elemental analysis was performed. Fig. 2f shows that the HAADF-STEM image of SQDs is consistent with the TEM image. Notably, the elemental mapping shows the homogeneous distribution of sulfur (Fig. 2g) and oxygen (Fig. 2h), which is consistent with the XPS results. All the above measurements confirm the formation of SQDs with uniform distribution.
Functionalization of SQDs
The surface functionalization of SQDs by thiol ligand could be a great tool to modulate biomolecular interaction. Keeping this in mind, we tailored the surface of SQDs by attaching thiol ligands (Fig. 3a). Due to the presence of the S–S bond in the core of the material, an opportunity was provided to form an S–S bond on the surface upon post-synthetic modification by thiol ligand. To establish the surface functionalization of SQDs, synthesis of a series of thiol-containing ligands with different head groups possessing different charges was performed. The detailed synthetic procedure is given in the ESI (Fig. S1†). The structure of the ligands can be divided into four different segments. First, a thiol group at the end was anchored to the SQDs, and was further attached with an alkane chain to impart stability. The tetraethylene glycol (TEG) portion imparted biocompatibility, and finally, the head group enabled the incorporation of different charges in the ligand system. To impart a neutral charge to the surface of the SQDs, a hydroxyl group was used as the head group. In contrast, a carboxyl group was used as the head group for incorporating a negative charge, and a quaternary ammonium group was used as the head group to incorporate a positive charge on SQDs (Fig. 3b). The synthesized ligands were then added to SQDs and stirred for 48 hours to achieve surface functionalization. The unbound ligands were then removed by repeated washing with dichloromethane (DCM).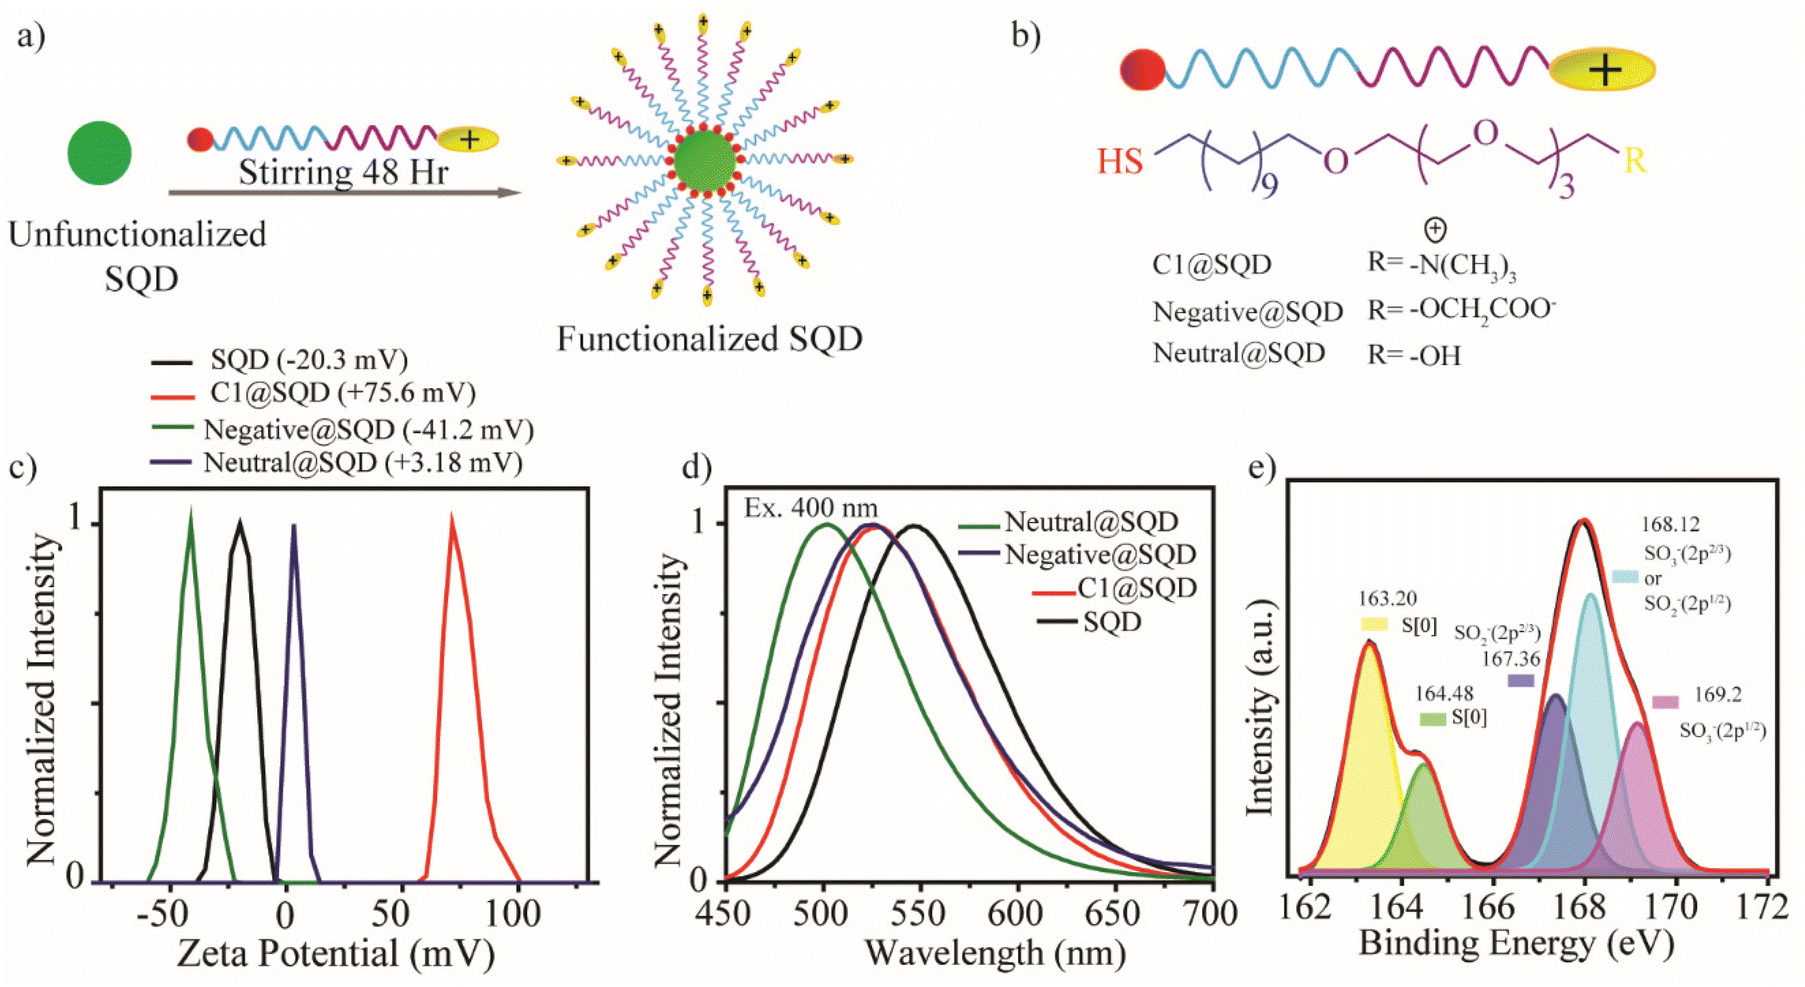 | ||
| Fig. 3 Surface functionalization of SQDs with various thiol ligands: (a) scheme of functionalization of SQDs. (b) Structure of the ligands used for functionalization. (c) Zeta potential of the functionalized SQDs. (d) Fluorescence emission spectra of the functionalized SQDs (excitation 400 nm). (e) XPS spectra of C1@SQDs. | ||
The shift in the zeta potential of the functionalized material with respect to the native SQDs confirmed effective surface functionalization (Fig. 3c). Compared to native SQDs with a zeta potential of −20.3 mV, there was a significant shift in zeta potential to +75.6 mV for C1@SQDs. Likewise, the zeta potential for neutral@SQDs was 3.18 mV, and for negative@SQDs, the zeta potential was −41.2 mV. The blueshift in the emission peak of the photoluminescence spectrum of the functionalized SQDs with respect to native SQDs further supported the surface modification. Upon excitation at 400 nm, an emission peak near 546 nm was observed for native SQDs, whereas the emission peaks for C1@SQDs, negative@SQDs, and neutral@SQDs were near 530 nm, 525 nm, and 502 nm, respectively (Fig. 3d).
Furthermore, the infrared (IR) spectra of functionalized SQDs contained all the signature peaks of ligands, which were not present in those for native SQDs (Fig. S13†). The peaks near 2900 cm−1 corresponded to the asymmetric stretching vibrations of –CH2– and –CH3. For neutral@SQDs and negative@SQDs, the broad peak near 3450 cm−1 signified the presence of the hydroxyl group and acid group, respectively. Additionally, there was significant enhancement of the relative peak intensity of S and N in the XPS spectra of C1@SQDs compared to native SQDs (Fig. S12c and d†). Moreover, the increase in SO3− peak intensity of C1@SQDs compared to S[0] supported the presence of counterion OMs− (Fig. 3e).
The functionalized SQDs exhibited absorption characteristics in their UV-Vis spectra that were the same as those of native QDs. This strongly showed that the core of the SQD nanostructure was unaltered after functionalization (Fig. S14b†). All these studies are in accordance with the surface functionalization of SQDs. Effective surface functionalization on SQDs can produce materials that are effective for therapeutic and diagnostic applications. To the best of our knowledge, the effect of SQD surface functionalization on antibacterial activity has not been reported thus far. Based on earlier studies, we explored the antibacterial effect of functionalized SQDs as a proof-of-concept, where functionality may play a major role.
Antibacterial activity of functionalized SQDs
Wang et al. first explored the antibacterial activity of SQDs with an MIC of 1.2 mg mL−1 against MRSA and PA bacteria.46 To increase the effectiveness of SQDs against bacteria, surface functionalization can play an important role, as evident from earlier reported works.22 Thus, the functionalized SQDs we created were evaluated for MIC and minimum bactericidal concentration (MBC) against two Gram-positive (MRSA and E. faecalis) and two Gram-negative (PA and E. coli) bacteria. The antibacterial efficacy of the functionalized SQDs was evaluated from the bacterial growth kinetics. To confirm the growth kinetics, bacterial solutions with OD = 0.01 (106–107 CFU mL−1) were incubated with different concentrations of materials, and the change in optical density was measured over a period of 16 h. The concentration at which no bacterial growth was observed in the kinetic plot is known as the MIC. The bacteria-killing efficiency of these functionalized materials was then evaluated by streaking the treated solutions on an agar plate. The concentration at which there is no formation of bacterial colonies on the agar plate is known as the MBC concentration. As expected, there was no antibacterial activity by native SQDs, neutral@SQDs, or negative@SQDs against Gram-positive or Gram-negative bacteria up to a concentration of 5 μg mL−1 (Fig. 4a–f and S15a–f†). C1@SQDs showed very high antibacterial activity against Gram-positive MRSA and E. faecalis. The MIC values against MRSA and E. faecalis were 25 ng mL−1 (Fig. 4g) and 10 ng mL−1 (Fig. S15g†), respectively, which is 5–12 × 104 times less compared to the earlier reported MIC values using SQDs.46 Similarly, the MBC value noted for MRSA was 25 ng mL−1 (Fig. 4h), and for E. faecalis, it was 80 ng mL−1 (Fig. S15h†). This is most likely due to the electrostatic interaction of positively charged SQDs with negatively charged bacterial cell membranes.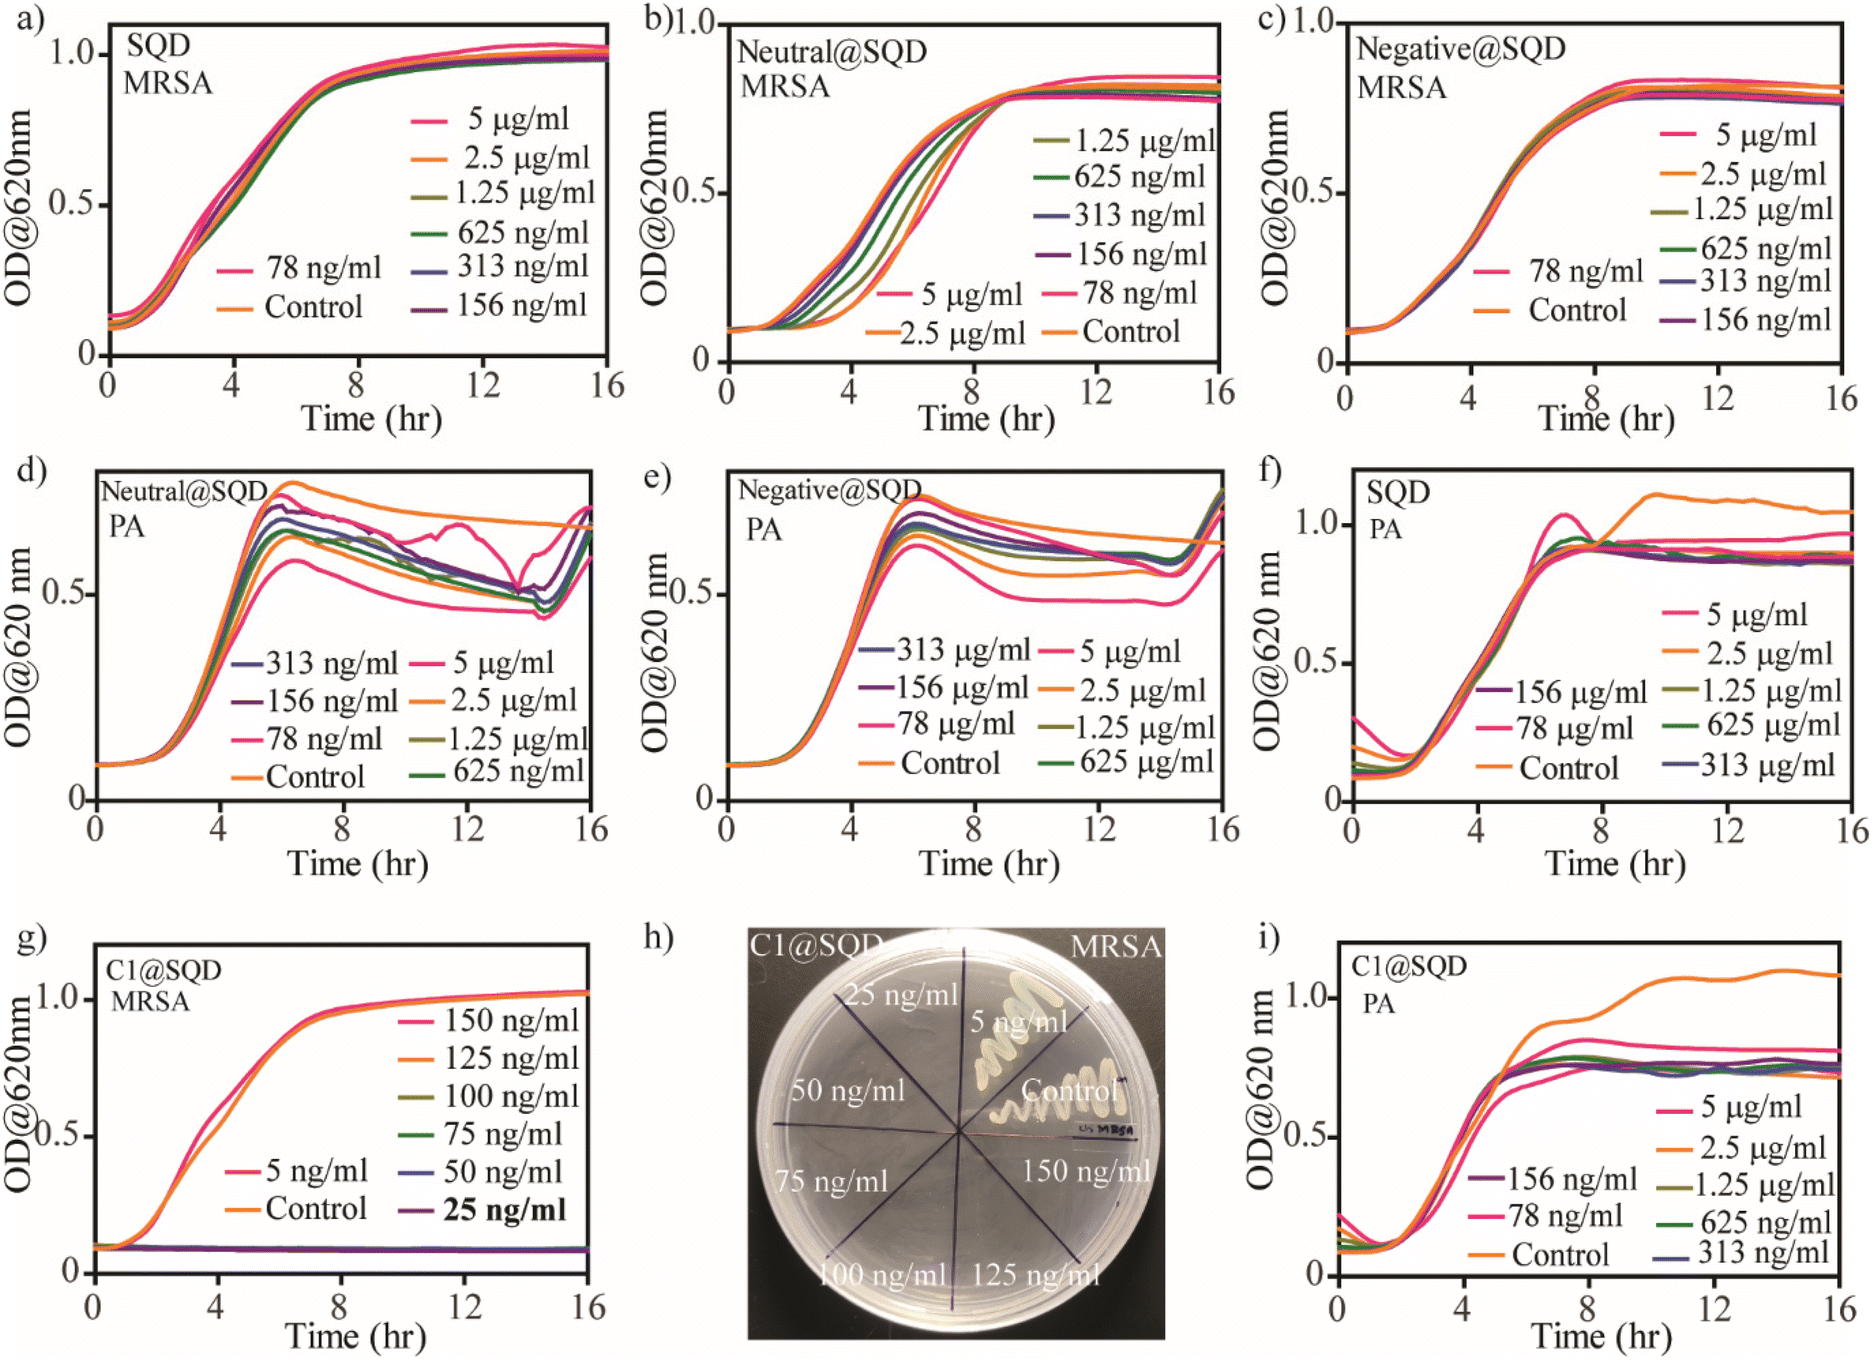 | ||
| Fig. 4 Evaluation of antibacterial efficacy of functionalized SQDs. Kinetic growth curve of MRSA in the presence of (a) only SQDs, (b) neutral@SQDs, and (c) negative@SQDs. Kinetic growth curve of PA in presence of (d) only SQDs, (e) neutral@SQDs, and (f) negative@SQDs. (g) Kinetic growth curve of MRSA in the presence of C1@SQDs. (h) Colony-forming ability of MRSA after treatment with C1@SQDs. (i) Kinetic growth curve of PA in the presence of C1@SQDs. | ||
After evaluating the antibacterial activity of C1@SQDs against Gram-positive bacteria, we then confirmed the antibacterial efficacy against Gram-negative bacteria. We noted that C1@SQDs are ineffective against the Gram-negative bacteria PA (Fig. 4i) and E. coli (Fig. S15i†) at concentrations up to 5 μg mL−1. The presence of the outer lipopolysaccharide layer over the peptidoglycan layers on the cell wall of Gram-negative bacteria rendered C1@SQDs ineffective. To increase the effectiveness of SQDs against Gram-negative bacteria, hydrophobicity can be incorporated into the ligand system. There are several reports describing the enhancement of antibacterial activity by an increase in the hydrophobicity on the nanomaterial surface.36,54,72 To achieve that goal, we synthesized positively charged ligands with an n-hexyl (–+N(CH3)2n-C6H13) and n-octyl (–+N(CH3)2n-C8H17) head group in place of one methyl group (Fig. S1†). Using our developed method, these ligands were then used to functionalize the surface of SQDs.
The functionalized materials were then characterized by zeta potential measurement, fluorescence emission peak shift, and IR spectra. The change in the zeta potential of SQDs from −20.3 mV to +84.6 mV (for C6@SQDs) and +82.2 mV (for C8@SQDs) indicates the effective surface functionalization (Fig. S16a†). Moreover, the blueshift in the emission peaks of C6@SQDs and C8@SQDs upon excitation at 400 nm supports the functionalization (Fig. S16b†). The presence of the ligand's characteristic peaks in the IR spectra (asymmetric stretching vibrations of –CH2– and –CH3 near 2900 cm−1) also confirm the effective surface functionalization (Fig. S16c†). After the functionalization, we tested this material's antibacterial efficacy against Gram-positive and Gram-negative bacteria. We observed that the n-hexyl and n-octyl ligand-functionalized SQDs (C6@SQDs and C8@SQDs) were still ineffective against the Gram-negative bacteria up to 5 μg mL−1 concentration (Fig. S17†). To our surprise, there was decreased efficacy for both Gram-positive bacteria as compared to C1@SQDs. Additionally, the antibacterial activity of C6@SQDs was higher as compared to C8@SQDs against both Gram-positive bacteria. The MIC and MBC values for C6@SQDs against MRSA were 50 ng mL−1 for each (Fig. 5a and b). For C8@SQDs, the MIC and MBC values against MRSA were noted to be 125 ng mL−1 and 225 ng mL−1, respectively (Fig. 5c and d). Similarly, the MIC and MBC values for C6@SQDs against E. faecalis were 60 ng mL−1 and 100 ng mL−1, respectively (Fig. S18a and b†). For C8@SQDs, the MIC and MBC values against E. faecalis were both 140 ng mL−1 (Fig. S18c and d†). The MIC and MBC values are summarised in Table 1.
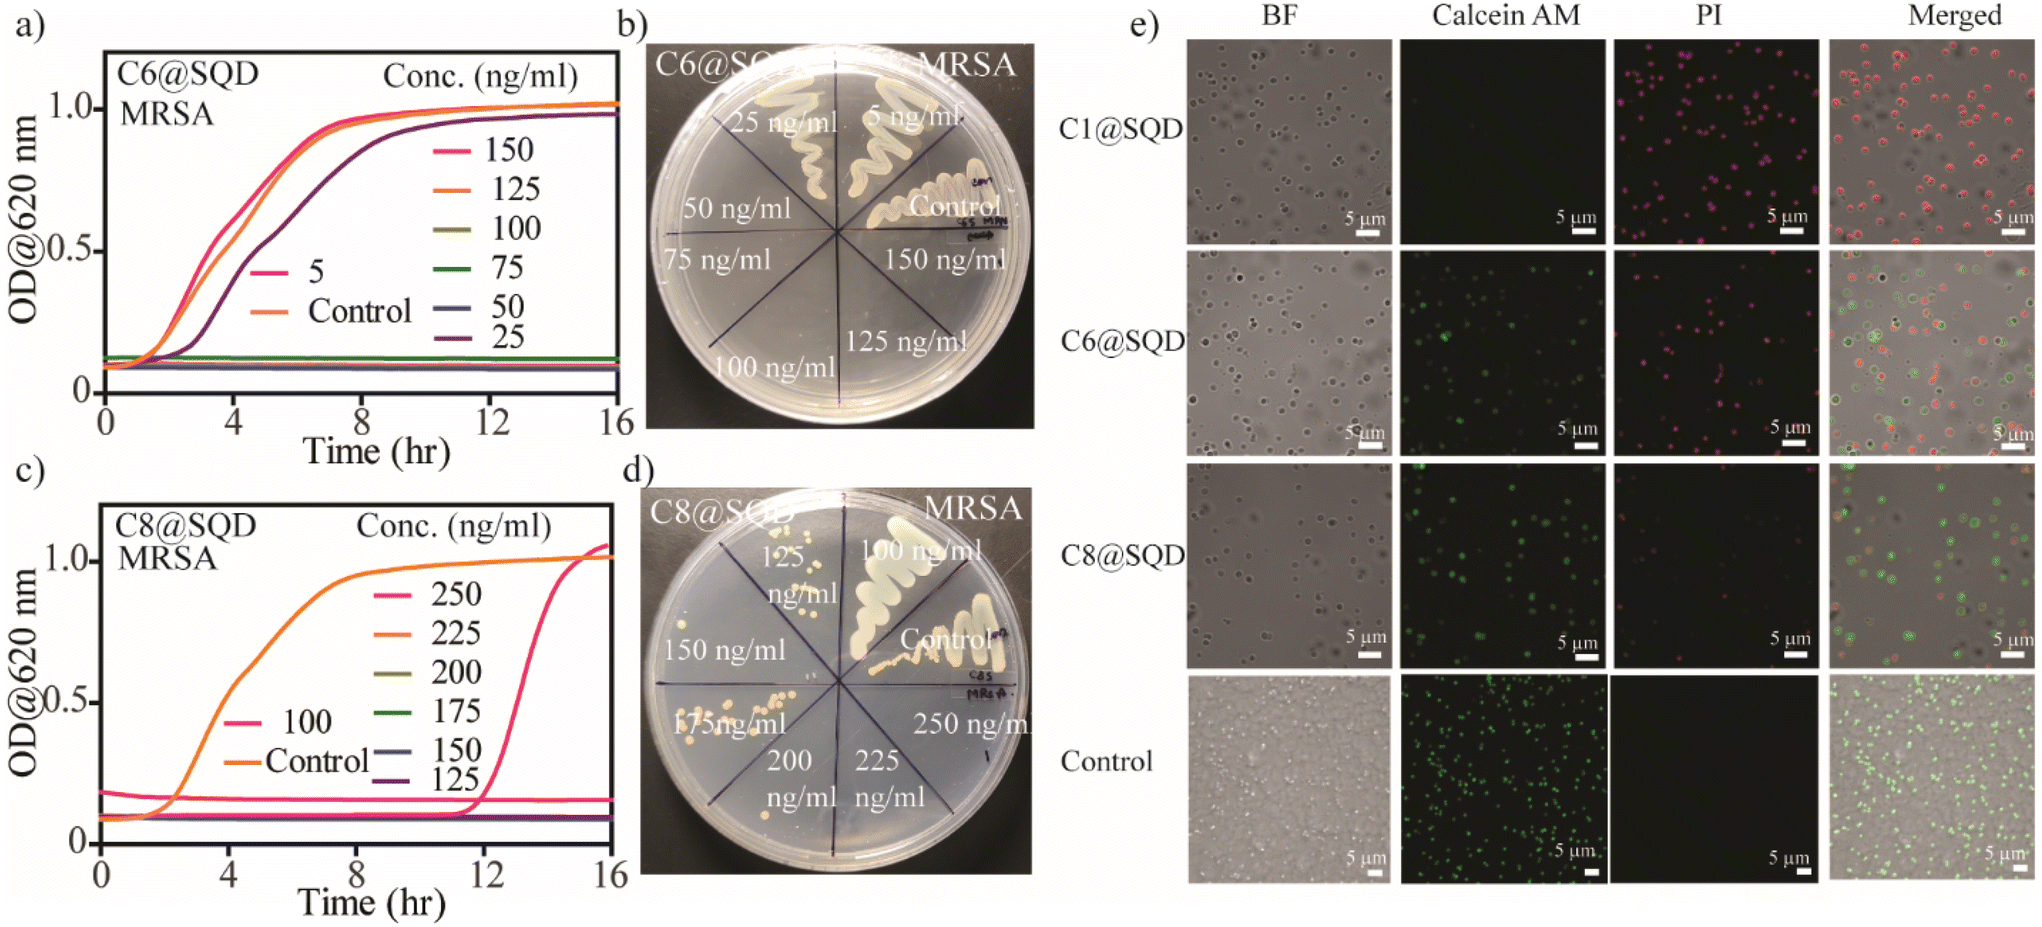 | ||
| Fig. 5 Evaluation of antibacterial efficacy of SQDs after hydrophobic ligand conjugation. (a) Kinetic growth curve of MRSA in the presence of C6@SQDs. (b) Colony-forming ability of MRSA after treatment with C6@SQDs. (c) Kinetic growth curve of MRSA in the presence of C8@SQDs. (d) Colony-forming ability of MRSA after treatment with C8@SQDs. (e) Confocal microscope images of live bacteria (green fluorescence, calcein AM) and dead (red fluorescence, PI) bacteria under different treatments. | ||
| MRSA | E. faecalis | |||
|---|---|---|---|---|
| MIC | MBC | MIC | MBC | |
| SQD | >5 μg mL−1 | >5 μg mL−1 | >5 μg mL−1 | >5 μg mL−1 |
| C1@SQD | 25 ng mL−1 | 25 ng mL−1 | 10 ng mL−1 | 80 ng mL−1 |
| C6@SQD | 50 ng mL−1 | 50 ng mL−1 | 60 ng mL−1 | 100 ng mL−1 |
| C8@SQD | 125 ng mL−1 | 225 ng mL−1 | 140 ng mL−1 | 140 ng mL−1 |
The different bacteria-killing efficiencies of functionalized SQDs can be directly visualized by fluorescence microscopy using simultaneous staining with calcein AM and propidium iodide (PI). Live bacteria stained with calcein AM emit green fluorescence, whereas dead bacteria stained with PI emit red fluorescence. When MRSA bacteria with an OD of 0.2 were incubated with 500 ng mL−1 of functionalized SQDs for 1 h, we observed that the bacteria-killing efficiency of C1@SQDs was the highest, followed by C6@SQDs, and then C8@SQDs (Fig. 5e). This reverse trend of antibacterial activity based on the surface hydrophobicity of the nanomaterial is unique from the surface functionalization point of view. Hence, our attention was subsequently focused on determining the reason for this reverse trend in antibacterial activity.
Mechanistic study
The high antibacterial activity of positively charged SQDs can be ascribed to two reasons. The first one is the core of the material responsible for generating ROS. The second one is surface functionalization, which is responsible for membrane damage. Ellman's assay was performed to quantify the abiotic oxidative stress mediated by functionalized SQDs.73 The percentage loss of glutathione by the functionalized SQDs was estimated using 0.4 mM glutathione incubated with 10 μg mL−1 concentration of functionalized SQDs for 1 h. As shown in Fig. 6a, the percentage loss of glutathione follows the trend SQDs > C1@SQDs ≈ C6@SQDs > C8@SQDs. This clearly suggests that after functionalization, C1@SQDs and C6@SQDs are almost equally effective in generating abiotic oxidative stress. In comparison, C8@SQDs are the least effective QD, and these data can be correlated with their antibacterial activity trends.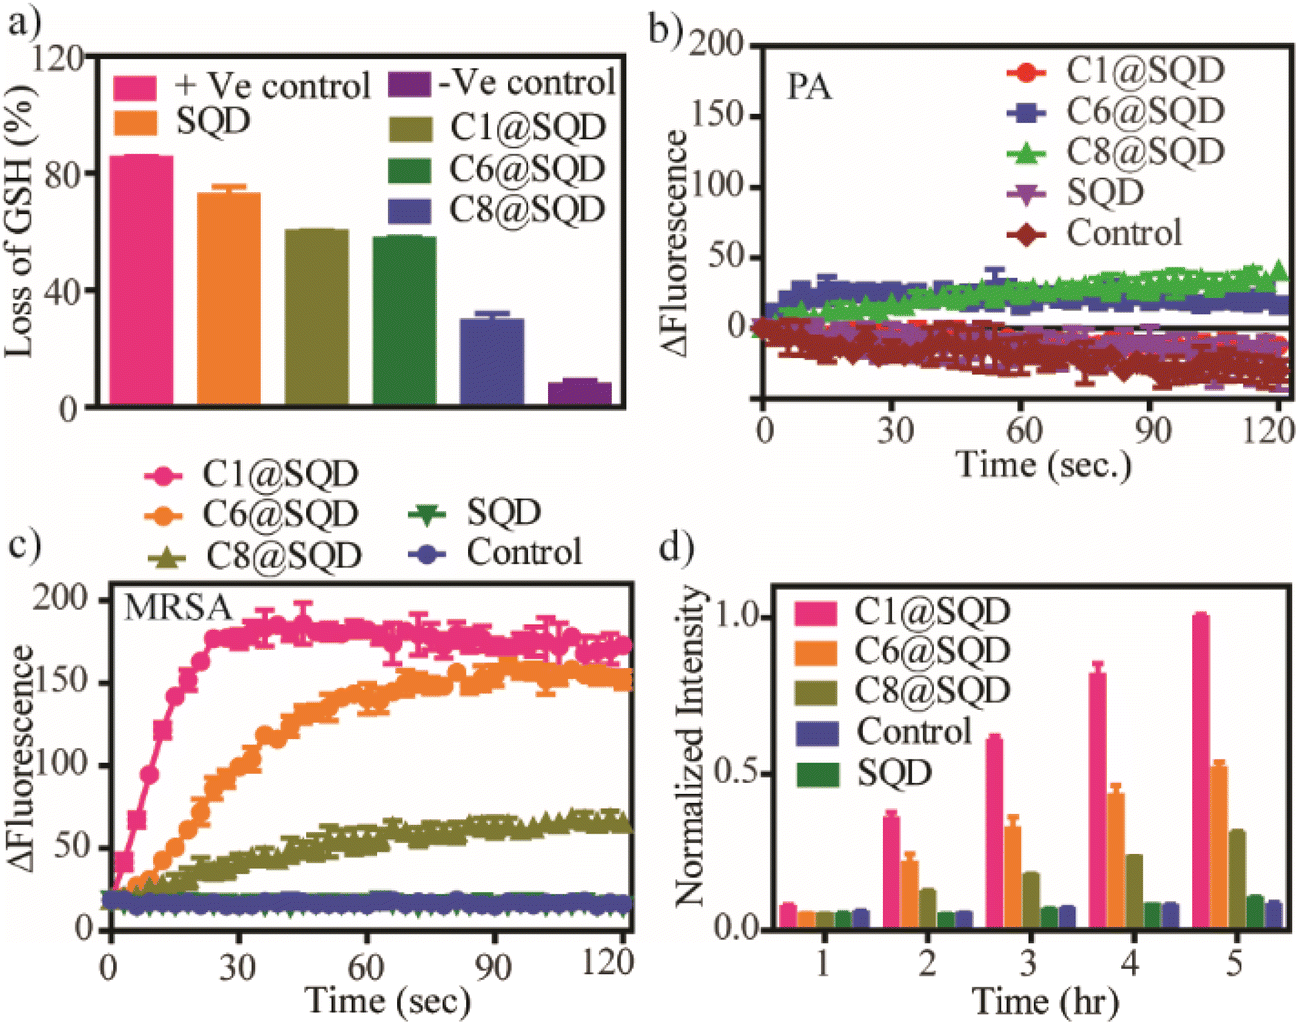 | ||
| Fig. 6 Mechanistic investigation to understand the different antibacterial activities of functionalized SQDs. (a) Estimation of abiotic oxidative stress of functionalized SQDs (10 μg mL−1) by Ellman's assay after incubation for 1 h. The positive control used was 10 mM H2O2, and without material was considered to be the negative control. (b) Quantification of the membrane depolarization ability of functionalized SQDs (4 μg mL−1) against the Gram-negative bacteria PA. (c) Quantification of the membrane depolarization ability of functionalized SQDs (4 μg mL−1) against the Gram-positive bacteria MRSA. (d) Estimation of intracellular ROS generation by functionalized SQDs (400 ng mL−1) at different time intervals. | ||
SQDs are recognized for their potential to generate singlet oxygen and hydroxyl radicals, and therefore, we conducted assessments to evaluate their singlet oxygen- and hydroxyl radical-generation capability.46 To investigate singlet oxygen generation efficacy, we employed 1,3-diphenylisobenzofuran (DPBF), a compound highly reactive towards singlet oxygen (1O2). DPBF exhibits a peak absorption at approximately 410 nm, which gradually diminishes in the presence of singlet oxygen due to the formation of a diketo derivative known as 1,2-dibenzoylbenzene (DBB), which is catalysed by singlet oxygen-mediated ring opening. As depicted in Fig. S19a,† there was a progressive decrease in the absorbance intensity at 410 nm when DPBF was incubated with SQDs. In contrast, no such decrease in intensity was observed in the case of DPBF alone. This observation suggests that SQDs indeed possess the capability to generate singlet oxygen.
To assess the effectiveness of SQDs in generating hydroxyl radicals, we introduced isopropyl alcohol into the Ellman's assay procedure (Fig. S19b†). Isopropyl alcohol is recognized for its ability to quench hydroxyl radicals within a solution. However, under our experimental conditions, we did not observe any change in glutathione level compared to the control. This absence of glutathione loss with respect to the control indicates that hydroxyl radicals were not generated in the solution. Hence, the SQD core is mainly responsible for generating singlet oxygen. Due to the presence of a positive charge on the surface of functionalized SQDs, they are also expected to show a very high affinity for adherence to the bacterial surface. Thus, the membrane depolarization ability of the functionalized SQDs was evaluated using the sensitive cationic dye 3,3-dipropylthiadicarbocyanine iodide (DISC3(5)). The dye has a tendency to accumulate in-between the cytoplasmic and peripheral membrane, which results in self-quenching of the fluorescence intensity.74,75 Any factor that causes depolarization of the bacterial surface leads to the release of the dye, and hence, the fluorescence intensity is enhanced.
We observed that for the Gram-negative bacteria PA, the functionalized SQDs were incapable of depolarizing bacterial membranes due to the presence of an external lipopolysaccharide layer over the peptidoglycan layer that renders functionalized SQDs ineffective against Gram-negative bacteria (Fig. 6b). For the Gram-positive bacteria MRSA, the membrane depolarization ability followed the order C1@SQDs > C6@SQDs > C8@SQDs (Fig. 6c), which is a completely reversed trend compared to earlier reported literature.54,72,76 Furthermore, the intracellular ROS-generating ability of this functionalized material was estimated by the fluorescent probe 2′,7′-didichlorofluoresceiniacetate (DCFDA). The DCFDA dye is able to penetrate the cell, and generates fluorescence due to the conversion to 2′,7′-dichlorofluorescein (DCF) in the presence of ROS. The intercellular ROS-generating abilities of the functionalized SQDs follow the order C1@SQDs > C6@SQDs > C8@SQDs (Fig. 6d), which is again a reverse trend with respect to earlier reports. The membrane depolarization and the intracellular ROS generation support the reverse trend of antibacterial activity of the functionalized SQDs. However, we were curious as to the origin of the reverse trend for membrane depolarization and the intracellular ROS-generation ability of functionalized SQDs.
To determine the reason, we confirmed the state of the material after functionalization by AFM, TEM, and DLS. We noted that there was a tendency for the hydrophobic ligand-functionalized SQDs to aggregate. For C1@SQDs, no such aggregation was observed in AFM or TEM images (Fig. 7a and d). However, the AFM and TEM images of C6@SQDs (Fig. 7b and e) and C8@SQDs (Fig. 7c and f) showed a significant amount of aggregation, where C8@SQDs showed a higher tendency of aggregation as compared to C6@SQDs. A similar observation was reflected in the DLS measurement (Fig. S20†). The hydrodynamic diameter (Dh) of SQDs was 93.6 nm, and it increased to 342 nm for C1@SQDs due to the insertion of ligand and greater hydration, whereas the Dh of C6@SQDs and C8@SQDs increased to 781.8 nm and 827.3 nm, respectively, due to the aggregation. We also assessed the polydispersity index (PDI) of the functionalized materials. The PDI value for C1@SQDs was approximately 0.272, while for C6@SQDs, it was 0.655, and for C8@SQDs, it was 0.805. The increased PDI values for C6@SQDs and C8@SQDs indicate higher levels of aggregation.
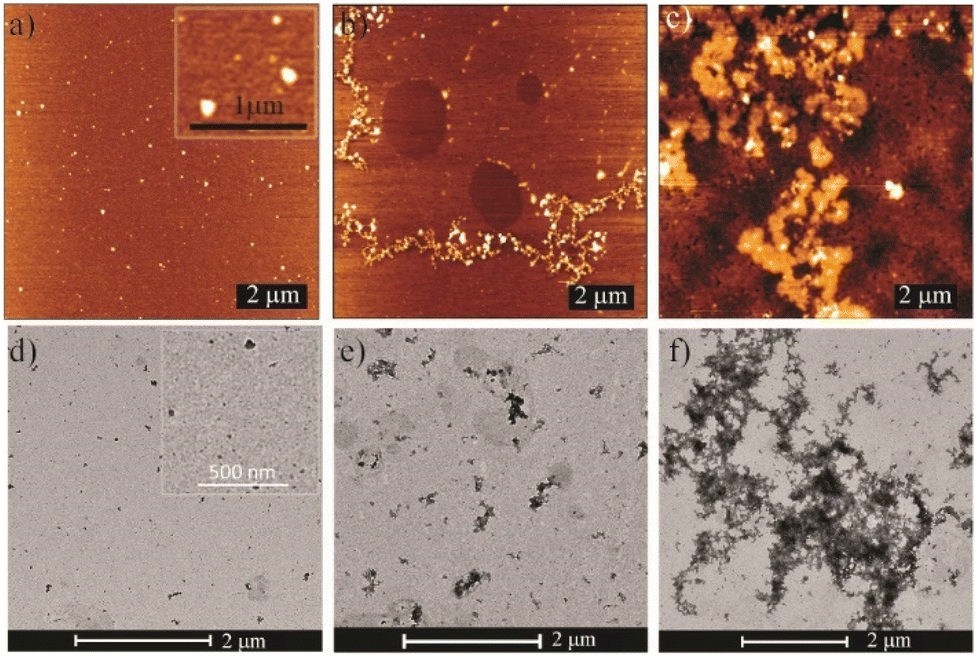 | ||
| Fig. 7 AFM images of functionalized SQDs: (a) C1@SQDs, (b) C6@SQDs, and (c) C8@SQDs. TEM images of functionalized SQDs: (d) C1@SQDs, (e) C6@SQDs, and (f) C8@SQDs. | ||
The abiotic oxidative stress generation, membrane depolarization, and intracellular ROS generation are directly related to their level of aggregation after functionalization. As mentioned earlier, the charges of C6@SQDs (+84.6 mV) and C8@SQDs (+82.2 mV) were found to be higher than that of C1@SQDs (+75.6 mV) due to aggregation. Because the surface of Gram-positive bacteria is negatively charged due to the presence of teichoic acid, it is expected that the higher charge will kill bacteria with greater effectiveness. However, we have seen that the highest membrane depolarization ability was for C1@SQDs, which was due to aggregation. Thus, C6@SQDs and C8@SQDs were less effective, even though their charge was higher. C1@SQDs did not show a tendency towards aggregation, and because they exhibited the highest membrane depolarization and intracellular ROS-generation ability, it was the most effective. Hence, the surface hydrophobicity and the nanomaterial state after functionalization play an important role in dictating its antibacterial activity. Linklater et al. showed through a theoretical calculation that when gold nanoparticles are spatially distributed on the bacterial membrane, then the overall stretching is the sum of individual nanoparticle contributions. In contrast, when the nanoparticles are clustered, this creates cumulative stretching at the attachment points. The cumulative stretching may be locally stronger than the individual nanoparticle, but the combined force administered by separated individual nanoparticles would be greater.64
To confirm the attachment of functionalized SQDs on the bacterial surface and thus provide visual verification for the mechanism, the change in the bacterial morphology upon treatment with functionalized SQDs was imaged by scanning electron microscopy (SEM). The SEM image of untreated MRSA bacteria shows a clear spherical morphology with distinct membrane integrity (Fig. 8a). In comparison to this, C1@SQDs incurred severe damage to the bacterial membrane (Fig. 8b). No evidence of aggregation of C1@SQDs was observed on the bacterial surface. In contrast to this, C6@SQD-treated bacteria showed slightly less membrane deformation in the SEM image (Fig. 8c). The SEM image of bacteria treated with C8@SQDs shows membrane deformation along with evidence of aggregated materials on the bacterial surface (marked with a white arrow, Fig. 8d). As in the SEM image, the interaction of aggregated material with the bacterial surface is not very clear, and therefore, we proceeded to confirm the interaction of functionalized SQDs through TEM and elemental mapping. The TEM image of untreated MRSA shows a clear spherical morphology (Fig. 9a and S21a†), whereas the bacteria treated with C1@SQDs exhibit severe membrane deformation (Fig. 9c and S21b†). The layered structure associated with the bacterial cells consists of ruptured cell membranes.
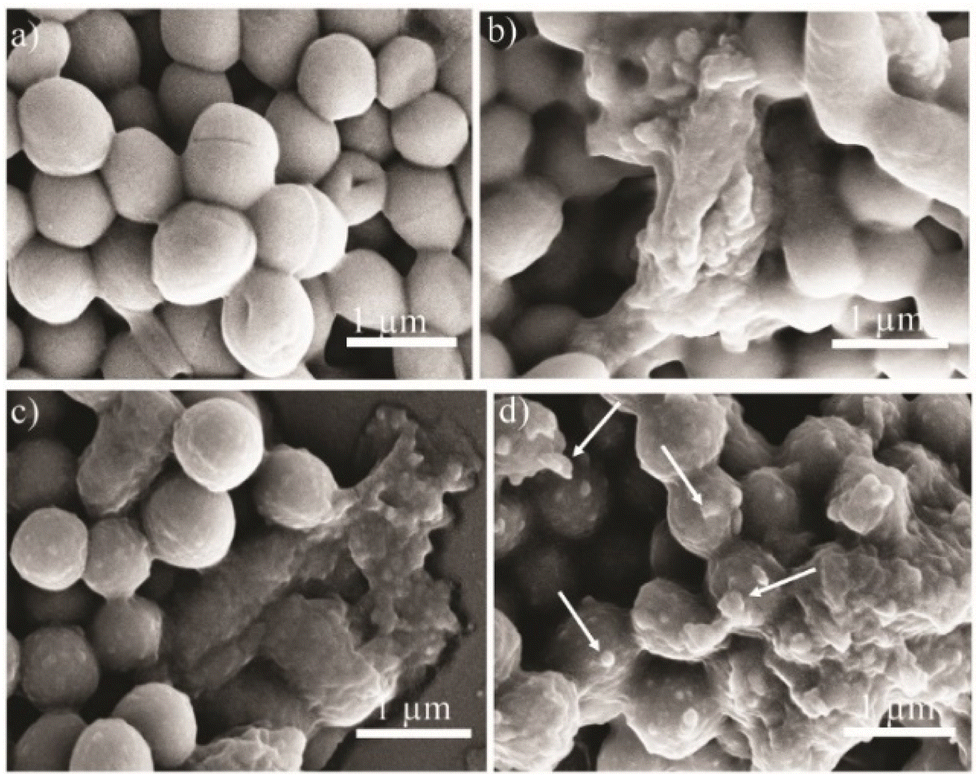 | ||
| Fig. 8 SEM image of MRSA bacteria: (a) control; only MRSA, (b) MRSA treated with C1@SQDs, (c) MRSA treated with C6@SQDs, and (d) MRSA treated with C8@SQDs (the white arrow indicates the presence of aggregated material on the bacterial surface). | ||
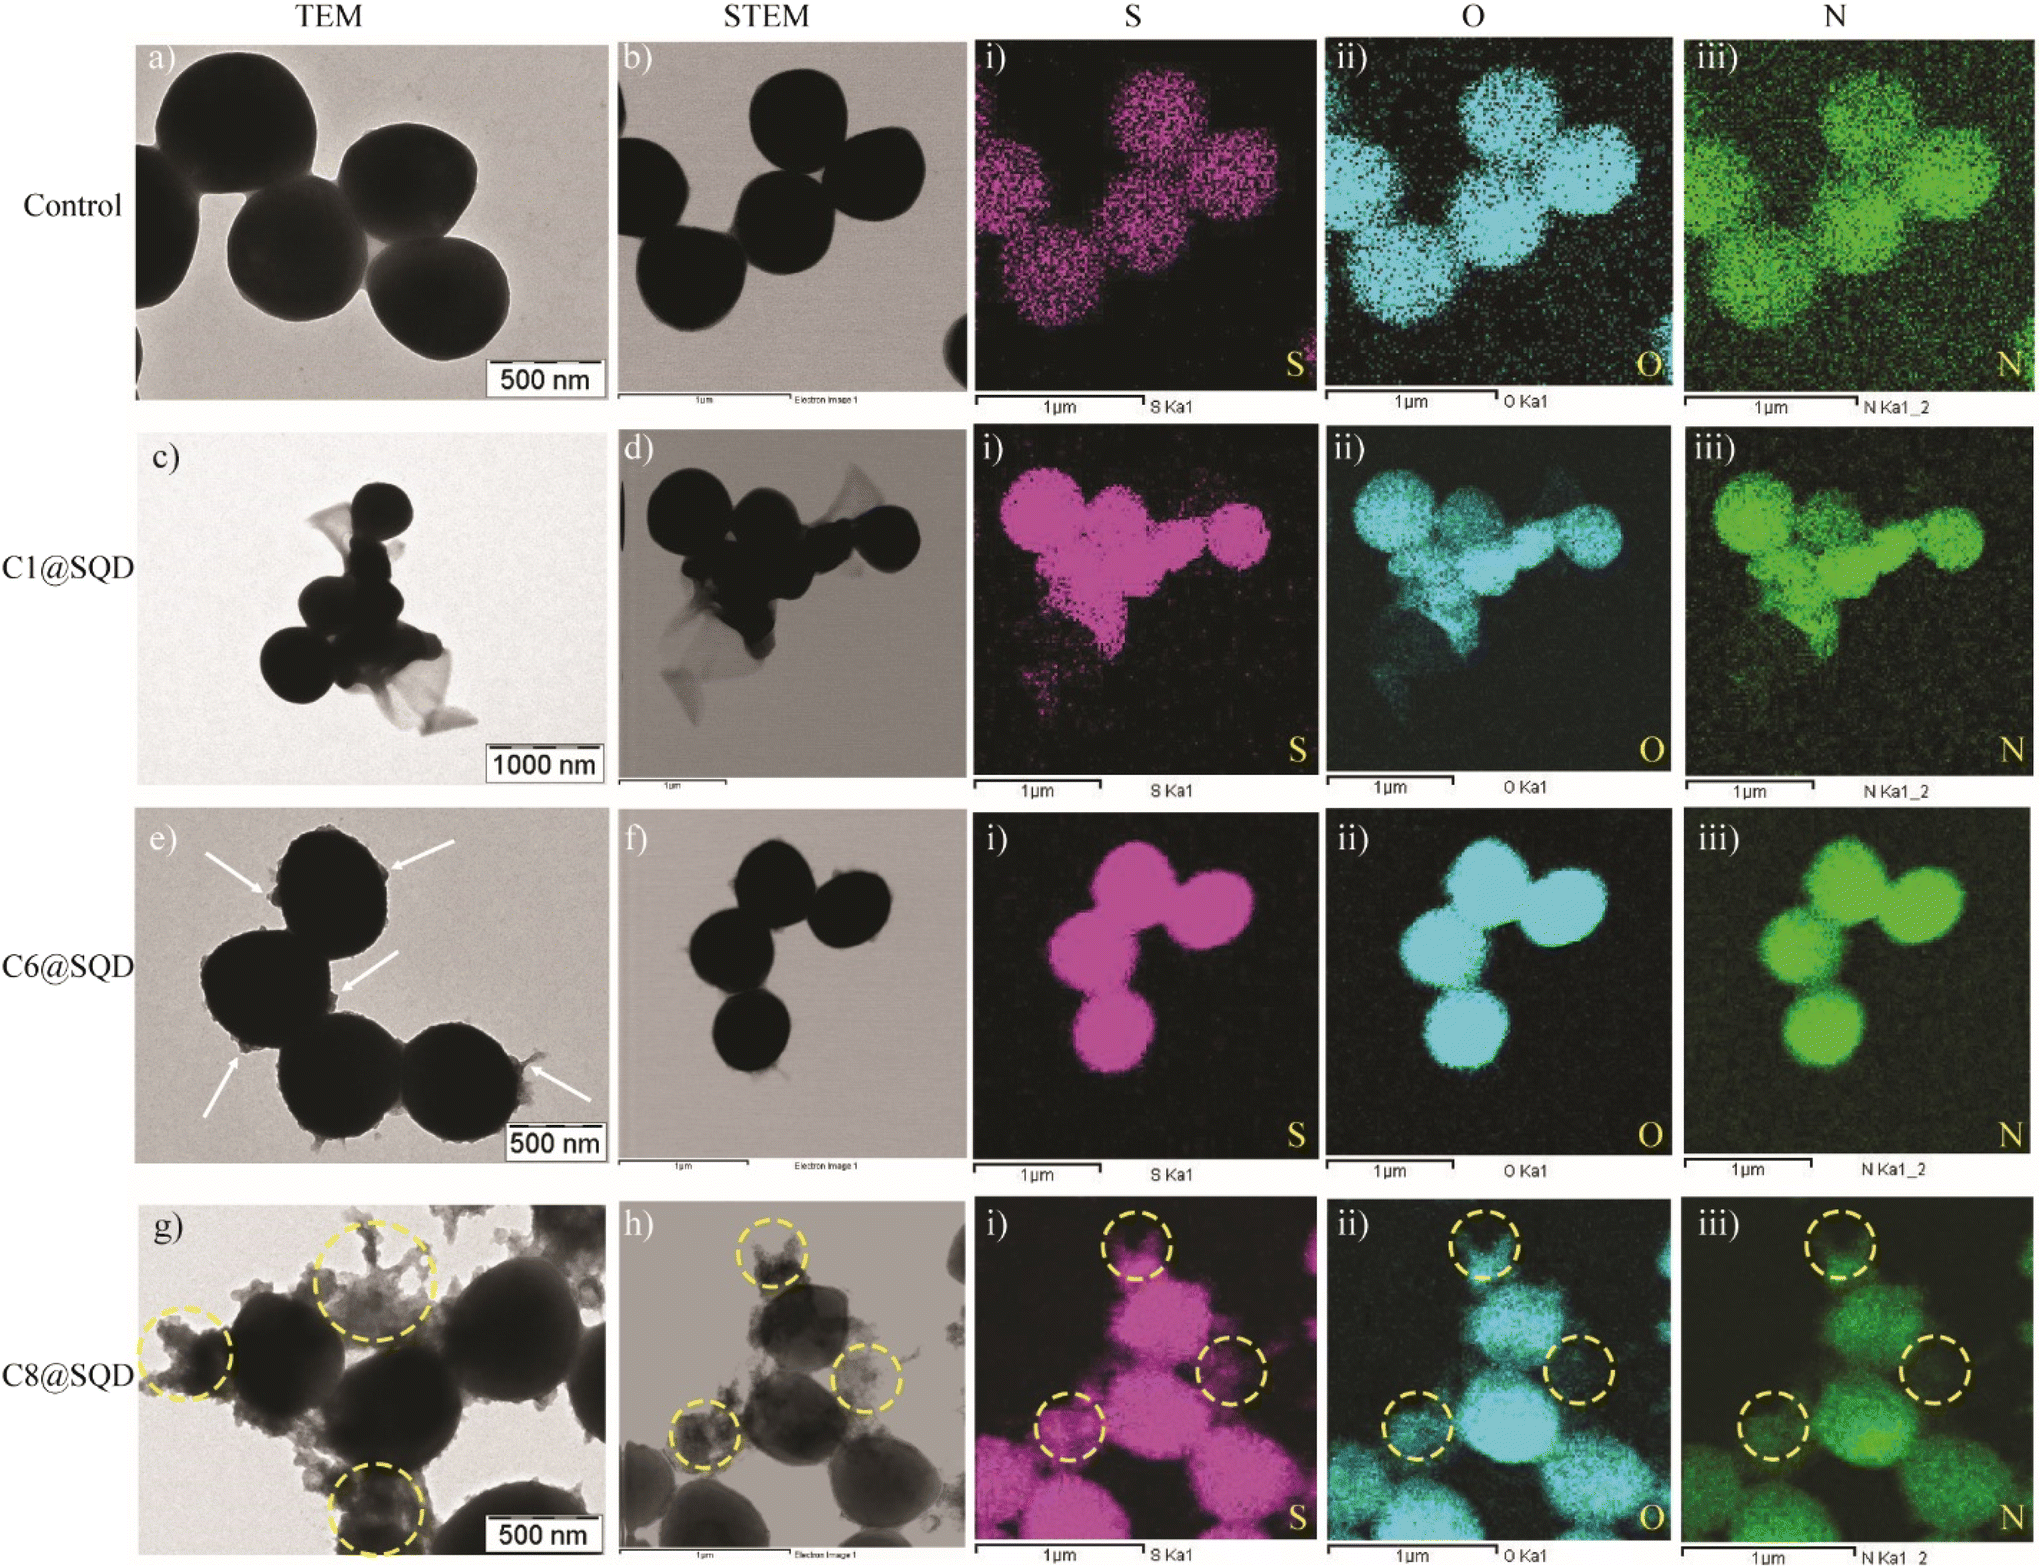 | ||
| Fig. 9 TEM images of MRSA bacteria: (a) MRSA treated with buffer (control), (c) MRSA treated with C1@SQDs, (e) MRSA treated with C6@SQDs (the white arrow indicates the presence of aggregated material on the surface of bacteria), (g) MRSA treated with C8@SQDs (the yellow circles indicate the higher level of aggregation of C8@SQDs on the surface of bacteria). Scanning transmission electron microscopy (STEM) images of MRSA bacteria: (b) MRSA treated with PBS buffer (control), (d) MRSA treated with C1@SQDs, (f) MRSA treated with C6@SQDs, and (h) MRSA treated with C8@SQDs. Elemental mapping: (i) S, (ii) O, and (iii) N. | ||
On the contrary, the TEM image of the bacteria treated with C6@SQDs clearly indicates the presence of aggregated particles on the surface of the bacteria (marked with a white arrow, Fig. 9e and S21c†), and the level of aggregation is low. However, the TEM image of C8@SQD-treated bacteria clearly shows the interaction of aggregated material with the bacterial surface (marked with yellow circles, Fig. 9g and S21d†), which indicates that C8@SQDs possess the lowest antibacterial efficacy. Furthermore, the presence of material on the bacterial surface was confirmed by the elemental mapping of S, O, and N (Fig. 9(i–iii)). The bacteria treated with functionalized SQDs showed a higher contrast of S, O, and N, as compared to the untreated bacteria. Moreover, in elemental mapping, the regions shown by the yellow circle clearly indicate the presence of aggregated C8@SQDs on the bacterial surface (Fig. 9g and h(i–iii)). Hence, it was confirmed that the antibacterial activity not only depends on the surface functionality, but is also heavily dependent on the state of the nanomaterial after functionalization. The very low MIC value of the functionalized SQDs and the critical evaluation of the antibacterial mechanism indicates that functionalized SQDs are robust antibacterial agents that kill Gram-positive bacteria and are promising candidates for various applications in biomedicine.
Hemocompatibility and cellular toxicity of the functionalized SQDs
The hemocompatibility and cytotoxicity of these functionalized SQDs were assessed in vitro. The biocompatibility of a material is mainly dependent on hemocompatibility. Hemolysis assay revealed negligible lysis (approximately 10%) of red blood cells up to a concentration of 800 ng mL−1 (>5× MIC) of the functionalized SQDs (Fig. 10a). This signifies the excellent selectivity of these functionalized SQDs for bacterial cells over mammalian cells. Consequently, the concentration range used in this work would not trigger the osmotic stress-responsive systems of human erythrocytes, and no damage would occur to the erythrocyte membrane. In a complementary experiment, the cellular toxicity of the functionalized SQDs was determined against HeLa cells by MTT assay. We observed that for up to 4× MIC (with respect to MRSA), greater than 80% of cells are viable (Fig. 10b). Consequently, the hemolysis and cytotoxicity studies suggest that there is satisfactory biocompatibility of the material.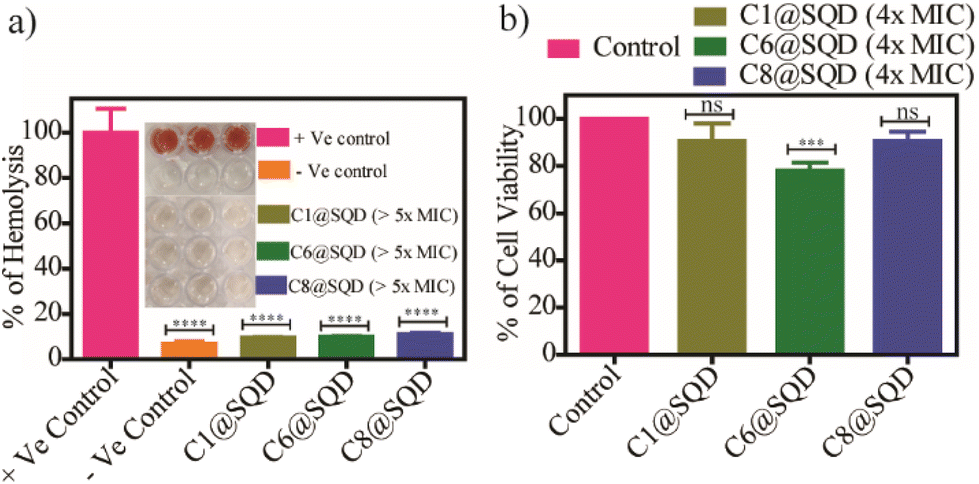 | ||
| Fig. 10 Hemocompatibility and cellular toxicity of functionalized SQDs: (a) hemocompatibility of functionalized SQDs at 800 ng mL−1. (b) Viability of HeLa cells up to 4× MIC of functionalized SQDs (C1@SQDs at 100 ng mL−1, C6@SQDs at 200 ng mL−1, and C8@SQDs at 500 ng mL−1). “ns” denotes not statistically significant, **** denotes p < 0.0001, and *** denotes p < 0.001 with respect to the control. | ||
An evaluation of in vivo wound healing
To evaluate the potential applications of in vivo antibacterial therapy, functionalized SQDs were used for the treatment of previously created wounds on the back of BALB/c mice infected by MRSA bacteria. The protocols for the care and management of the animals followed the guidelines established by the national organization, the ‘Committee for the Purpose of Control and Supervision of Experiments on Animals (CPCSEA),’ and received approval from the Animal Ethics Committee at the Indian Institute of Science (IISc), Bengaluru, (CAF/Ethics/894/2022), India. The animals were divided into six groups, with three mice in each group according to the materials used for the treatment (PBS buffer was used as the negative control, vancomycin as the positive control, and the mice were treated with SQDs, C1@SQDs, C6@SQDs, or C8@SQDs). The wounds were treated with the functionalized SQDs on day 1 and day 3. The doses used for the treatment were 250 ng ml−1, 500 ng ml−1, and 2.25 μg mL−1 for C1@SQDs, C6@SQDs, and C8@SQDs, respectively (the doses were administered in accordance with their MBC values for 10 times the concentration of MRSA). The concentrations used in this study for SQDs and vancomycin were 10 μg mL−1 and 20 μg mL−1, respectively.Fig. 11a and b shows that the rate of wound healing is the highest for C1@SQDs, which is as expected according to previous studies. On the 10th day, the infected wound was nearly healed in the mice of the functionalized C1@SQD group as compared to the control and other groups. A significant wound boundary was still observed in those groups (Fig. 11a). The bactericidal effect was estimated by determining the number of MRSA bacteria in the wound area using the standard plating method (Fig. 11c and S22†). Compared to the control, vancomycin, and the other SQDs, there was a significant reduction in bacterial colonies in the C1@SQD-treated group. Again, in the case of functionalized SQDs, the decrease in bacterial colonies was in accordance with their antibacterial efficacy. This result shows that the reverse trend of antibacterial activity is not only true for in vitro systems, but it also occurred in the in vivo system as well.
 | ||
| Fig. 11 Evaluation of the in vivo wound healing assay: (a) images of the wound area on BALB/c mice, and their subsequent treatment with PBS (control), vancomycin (20 μg mL−1), SQDs (10 μg mL−1), C8@SQDs (2.25 μg mL−1), C6@SQDs (500 ng mL−1), or C1@SQDs (250 ng mL−1). (b) Quantification of wound sizes from different groups. (c) Quantification of the number of bacteria present (CFU mL−1) on the wound area at different times. “ns” denotes not statistically significant, * denotes p < 0.05, ** denotes p < 0.005, *** denotes p < 0.001, and **** denotes p < 0.0001 with respect to the control. | ||
In addition to this, the in vivo biocompatibility of these materials was assessed by biochemical parameters and histological examinations (Fig. S23†). The white blood cells (WBCs) function within the immune system of the body to protect against infections,77 and therefore, the WBCs from blood samples were counted and recorded for C1@SQD-treated animals, followed by C6@SQD- and C8@SQD-treated animals (Fig. S23a†). As expected, we observed the highest count for C1@SQDs. The other indicators in the blood parameters of the treated groups were within the normal range compared to the untreated group (Fig. S23†).
The histopathological analysis by hematoxylin and eosin (H&E) staining revealed faster wound healing on the 10th day in the C1@SQD-treated group, followed by the C6@SQD, C8@SQD, SQD, and vancomycin treatment groups as compared with the control (Fig. 12a). Moreover, by Masson's trichrome staining method, adequate thickness of reepithelialisation, well-organised epidermis, a greater number of dilated follicles, and abundant type 1 collagen deposition was found in C1@SQD-treated animals. Moderate thickness of the epidermal region and less collagen deposition were found in the C6@SQD-treated animals, followed by the C8@SQD-, vancomycin-, and SQD-treated animals as compared with the control group (Fig. 12b). In addition, the inflammatory response upon treatment with the functionalized SQDs was evaluated by TNF-α and IL-6 immune response while staining with diaminobenzidine (DAB). TNF-α is an adipokine and cytokine. As a cytokine, TNF-α invokes the immune system for cell signalling during an inflammatory response. TNF-α signalling also promotes wound healing via the receptor of TNFR2.78,79 Similarly, IL-6 plays a vital role in acute inflammation and is essential for the timely resolution of wound healing. IL-6 signalling is responsible for the shift to a reparative atmosphere.80,81 It is known that IL-6 overexpression is pathologically involved in a number of diseases. With this connection, our immunohistopathological results showed the expression of TNF-α and IL-6 in the immune response of the wound-healing process on the 10th day of skin tissue treatment with C1@SQDs, followed by the groups that received C6@SQDs, C8@SQDs, vancomycin, or SQD treatment as compared with the untreated mouse group.
 | ||
| Fig. 12 Histopathology of skin sections: (a) stained with H&E (20× magnification): (i) control, (ii) SQDs, (iii) vancomycin, (iv) C8@SQDs, (v) C6@SQDs, and (vi) C1@SQDs. (b) Stained with Masson's trichrome: the black arrows indicate the collagen fibers, the red arrows show the regenerated hair follicles, and the yellow marks show the regenerated epidermal layers (i–iii at 20×, and iv–vi at 40× magnification). (c) The immunohistochemistry of TNF-α expression by DAB staining: the arrows show the TNF-α-positive cells. On the 10th day, the arrangement of the proper epidermal layer and hair follicle development was confirmed via the wound-healing process in the C1@SQD-treated group of mice with the expression of TNF-α-positive cells followed by C6@SQDs, C8@SQDs, SQDs, and vancomycin compared with the control group. (d) Immunohistochemical DAB staining of IL-6 expression. On the 10th day, the proper epidermal arrangement and hair follicle development were proven during the wound healing process in the C1@SQD-treated group of mice with the expression of IL-6-positive cells followed by C6@SQDs, C8@SQDs, SQDs, and vancomycin as compared with the control group. The arrows indicate the IL-6-positive cells. (e) The histopathology of vital organs by H&E staining. | ||
The most rapid wound-healing process was observed in the C1@SQD-treated group, where the mice exhibited an immediate wound healing process with an antibacterial effect on the 10th day, and in comparison, additional time was required in the other groups for the wound to heal. Furthermore, there was no significant toxicity that was made apparent in the histopathology analysis of vital organs such as the heart, kidney, liver, lung, and spleen after treatment with vancomycin, SQDs, C8@SQDs, C6@SQDs, or C1@SQDs as compared with the control. The above results indicate that there is great potential for the use of functionalized SQDs in wound healing.
Conclusion
Herein, we report a facile post-synthetic methodology for surface modification of SQDs using various thiol ligands. This can be extended to all types of low-dimensional sulfur nanomaterials and can be utilized over a wide range of applications. Depending on the headgroup of the ligand, we can tune its surface functionality, charge, and even the state of aggregation. All of these phenomena play a crucial role in many biological applications, such as antimicrobial activity assays.There was much higher antibacterial activity by the functionalized SQDs with a methyl head group as compared to the hexyl and octyl head group, which is the opposite of frequently observed phenomenon. Mechanistic investigations revealed that nanomaterial aggregation after hydrophobic ligand functionalization is responsible for reduced antibacterial activity. Because the decreased hydrophobic functionality also reduces the cellular and hemolytic toxicity, it is therefore suitable for in vivo applications. A similar trend was also observed during in vivo wound healing applications. Overall, these findings will elucidate the most optimal accessibility for SQDs and promote further designs of functionalized nano-antibiotics.
Author contributions
Avijit Mondal conducted all the experiments, synthesis, and characterizations. Subrata Pandit assisted in synthesizing SQDs, while Jagabandhu Sahoo and Yogeswari Subramaniam contributed to the histopathological analysis.Conflicts of interest
The authors declare no competing financial interests.Acknowledgements
The authors would like to thank DST-SERB (CRG/2020/001197) for financial support. The authors would also like to thank DST-FIST (SR/FST/CSII-040/2015) for the infrastructural setup to execute this work. Avijit Mondal and Subrata Pandit thank IISc for their doctoral fellowships. Jagabandhu Sahoo would like to thank CSIR for the doctoral fellowship.References
- J. Owen and L. Brus, J. Am. Chem. Soc., 2017, 139, 10939–10943 CrossRef CAS PubMed.
- M. A. Cotta, ACS Appl. Nano Mater., 2020, 3, 4920–4924 CrossRef CAS.
- B. D. Chernomordik, A. R. Marshall, G. F. Pach, J. M. Luther and M. C. Beard, Chem. Mater., 2017, 29, 189–198 CrossRef CAS.
- G. Zaiats, S. Ikeda, S. Kinge and P. V. Kamat, ACS Appl. Mater. Interfaces, 2017, 9, 30741–30745 CrossRef CAS PubMed.
- A. Mondal and M. De, ACS Appl. Nano Mater., 2021, 4, 13947–13954 CrossRef CAS.
- S. Pandit, S. Mondal and M. De, J. Mater. Chem. B, 2021, 9, 1432–1440 RSC.
- R. Hardman, Environ. Health Perspect., 2006, 114, 165–172 CrossRef PubMed.
- W. T. Al-Jamal and K. Kostarelos, in Encyclopedia of Nanotechnology, ed. B. Bhushan, Springer Netherlands, Dordrecht, 2012, pp. 2197–2200, DOI:10.1007/978-90-481-9751-4_179.
- K. M. Tsoi, Q. Dai, B. A. Alman and W. C. W. Chan, Acc. Chem. Res., 2013, 46, 662–671 CrossRef CAS PubMed.
- J. Liu, R. Li and B. Yang, ACS Cent. Sci., 2020, 6, 2179–2195 CrossRef CAS PubMed.
- H. Zhang, G. Wang, Z. Zhang, J. H. Lei, T.-M. Liu, G. Xing, C.-X. Deng, Z. Tang and S. Qu, Light: Sci. Appl., 2022, 11, 113 CrossRef CAS PubMed.
- S. Y. Lim, W. Shen and Z. Gao, Chem. Soc. Rev., 2015, 44, 362–381 RSC.
- J. Wu, J. Dai, Y. Shao and Y. Sun, RSC Adv., 2015, 5, 83581–83587 RSC.
- S. Chinnathambi, S. Chen, S. Ganesan and N. Hanagata, Adv. Healthcare Mater., 2014, 3, 10–29 CrossRef CAS PubMed.
- D. Roy, K. Majhi, M. K. Mondal, S. K. Saha, S. Sinha and P. Chowdhury, ACS Omega, 2018, 3, 7613–7620 CrossRef CAS PubMed.
- G. Hu, Y. Sun, Y. Xie, S. Wu, X. Zhang, J. Zhuang, C. Hu, B. Lei and Y. Liu, ACS Appl. Mater. Interfaces, 2019, 11, 6634–6643 CrossRef CAS PubMed.
- M. C. Biswas, M. T. Islam, P. K. Nandy and M. M. Hossain, ACS Mater. Lett., 2021, 3, 889–911 CrossRef CAS.
- S. Pandit, P. Behera, J. Sahoo and M. De, ACS Appl. Bio Mater., 2019, 2, 3393–3403 CrossRef CAS PubMed.
- C. Auría-Soro, T. Nesma, P. Juanes-Velasco, A. Landeira-Viñuela, H. Fidalgo-Gomez, V. Acebes-Fernandez, R. Gongora, M. J. Almendral Parra, R. Manzano-Roman and M. Fuentes, Nanomaterials, 2019, 9, 1365 CrossRef PubMed.
- C. J. Murphy, A. M. Vartanian, F. M. Geiger, R. J. Hamers, J. Pedersen, Q. Cui, C. L. Haynes, E. E. Carlson, R. Hernandez, R. D. Klaper, G. Orr and Z. Rosenzweig, ACS Cent. Sci., 2015, 1, 117–123 CrossRef CAS PubMed.
- H. Zhao, Y. Wang, L. Bao and C. Chen, Acc. Mater. Res., 2022, 3, 812–829 CrossRef CAS.
- R. Mout, D. F. Moyano, S. Rana and V. M. Rotello, Chem. Soc. Rev., 2012, 41, 2539–2544 RSC.
- P. Zrazhevskiy, M. Sena and X. Gao, Chem. Soc. Rev., 2010, 39, 4326–4354 RSC.
- R. A. T. Cruz, A. N. Soriano, P. A. N. de Yro, G. M. O. Quiachon, C. S. Emolaga, M. L. M. Ysulat, U. G. Bigol and B. A. Basilia, IOP Conf. Ser.: Mater. Sci. Eng., 2019, 559, 012003 CAS.
- Y. Wang, Z. Yin, Z. Xie, X. Zhao, C. Zhou, S. Zhou and P. Chen, ACS Appl. Mater. Interfaces, 2016, 8, 9961–9968 CrossRef CAS PubMed.
- H. Liu, Q. Chen, J. Hou, G. Yang and W. Feng, ChemistrySelect, 2022, 7, e202202223 CrossRef CAS.
- F. Yang, G. E. LeCroy, P. Wang, W. Liang, J. Chen, K. A. S. Fernando, C. E. Bunker, H. Qian and Y.-P. Sun, J. Phys. Chem. C, 2016, 120, 25604–25611 CrossRef CAS.
- L. Li, Y. Li, Y. Ye, R. Guo, A. Wang, G. Zou, H. Hou and X. Ji, ACS Nano, 2021, 15, 6872–6885 CrossRef CAS PubMed.
- Z. Qian, J. Ma, X. Shan, L. Shao, J. Zhou, J. Chen and H. Feng, RSC Adv., 2013, 3, 14571–14579 RSC.
- H.-H. Cho, H. Yang, D. J. Kang and B. J. Kim, ACS Appl. Mater. Interfaces, 2015, 7, 8615–8621 CrossRef CAS PubMed.
- G. H. Woehrle, L. O. Brown and J. E. Hutchison, J. Am. Chem. Soc., 2005, 127, 2172–2183 CrossRef CAS PubMed.
- X. Zhang, M. R. Servos and J. Liu, J. Am. Chem. Soc., 2012, 134, 7266–7269 CrossRef CAS PubMed.
- C.-C. You, M. De, G. Han and V. M. Rotello, J. Am. Chem. Soc., 2005, 127, 12873–12881 CrossRef CAS PubMed.
- S. B. van der Meer, T. Seiler, C. Buchmann, G. Partalidou, S. Boden, K. Loza, M. Heggen, J. Linders, O. Prymak, C. L. P. Oliveira, L. Hartmann and M. Epple, Chem. – Eur. J., 2021, 27, 1451–1464 CrossRef CAS PubMed.
- S. S. Chou, M. De, J. Kim, S. Byun, C. Dykstra, J. Yu, J. Huang and V. P. Dravid, J. Am. Chem. Soc., 2013, 135, 4584–4587 CrossRef CAS PubMed.
- S. Karunakaran, S. Pandit, B. Basu and M. De, J. Am. Chem. Soc., 2018, 140, 12634–12644 CrossRef CAS PubMed.
- P. Behera, K. Kumar Singh, D. Kumar Saini and M. De, Chem. – Eur. J., 2022, 28, e202201386 CrossRef CAS PubMed.
- J. Sahoo and M. De, J. Mater. Chem. B, 2022, 10, 4588–4594 RSC.
- L. Shen, H. Wang, S. Liu, Z. Bai, S. Zhang, X. Zhang and C. Zhang, J. Am. Chem. Soc., 2018, 140, 7878–7884 CrossRef CAS PubMed.
- J. Ren, L. Malfatti, L. Stagi, D. Carboni, R. Anedda, L. Calvillo and P. Innocenzi, Chem. Mater., 2022, 34, 8456–8468 CrossRef CAS.
- Y. Song, J. Tan, G. Wang, P. Gao, J. Lei and L. Zhou, Chem. Sci., 2020, 11, 772–777 RSC.
- S. Li, D. Chen, F. Zheng, H. Zhou, S. Jiang and Y. Wu, Adv. Funct. Mater., 2014, 24, 7133–7138 CrossRef CAS.
- H. Wang, Z. Wang, Y. Xiong, S. V. Kershaw, T. Li, Y. Wang, Y. Zhai and A. L. Rogach, Angew. Chem., Int. Ed., 2019, 58, 7040–7044 CrossRef CAS PubMed.
- F. Arshad, M. P. Sk, S. K. Maurya and H. R. Siddique, ACS Appl. Nano Mater., 2021, 4, 3339–3344 CrossRef CAS.
- W. Lu, Z. Wei, W. Guo, C. Yan, Z. Ding, C. Wang, G. Huang and V. M. Rotello, Small, 2023, 2301095 CrossRef CAS PubMed.
- Y. Wang, Y. Zhao, J. Wu, M. Li, J. Tan, W. Fu, H. Tang and P. Zhang, Nano Lett., 2021, 21, 9433–9441 CrossRef CAS PubMed.
- C. L. Ventola, P. T., 2015, 40, 277–283 Search PubMed.
- C. T. Walsh and G. Wright, Chem. Rev., 2005, 105, 391–394 CrossRef CAS PubMed.
- N. Woodford and M. J. Ellington, Clin. Microbiol. Infect., 2007, 13, 5–18 CrossRef CAS PubMed.
- J. M. V. Makabenta, A. Nabawy, C.-H. Li, S. Schmidt-Malan, R. Patel and V. M. Rotello, Nat. Rev. Microbiol., 2021, 19, 23–36 CrossRef CAS PubMed.
- Z. L. Shaw, S. Kuriakose, S. Cheeseman, M. D. Dickey, J. Genzer, A. J. Christofferson, R. J. Crawford, C. F. McConville, J. Chapman, V. K. Truong, A. Elbourne and S. Walia, Nat. Commun., 2021, 12, 3897 CrossRef CAS PubMed.
- X.-L. Hu, Y. Shang, K.-C. Yan, A. C. Sedgwick, H.-Q. Gan, G.-R. Chen, X.-P. He, T. D. James and D. Chen, J. Mater. Chem. B, 2021, 9, 3640–3661 RSC.
- J. Ndayishimiye, T. Kumeria, A. Popat, J. R. Falconer and M. A. T. Blaskovich, ACS Infect. Dis., 2022, 8, 693–712 CrossRef CAS PubMed.
- X. Li, S. M. Robinson, A. Gupta, K. Saha, Z. Jiang, D. F. Moyano, A. Sahar, M. A. Riley and V. M. Rotello, ACS Nano, 2014, 8, 10682–10686 CrossRef CAS PubMed.
- S. Pandit, S. Karunakaran, S. K. Boda, B. Basu and M. De, ACS Appl. Mater. Interfaces, 2016, 8, 31567–31573 CrossRef CAS PubMed.
- E. R. Caudill, R. T. Hernandez, K. P. Johnson, J. T. O'Rourke, L. Zhu, C. L. Haynes, Z. V. Feng and J. A. Pedersen, Chem. Sci., 2020, 11, 4106–4118 RSC.
- Z.-e. Huma, A. Gupta, I. Javed, R. Das, S. Z. Hussain, S. Mumtaz, I. Hussain and V. M. Rotello, ACS Omega, 2018, 3, 16721–16727 CrossRef CAS PubMed.
- A. Panigrahi, V. N. Are, S. Jain, D. Nayak, S. Giri and T. K. Sarma, ACS Appl. Mater. Interfaces, 2020, 12, 5389–5402 CrossRef CAS PubMed.
- J. Li, W. Sun, Z. Yang, G. Gao, H.-H. Ran, K.-F. Xu, Q.-Y. Duan, X. Liu and F.-G. Wu, ACS Appl. Mater. Interfaces, 2020, 12, 54378–54386 CrossRef CAS PubMed.
- Y. Zhang, N. V. Hudson-Smith, S. D. Frand, M. S. Cahill, L. S. Davis, Z. V. Feng, C. L. Haynes and R. J. Hamers, J. Am. Chem. Soc., 2020, 142, 10814–10823 CrossRef CAS PubMed.
- T. J. Silhavy, D. Kahne and S. Walker, Cold Spring Harbor Perspect. Biol., 2010, 2, a000414 Search PubMed.
- Y. Jiang, W. Zheng, K. Tran, E. Kamilar, J. Bariwal, H. Ma and H. Liang, Nat. Commun., 2022, 13, 197 CrossRef CAS PubMed.
- S. C. Hayden, G. Zhao, K. Saha, R. L. Phillips, X. Li, O. R. Miranda, V. M. Rotello, M. A. El-Sayed, I. Schmidt-Krey and U. H. F. Bunz, J. Am. Chem. Soc., 2012, 134, 6920–6923 CrossRef CAS PubMed.
- D. P. Linklater, V. A. Baulin, X. Le Guével, J.-B. Fleury, E. Hanssen, T. H. P. Nguyen, S. Juodkazis, G. Bryant, R. J. Crawford, P. Stoodley and E. P. Ivanova, Adv. Mater., 2020, 32, 2005679 CrossRef PubMed.
- K. Chen, Y. Liu, Y. Hu, M. Yuan, X. Zheng and X. Huang, J. Appl. Polym. Sci., 2020, 137, 48937 CrossRef CAS.
- V. Kandjou, A. M. Perez-Mas, B. Acevedo, M. Hernaez, A. G. Mayes and S. Melendi-Espina, J. Hazard. Mater., 2019, 380, 120840 CrossRef CAS PubMed.
- R. Dedryvère, S. Leroy, H. Martinez, F. Blanchard, D. Lemordant and D. Gonbeau, J. Phys. Chem. B, 2006, 110, 12986–12992 CrossRef PubMed.
- T. Gao, S. Hou, K. Huynh, F. Wang, N. Eidson, X. Fan, F. Han, C. Luo, M. Mao, X. Li and C. Wang, ACS Appl. Mater. Interfaces, 2018, 10, 14767–14776 CrossRef CAS PubMed.
- H. Harker and P. M. A. Sherwood, Philos. Mag., 1973, 27, 1241–1244 CrossRef CAS.
- Q. Zou and Y.-C. Lu, J. Phys. Chem. Lett., 2016, 7, 1518–1525 CrossRef CAS PubMed.
- L. Shen, J. Wei, Z. Liu, Z. Bai, Y. Li, D. Zhang and C. Zhang, Chem. Mater., 2020, 32, 10476–10481 CrossRef CAS.
- A. Mukherjee, R. Barman, B. Das and S. Ghosh, Chem. Mater., 2021, 33, 8656–8665 CrossRef CAS.
- S. Liu, T. H. Zeng, M. Hofmann, E. Burcombe, J. Wei, R. Jiang, J. Kong and Y. Chen, ACS Nano, 2011, 5, 6971–6980 CrossRef CAS PubMed.
- R. F. Epand, J. E. Pollard, J. O. Wright, P. B. Savage and R. M. Epand, Antimicrob. Agents Chemother., 2010, 54, 3708–3713 CrossRef CAS PubMed.
- J. Wang, S. Chou, L. Xu, X. Zhu, N. Dong, A. Shan and Z. Chen, Sci. Rep., 2015, 5, 15963 CrossRef CAS PubMed.
- J. Tan, Y. Zhao, J. L. Hedrick and Y. Y. Yang, Adv. Healthcare Mater., 2022, 11, 2100482 CrossRef CAS PubMed.
- I. Monga, Brief. Funct. Genom., 2022, 21, 159–176 CrossRef CAS PubMed.
- R. Heir and D. Stellwagen, Front. Cell. Neurosci., 2020, 14, 565841 CrossRef CAS PubMed.
- P. Gough and I. A. Myles, Front. Immunol., 2020, 11, 585880 CrossRef CAS PubMed.
- Z.-Q. Lin, T. Kondo, Y. Ishida, T. Takayasu and N. Mukaida, J. Leukocyte Biol., 2003, 73, 713–721 CrossRef CAS PubMed.
- T. Kishimoto, Blood, 1989, 74, 1–10 CrossRef CAS PubMed.
Footnote |
| † Electronic supplementary information (ESI) available: Synthesis procedures and characterization of ligands. Methods describing the preparation of SQDs, functionalization of SQDs, determination of MIC and MBC, estimation of oxidative stress generated by functionalized SQDs, estimation of membrane depolarization affinity of functionalized SQDs, live/dead assay using fluorescence microscopy, haemolysis assay, cytotoxicity assay, SEM sample preparation, TEM sample preparation for bacterial imaging, in vivo antibacterial study. Results containing UV-Vis spectra of functionalized SQDs, antibacterial activity of functionalized SQDs against E. faecalis and E. coli, zeta potential and fluorescence spectra of C6@SQDs and C8@SQDs, antibacterial efficacy of C6@SQDs and C8@SQDs against E. faecalis, PA, and E. coli, hydrodynamic diameter (Dh) of functionalized SQDs, TEM image of MRSA bacteria treated with functionalized SQDs, photograph of agar plates during the in vivo experiment, and biochemical parameters of the infected mice on the 10th day. See DOI: https://doi.org/10.1039/d3nr04287a |
| This journal is © The Royal Society of Chemistry 2023 |