An attempt to consider cooperativity in helical-sense preferences induced in fused macrocycles†
Received
3rd February 2023
, Accepted 23rd February 2023
First published on 23rd February 2023
Abstract
We synthesized bis and tris(macrocycle)s in which a two- or three-fold macrocycle was fused and each adopted twisted forms with M- or P-helicity. According to the sense of twisting in each element, diverse conformations can be generated in a molecule. We present two types of conformational preferences. One is the innate preference for a helical form with an identical sense of twisting throughout the entire molecule. The other is the helical-sense preference for a particular sense of twisting. We were interested in the relationship between Kn and (K1)n, where Kn is an equilibrium constant for the conformational interconversion between two helical forms (MM and PP, MMM and PPP) and n is the number of elements, since we considered that the relationship could be a metric to see the interinfluence among these macrocyclic elements in a single molecule. Through VT measurements in 1H NMR and CD spectroscopy, we attempted to quantify the helical-sense preferences induced in the fused macrocycles (n = 2 and 3) to compare Kn and (K1)n.
Introduction
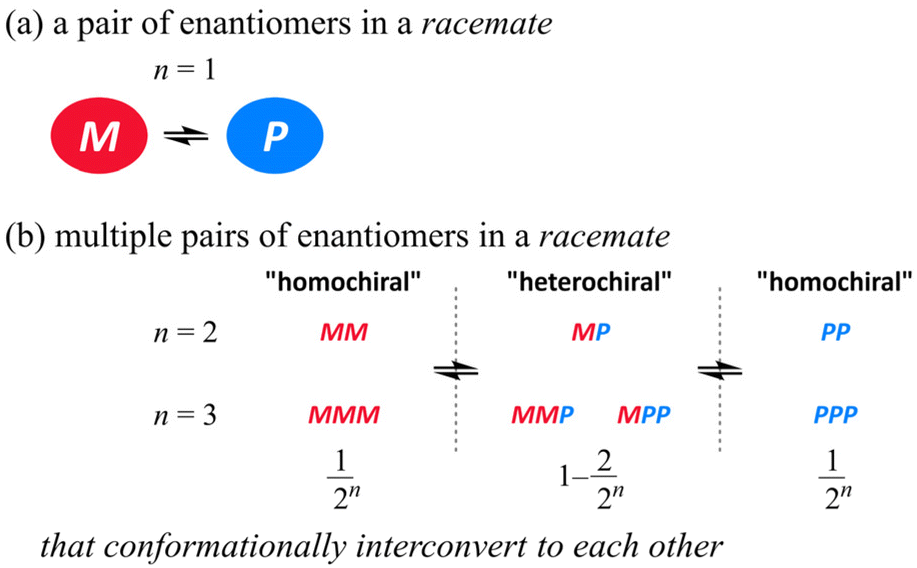
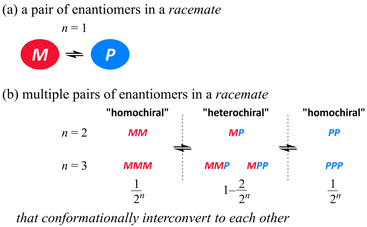
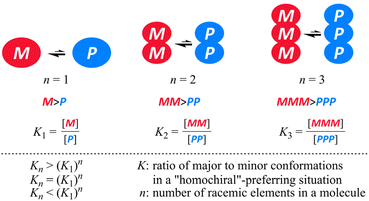
The pair of enantiomers in a racemate that conformationally interconvert with each other have the ability to change the ratio of enantiomers according to circumstances.1 When several such racemic elements are assembled into a single molecule,2 diverse conformations can be generated according to the chiral sense in each element (Scheme 1). These conformers with an identical or different sense of chirality would be statistically populated in solution if each element has no preference for a particular sense. Since there are always two forms where all elements prefer the same sense throughout the entire molecule (for descriptive purposes we term this a “homochiral” situation in a molecule), the populations of the homochiral conformers decrease with an increase in the number of elements (n). If the molecule is designed to reduce the chance to adopt “heterochiral” conformation(s) where different senses of chirality coexist in a molecule,3 we could consider the ratio of enantiomers (MM and PP, MMM and PPP etc.) of a molecule with several elements as like a simple case of M and P (n = 1) (Scheme 2).
 |
| | Scheme 1 (a) Conformational interconversion between enantiomers in a racemate and (b) conformational diversity in a molecule with multiple pairs of enantiomers in a racemate. | |
 |
| | Scheme 2 Types of relationships between Kn and (K1)n. | |
When an imbalance in the populations with M- or P-helicity is induced in the monomeric element (n = 1) through some transmission of chirality, Kn would increase with an increase in the number of elements and be equal to (K1)n, where K1 is defined as the ratio of the major to minor conformation (K1 > 1). Alternatively, Kn might be smaller or larger than (K1)n as a result of some perturbation. We were interested in the relationship between Kn and (K1)n, since the relationship would be a metric to see the interinfluence between elements in a molecule. A conformational search would be valid to explore candidate molecules that could energetically disfavor heterochiral conformations. NMR spectroscopy would be an effective tool for estimating a ratio of diastereomers,4 though there could be a limit to integrate precisely both major and minor peaks, especially for a case where the ratio could be greatly biased to prefer a particular form. Since uncertainty based on integration could not be excluded absolutely, we proposed that measurements could be implemented at several temperatures to obtain a linear extrapolation such as a least-squares estimation. The barrier for interconversion between two enantiomeric or diastereomeric forms should be imposed moderately to observe both major and minor peaks within an NMR timescale. It is also important for these two peaks to stand separately for better integration.
In consideration of these requisites, we used macrocycle 1 (n = 1),5 which can adopt chiral forms with M- or P-helicity by twisting; these diastereomeric (a: X = 1-cyclohexylethyl) or enantiomeric (b: X = butyl) forms are conformationally interconvertible (Fig. 1). The imbalance in the populations of twisted forms with M- or P-helicity could be realized by transmission of internal (a) and external (b) chirality.6 Thus, we designed bis and tris(macrocycle)s 2 (n = 2)7 and 3 (n = 3) (Fig. 1), where two or three macrocyclic elements were assembled by fusion of 1. Here we demonstrate that there was an innate preference for the homochiral forms over heterochiral forms in 2 and 3 by using the MacroModel software and by observing two sets of resonances assigned to two diastereomeric forms with M- or P-helicity in the NMR spectra measured at low temperatures. Once a ratio was estimated by NMR spectroscopy, we could see a ratio at different temperatures from the intensity of the Cotton effects in CD spectroscopy, since the intensity is related to enantiomeric or diastereomeric excess (ee or de = Kn − 1/Kn + 1, where Kn is experimentally estimated as the ratio of major to minor conformations). Based on this, we explored a diastereomeric ratio induced in a complexed state by CD spectroscopy. The details of synthesis and attempts to compare K1 and (K1)n through intramolecular or intermolecular transmission of chirality are described below.
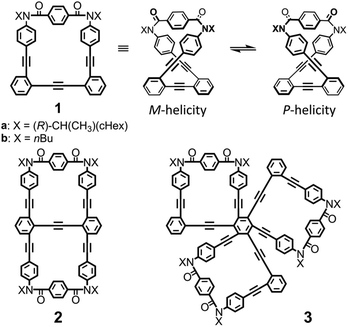 |
| | Fig. 1 Chemical structures of monomeric macrocycle 1, bis(macrocycle) 2 and tris(macrocycle) 3. | |
Results and discussion
Conformational searches
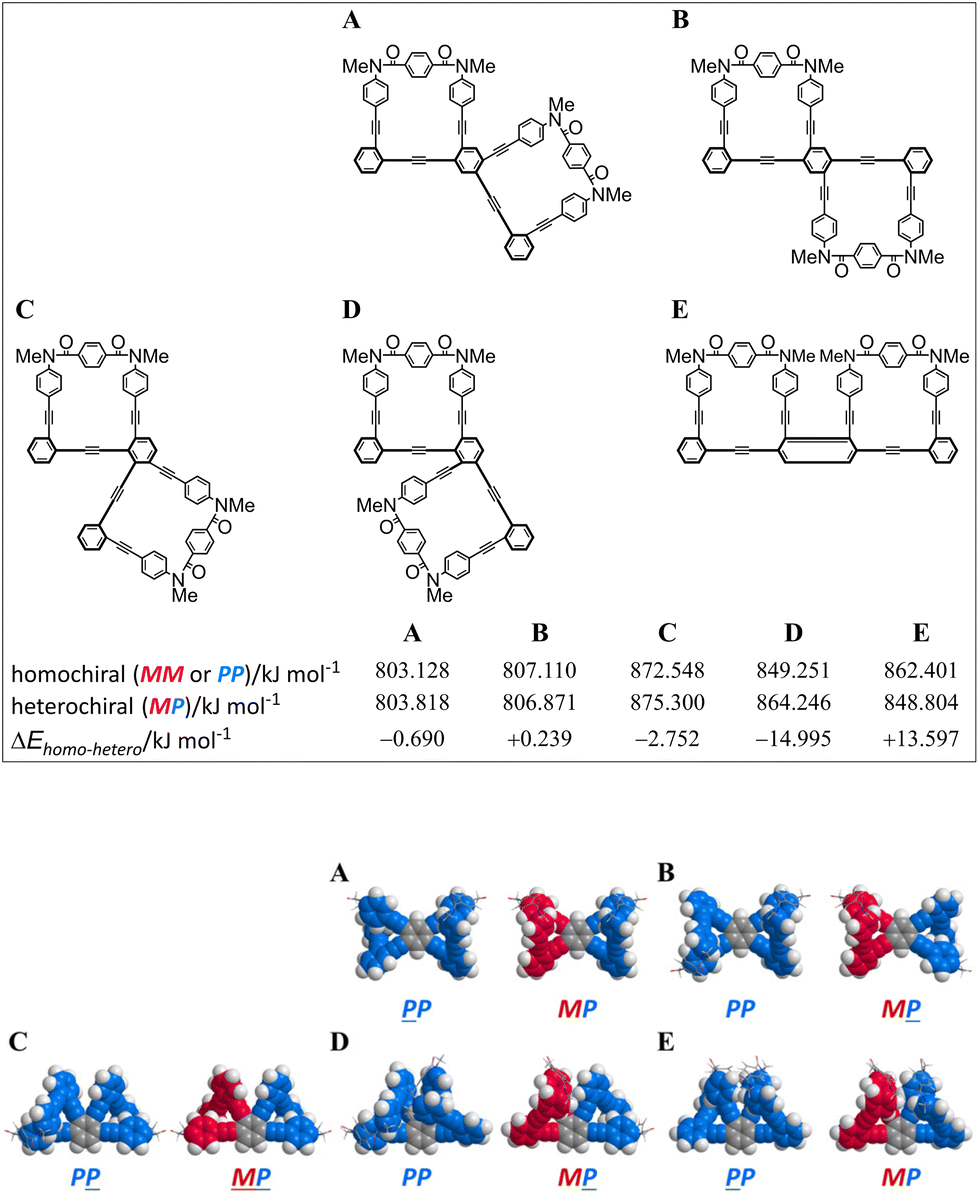
First, we investigated whether or not an innate preference for a homochiral form could be induced according to the arrangement of a two-fold macrocycle by using conformational searches with model bis(macrocycle)s A–E (Fig. 2). As the substituent group on the nitrogen, we used a methyl group, which has no preference for any sense of twisting. We assumed that no preference would be generated when there was no difference in the conformation energy between homochiral and heterochiral forms (ΔEhomo–hetero). In such a molecule, each macrocyclic element would be independent of the helical sense in a neighboring macrocycle. Alternatively, a difference in the conformation energy would be considered to be a result of the influence of either element in establishing its own sense according to the sense of a neighboring macrocycle. The results showed that the difference was small for A and B, which were based on 1,2,4,5-tetrakis(phenylethynyl)benzene (TPEB), while relatively large differences were predicted for C, D and E,8 which were based on 1,2,3,4-TPEB. Especially for D, the difference was significant and we expected that either macrocycle could prefer the same sense as that of the neighboring macrocycle, which is a substructure of the tris(macrocycle) 3. Next, we implemented a similar search for a model tris(macrocycle) 3c (X = CH3). As expected, a homochiral form was found to be the most energy-minimized (Fig. 3).
 |
| | Fig. 2 Energy-minimized structures for model bis(macrocycle)s A–E: PP-A (rel. 0 kJ mmol−1) and MP-A (+0.690 kJ mol−1); PP-B (+0.239 kJ mol−1) and MP-B (rel. 0 kJ mol−1); PP-C (rel. 0 kJ mmol−1) and MP-C (+2.752 kJ mol−1); PP-D (rel. 0 kJ mol−1) and MP-D (+14.995 kJ mol−1); PP-E (+13.597 kJ mol−1) and MP-E (rel. 0 kJ mol−1), obtained by conformational searches using MacroModel software (v11.8 OPLS3e, MCMM, non-solvated). Space-filling representation for phenylene ethynylenes and stick representation for terephthaloyl bridges. An underlined code denotes the sense of the macrocycle located below the TPEB plane. | |
 |
| | Fig. 3 Energy-minimized structures for a model tris(macrocycle) 3c (X = CH3): (A) PPP (rel. 0 kJ mmol−1) and (B) MPP (+33.5 kJ mol−1), obtained by conformational searches using MacroModel software (v11.8 OPLS3e, first: MCMM to find two structures, and second: mixed tortional/low-mode sampling for each structure, non-solvated). Ball and stick representation for phenylene ethynylenes and stick representation for terephthaloyl bridges (side view: wire-frame or space-filling representation for phenylene ethynylenes and stick representation for terephthaloyl bridges). | |
Synthesis of tris(macrocycle)s 3
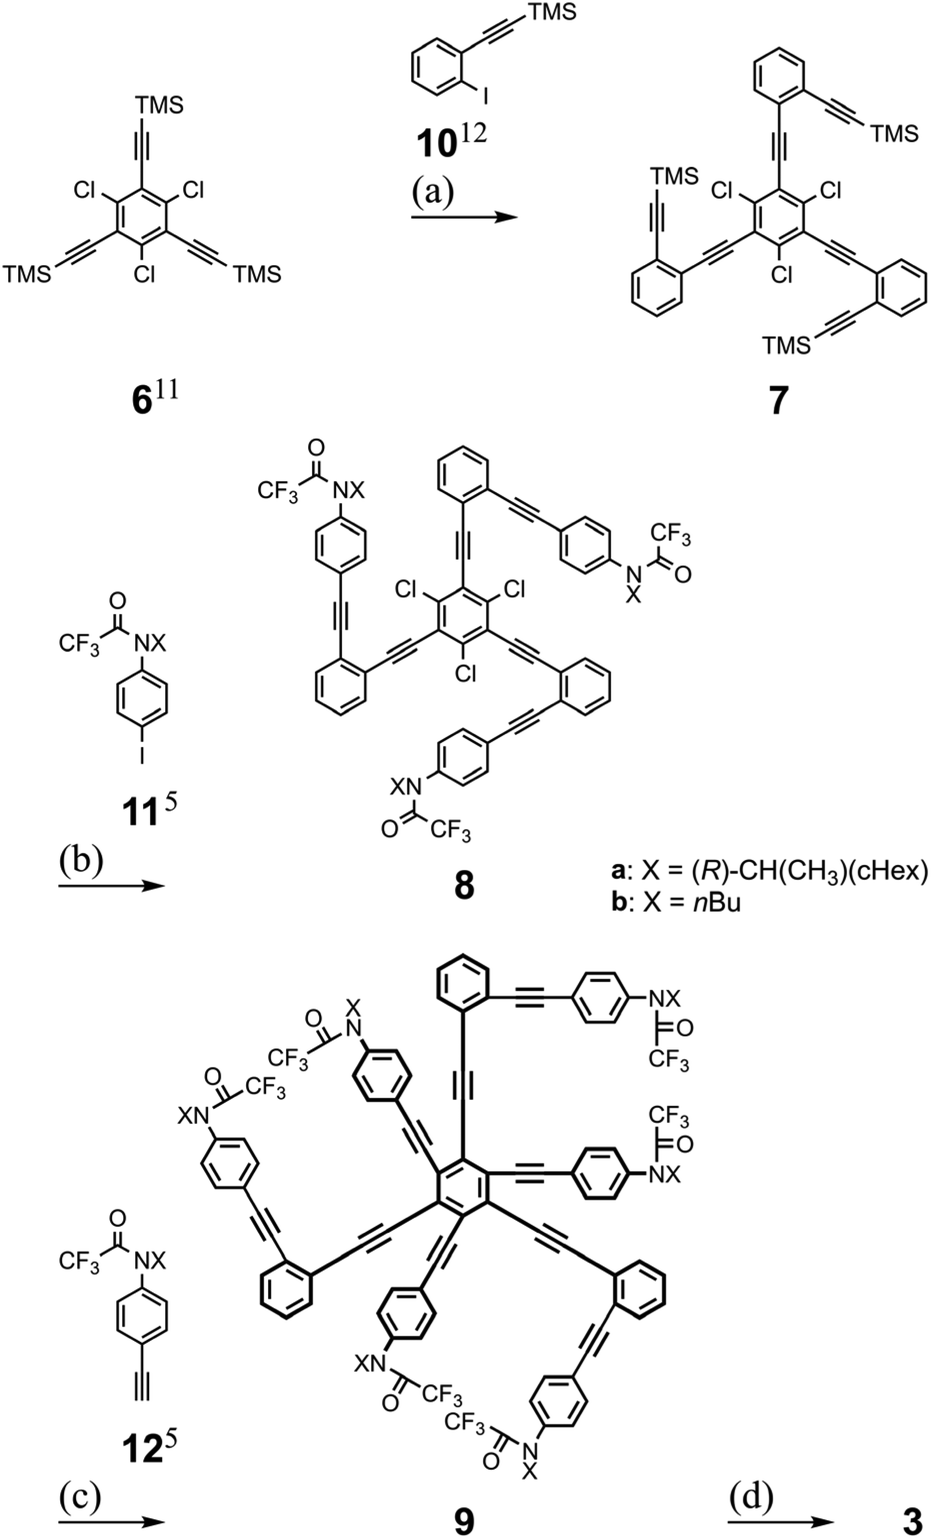
Tris(macrocycle)s 3 are 1,3,5-/2,4,6-differentiated hexakis(phenylethynyl)benzenes (HPEBs)10 and we started with 1,3,5-trichloro-2,4,6-tris(2-trimethylsilylethynyl)benzene 6.11 Stepwise Sonogashira coupling reactions of aryl iodides (10![[thin space (1/6-em)]](https://www.rsc.org/images/entities/char_2009.gif) 12 and 115) with desilylated acetylenes on 6 and on the resulting 7 gave trichloro-intermediates 8. The third Sonogashira coupling of aryl acetylenes (125) with the chlorides13 on 8 furnished HPEB 9, a threefold ring-closing precursor. Finally, the three macrocycles were accomplished by a threefold condensation reaction with terephthaloyl chloride (Scheme 3). According to the results of the conformational searches (Fig. 2), bis(macrocycle) D seemed to be a proper analyte. However, we rejected it due to the nonequivalency of 1,3-/2,4-differentiation on 1,2,3,4-TPEB, which was not suitable for 1H NMR analysis. Instead, we used bis(macrocycle)s 2 as analogs.
12 and 115) with desilylated acetylenes on 6 and on the resulting 7 gave trichloro-intermediates 8. The third Sonogashira coupling of aryl acetylenes (125) with the chlorides13 on 8 furnished HPEB 9, a threefold ring-closing precursor. Finally, the three macrocycles were accomplished by a threefold condensation reaction with terephthaloyl chloride (Scheme 3). According to the results of the conformational searches (Fig. 2), bis(macrocycle) D seemed to be a proper analyte. However, we rejected it due to the nonequivalency of 1,3-/2,4-differentiation on 1,2,3,4-TPEB, which was not suitable for 1H NMR analysis. Instead, we used bis(macrocycle)s 2 as analogs.
 |
| | Scheme 3 Synthesis of tris(macrocycle)s 3a and 3b. Reagents and yields: (a) (i) K2CO3, MeOH, THF (94%), (ii) 10,12 Pd(PPh3)4, CuI, THF, iPr2NH (54%); (b) 11a/b,5 Pd(PPh3)4, CuI, tetra-nbutylammonium fluoride (TBAF), THF, Et3N (85% for 8a and 83% for 8b); (c) 12a/b,5 PdCl2(CH3CN)2, X-Phos,13 dioxane, iPr2NH (63% for 9a and 69% for 9b); (d) (i) NaH, MeOH, THF (85% for 9a′ and 99% for 9b′), (ii) terephthaloyl chloride, Et3N, toluene (27% for 3a and 42% for 3b). | |
Estimation of Kn and (K1)n based on 1H NMR spectroscopy
In the 1H NMR spectra of 1, 2 and 3, measured at room temperature or above, the macrocycles were observed as single species (Fig. 4). Through VT-measurements, we demonstrated (i) a conformational preference for the homochiral form with the series of b compounds (Fig. S1†) and (ii) a conformational preference for either of the two homochiral forms with the series of a compounds (Fig. 5 and Fig. S2†).
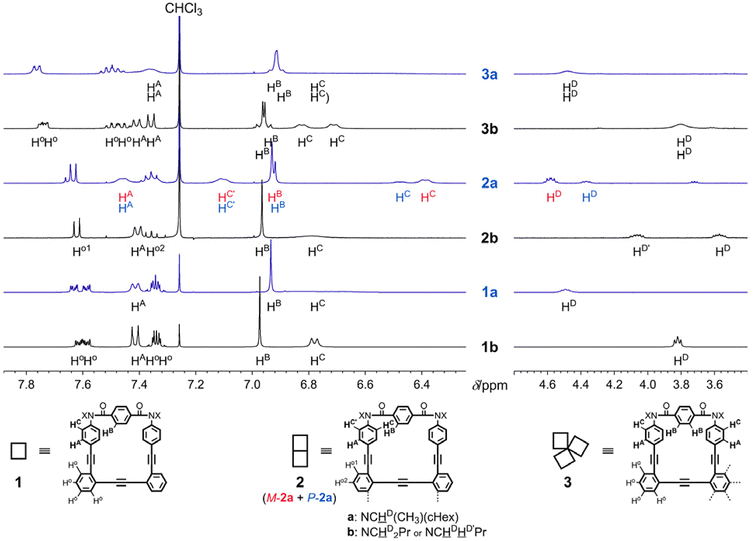 |
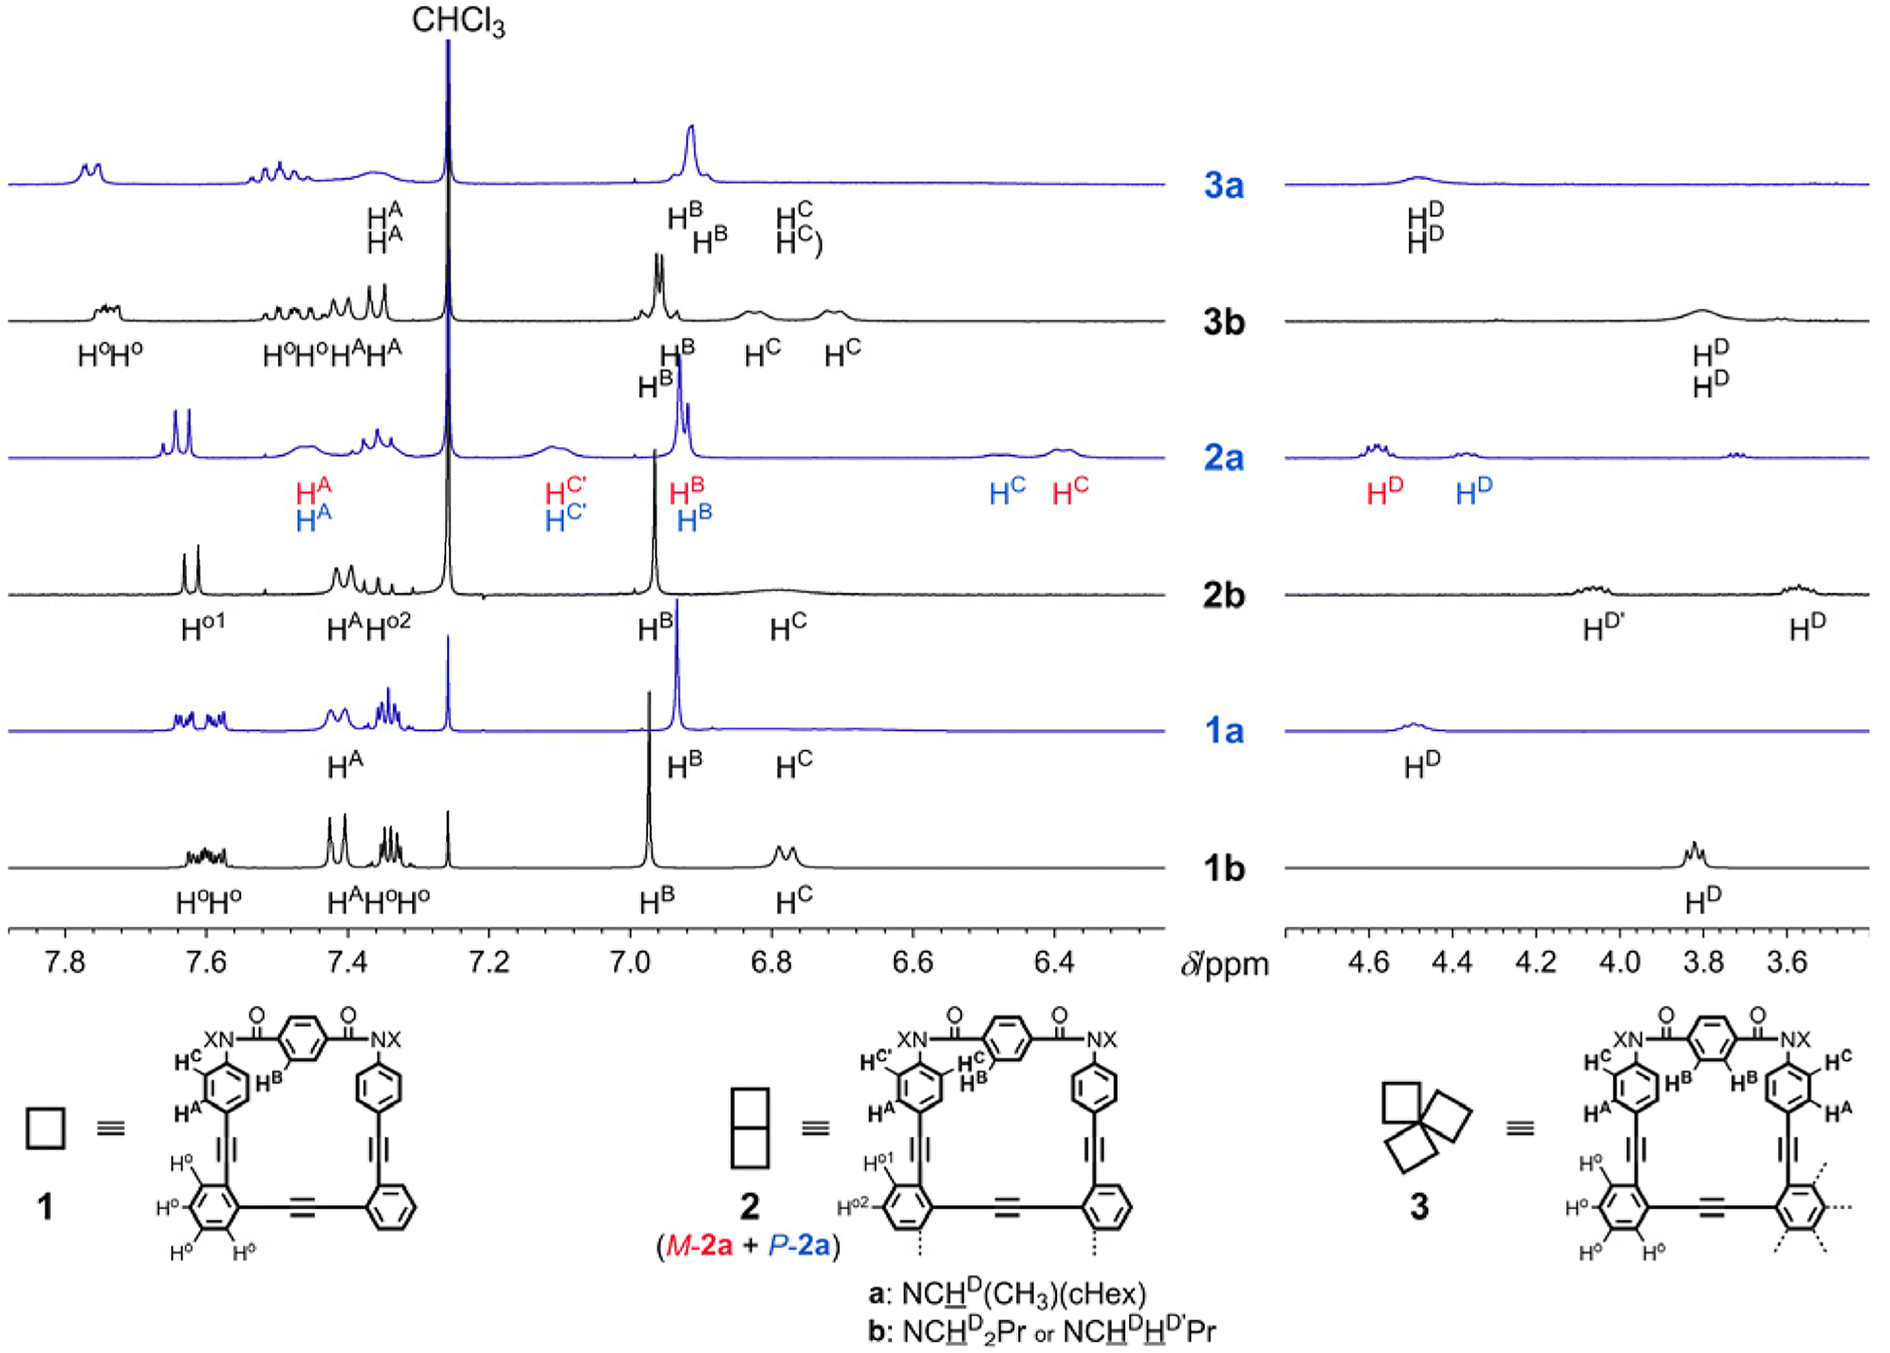
| | Fig. 4 Partial 1H NMR spectra [400 MHz; left: aromatic protons and right: methine (a) or methylene (b) protons] of 1a, 1b, 2a, 2b, 3a and 3b, measured in chloroform-d at room temperature. Nonequivalent protons (four Ho in 1, and four Ho and two HA, HB and HC in 3) were not assigned. | |
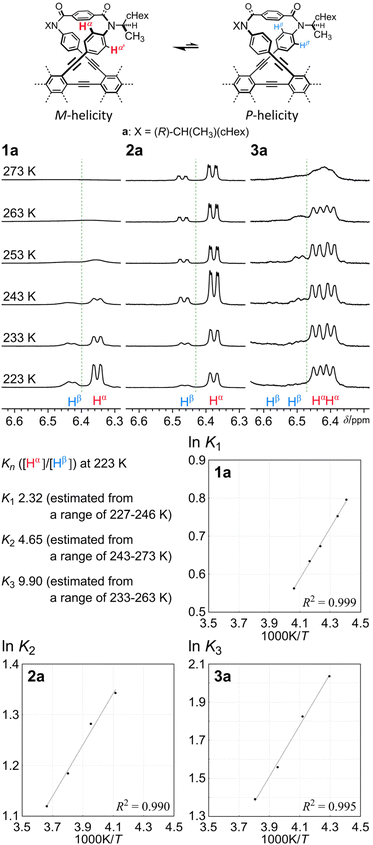 |
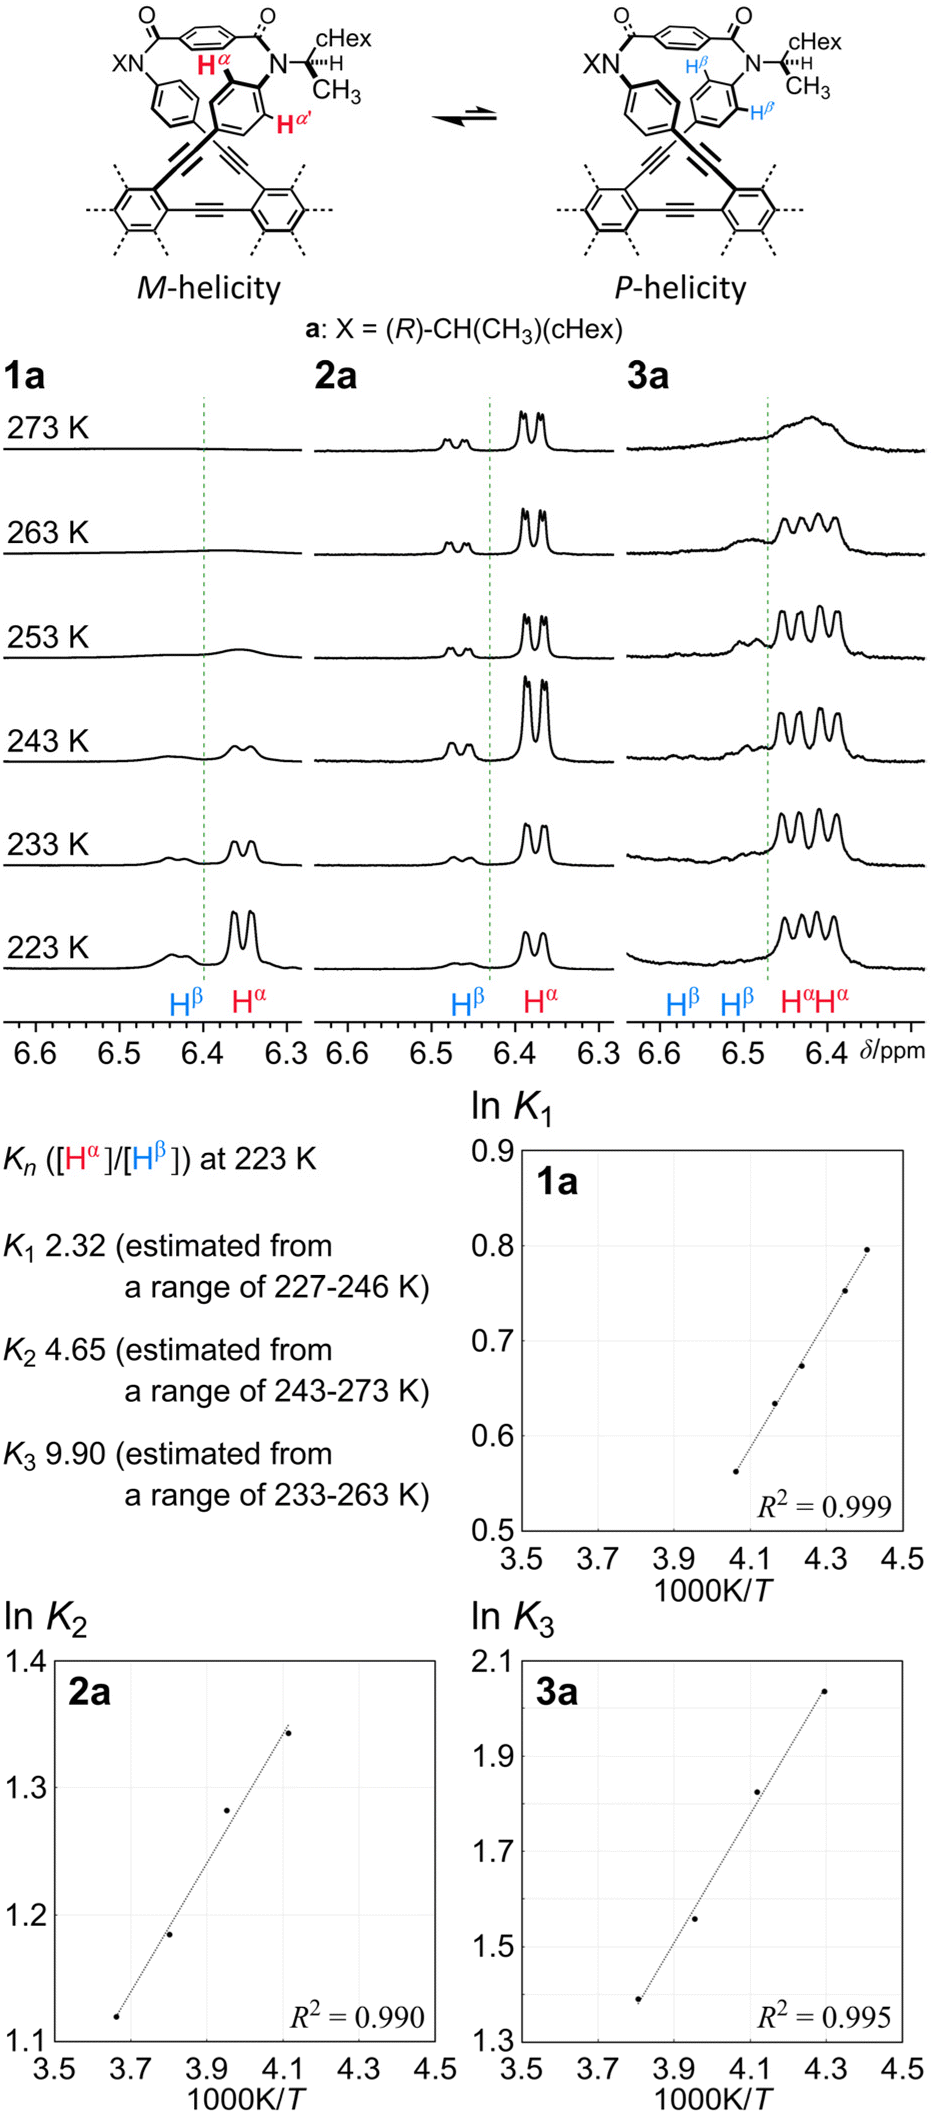
| | Fig. 5 Partial VT-1H NMR spectra (400 MHz) of 1a, 2a and 3a, measured in chloroform-d at 223–273 K, and plots of lnKnversus 1/T for the conformational interconversion between two diastereomeric forms with M- or P-helicity in a solution of 1a, 2a or 3a. Kn = [α (major)]/[β (minor)]. | |
In the VT-1H NMR spectra of 1b (X = nBu) (Fig. S1A†),5 measured at 223–323 K, there was no change in the chemical shift for p-phenylene protons (HA, HB and HC) throughout the entire range of temperature, although signals were broadened and split due to the slower rotation of p-phenylene rings than the NMR timescale at lower temperatures, since there was no form available other than an enantiomeric pair of twisted forms with M- or P-helicity. Also for 2b (Fig. S1B†),7 no change in the chemical shift was induced with a change in temperature, which showed that either of the two chiral forms (homochiral MM/PP and heterochiral MP) continued to exist alone in solution, and could not be assigned based solely on this measurement due to similarities in the patterns of averaged resonances for the homochiral and heterochiral conformations. For 3b (Fig. S1C†), only a slight change in the chemical shift was induced, which reflected a slight change in populations with different conformations. Ultimately, only a single set of resonances emerged in the spectrum measured at 223 K, which suggested that the dominant conformation could be assigned to the homochiral form of 3b based on the molecular symmetry.
The 1H NMR spectra of 1a,52a7 and 3a [X = (R)-CH(CH3)(cHex)], measured at low temperatures, showed that two diastereomeric forms with M- or P-helicity coexisted and the ratio of the major (α) to minor (β) conformations gradually increased with a decrease in temperature (Fig. 5 and Fig. S2†). During VT measurements, there were several coalescing processes. One was related to local interconversions through rotation of p-phenylene rings (HB, HA and HC), as seen for b. The other was attributed to the global interconversion between the two diastereomeric forms with M- or P-helicity. These processes were observed at different temperatures according to the difference in the chemical shifts between the two chemically exchanging protons. If we considered that the populations of the diastereomers with M- or P-helicity in the spectra of 2a were differentiated, either conformation of 2b that had existed alone throughout the entire range of temperature could also be assigned to the homochiral forms (MM and PP), since the differentiation cannot occur in the heterochiral form (MP) of 2. Based on the values of the integral for Hα and Hβ measured at several temperatures, we obtained a regression line and estimated the equilibrium constants at 223 K to be K1 = 2.3 (de 40%), K2 = 4.7 (65%) and K3 = 9.9 (82%). These values were not significantly different from squared (K1)2 and cubed (K1)3 values, calculated to be 5.4 (69%) and 13 (85%), respectively. These results might indicate that the original preference induced in 1a through the intramolecular transmission of point chirality (R) seemed almost intact or slightly attenuated in each macrocycle in 2a and 3a. The preferred sense was consistent,6 as shown by similarities in the chemical shift for Hα or Hβ in each solution of 1a, 2a and 3a.
Estimation of Kn and (K1)n based on CD spectroscopy
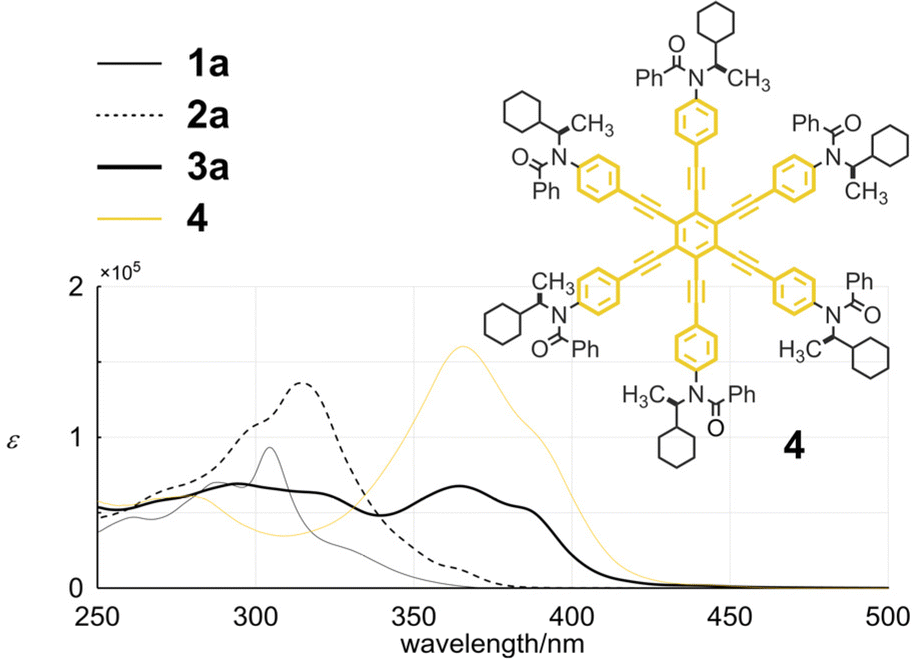
Tris(macrocycle) 3a showed two regions of absorption (Fig. 6). One was observed for the minimum chromophore of diphenylacetylene at 250–300 nm. The other was seen in a longer wavelength region, which was characteristic of HPEB.14 Regarding the absorption of HPEB, the intensity was significantly attenuated compared to that of an analogous HPEB 415 (3a: ε 6.77 × 10⁴ at 364.5 nm and 4: 1.60 × 10⁵ at 365.5 nm), which indicated that some dihedral angles of peripheral phenylene rings with respect to the central benzene ring of HPEB were perturbed in 3a. These spectral features were not altered in 3b by replacing the chiral auxiliary (R) with a butyl group on the nitrogen in the terephthaloyl bridge (Fig. S3†).
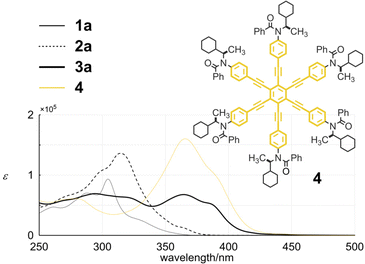 |
| | Fig. 6 UV spectra of 1a, 2a, 3a and 4, measured in dichloromethane at room temperature. | |
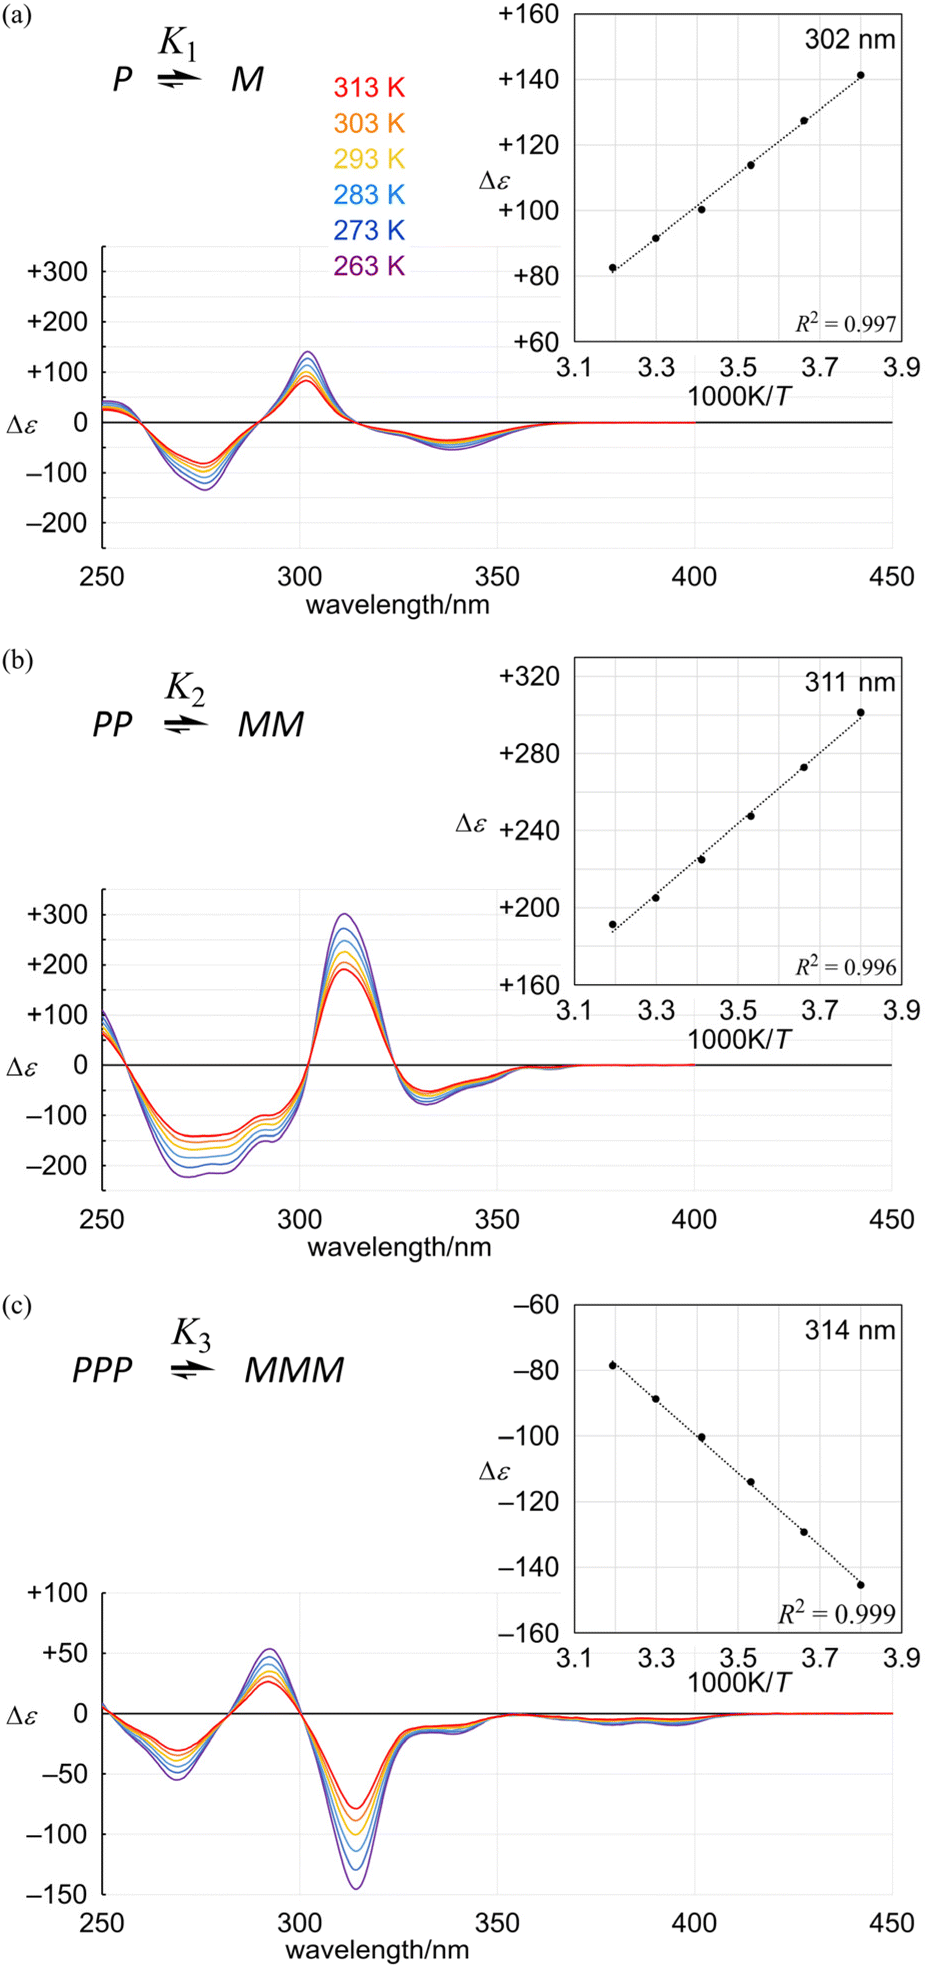
The spectral pattern of the Cotton effects in the shorter wavelength region (below 300 nm for 3a) was similar to those seen in the spectra of 1a5 and 2a,7 although each extreme (292 and 269 nm) was different from the corresponding extreme for 1a (302 and 276 nm) and 2a (311 and 273 nm) due to a difference in the effective conjugation length in each framework (Fig. 7).
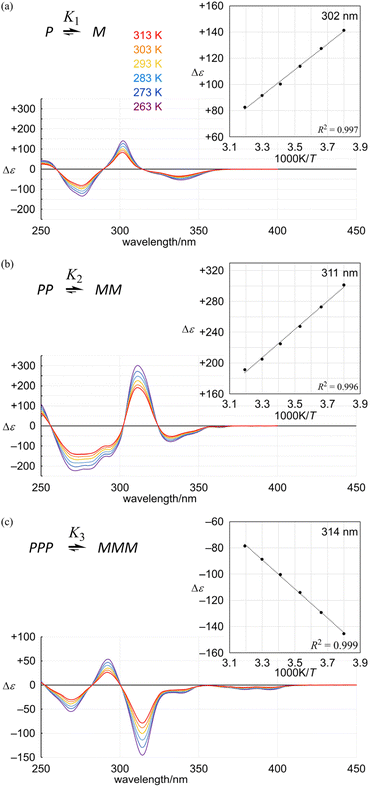 |
| | Fig. 7 VT-CD spectra of (a) 1a, (b) 2a and (c) 3a, measured in dichloromethane at 263–313 K. Inset: plots of Δε (at 302 nm for 1a, 311 nm for 2a and 314 nm for 3a) versus 1/T. | |
In the VT-CD spectra of 1a, 2a and 3a, measured at 263–313 K, the intensities of several Cotton effects changed with temperature, while the spectral appearance was maintained. The presence of several isosbestic points showed that only two conformers were involved in the equilibrium and the populations of these two conformers changed with temperature through interconversion in each solution. Plotting several values of Δε with the greatest intensity (302 nm for 1a, 311 nm for 2a and 314 nm for 3a) versus 1/T led to a linear relationship (Fig. 7, inset). Based on this relationship, we estimated the value of Δε at 223 K (Table 1). Since the equilibrium constant Kn at 223 K was estimated by NMR spectroscopy (Fig. 5), we calculated |Δεmax| to convert measured values of Δε at several temperatures to Kn (Table 1).16 The results indicated that Kn seemed to be comparable or smaller than (K1)n in either solution of 2a and 3a, similarly to the results obtained from NMR spectroscopy measured at low temperatures.
Table 1 Calculated values of Δε223 K, |Δεmax|, Kn and de, based on the results of VT-CD measurements for the conformational interconversion between two diastereomeric forms with M- or P-helicity in a solution of 1a, 2a or 3a, measured in dichloromethane at 263–313 K
|
1a
|
| Temperature |
Δε measured at 302 nm |
K
1
|
de |
| 313 K |
+82.61 |
1.38 |
16% |
| 303 K |
+91.59 |
1.43 |
18% |
| 293 K |
+100.3 |
1.48 |
19% |
| 283 K |
+113.9 |
1.56 |
22% |
| 273 K |
+127.5 |
1.65 |
24% |
| 263 K |
+141.3 |
1.74 |
27% |
| 223 K |
Δε223 K |
+207 |
2.32 (Hα/Hβ) |
40% |
| |Δεmax| |
521 |
|
2a
|
| Temperature |
Δε measured at 311 nm |
K
2
|
de |
(K1)2 |
de |
| 313 K |
+191.3 |
1.82 |
29% |
1.90 |
31% |
| 303 K |
+205.2 |
1.91 |
31% |
2.03 |
34% |
| 293 K |
+224.9 |
2.04 |
34% |
2.18 |
37% |
| 283 K |
+247.4 |
2.21 |
38% |
2.43 |
42% |
| 273 K |
+272.7 |
2.42 |
42% |
2.72 |
46% |
| 263 K |
+301.3 |
2.70 |
46% |
3.04 |
51% |
| 223 K |
Δε223 K |
+424 |
4.65 (Hα/Hβ) |
65% |
5.40 |
69% |
| |Δεmax| |
656 |
|
3a
|
| Temperature |
Δε measured at 314 nm |
K
3
|
de |
(K1)3 |
de |
| 313 K |
−78.56 |
1.82 |
29% |
2.61 |
45% |
| 303 K |
−88.67 |
1.98 |
33% |
2.90 |
49% |
| 293 K |
−100.3 |
2.18 |
37% |
3.22 |
53% |
| 283 K |
−114.0 |
2.46 |
42% |
3.79 |
58% |
| 273 K |
−129.3 |
2.84 |
48% |
4.47 |
63% |
| 263 K |
−145.5 |
3.34 |
54% |
5.31 |
68% |
| 223 K |
Δε223 K |
−220 |
9.90 (Hα/Hβ) |
82% |
12.5 |
85% |
| |Δεmax| |
270 |
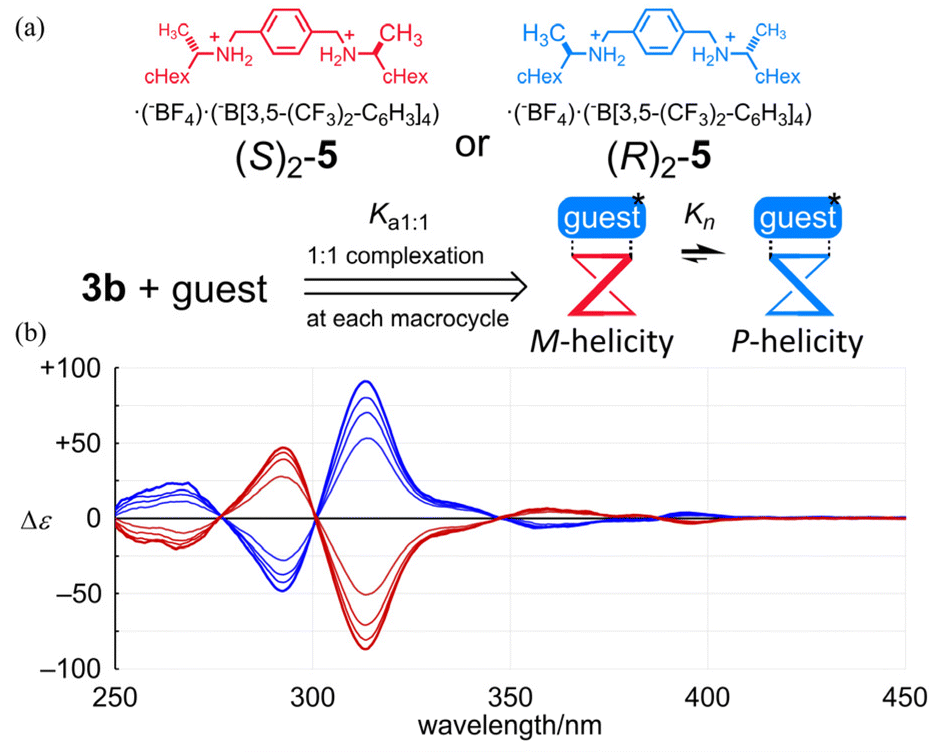
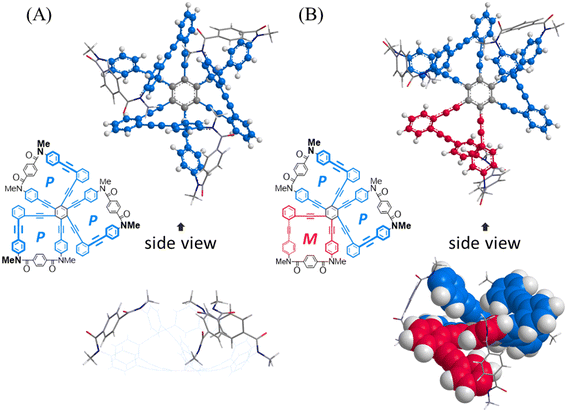
Next, we investigated whether or not a conformational preference for a particular sense of twisted forms with M- or P-helicity could be influenced in the bis and tris(macrocycle)s when chiral information was imposed externally. As an external chiral source, we used a chiral guest (S)2-5 or (R)2-5 (Fig. 8),5,7 since we have found that the guest molecule could form a 1:1 or 1:2 complex with 1b or 2b at the terephthaloyl bridge to control the twisting sense of each macrocycle. For 3b, first we examined the complexation with the guest by NMR spectroscopy (Fig. S4†). Based on complexation-induced changes in the chemical shifts on the addition of the guest, we confirmed that the guest (Ha, upfield shift) was captured at the terephthaloyl bridge (HB, upfield shift). The complexation ratio was estimated to be 1:2 (Job plots), measured in 3 vol% acetonitrile-d3/chloroform-d. Complexation-induced changes in the chemical shifts for aromatic protons (HA and HC) were smaller than that for HB, which was in the binding site and underwent an upfield shift due to the proximity of the guest. This result showed that there was almost no change in the populations of the conformers involved in the equilibrium before and after complexation. A similar consideration was supported by the UV spectra of 3b, measured in the absence or presence of the guest (Fig. S5†). There was almost no change in absorption in the shorter wavelength region on complexation, as in the complexation of 1b or 2b, while absorptions were slightly attenuated in the region regarding HPEB. A pair of mirrored Cotton effects were induced in the CD spectra of 3b in the presence of each chiral guest (Fig. 8). The spectral appearance of the complexation-induced Cotton effects remarkably resembled that of 3a, although there was a slight difference in profile in the absorption region of HPEB. Since the association constant Ka1:1 could be different in each solution,17Kn induced in a complexed state should be compared as an imaginary ratio when all of the molecules of the host were assumed to be in a complexed state. We performed titration experiments based on plots of complexation-induced molar CDs (Δε) at an extreme wavelength (301 nm for 1b, 310 nm for 2b and 313.5 nm for 3b) versus the equivalents of the guest added to each solution (Fig. 8 and Fig. S6†) to estimate an imaginary value of |Δε100%complex| through a curve-fitting method18 (Table 2). The value of |Δε100%complex| was converted to Kn. The estimated value of K2 was comparable to (K1)2 and K3 was larger than (K1)3, even though the association constant was lowered in 3b.
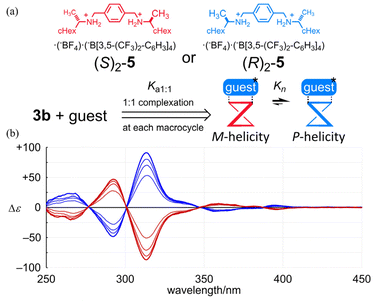 |
| | Fig. 8 (a) Chemical structures of (S)2-5 and (R)2-5, and (b) CD spectra of 3b ([3b] = 1.3 × 10⁻⁴ M) in the presence of (S)2-5 (red lines) or (R)2-5 (blue lines) (3, 6, 9 and 12 equiv.). | |
Table 2 Calculated values of |Δε100%complex|, Kn and ee, based on the results of titration experiments for the complexation of 1b, 2b or 3b with (R)2-5, measured in dichloromethane at 293 K
|
1b
|
2b
|
3b
|
|
K
a1:1
|
2.16 × 10⁴ ± 5.61 × 10³ M−1 |
K
a1:1
|
1.45 × 10⁴ ± 3.57 × 10³ M−1 |
K
a1:1
|
4.80 × 10³±1.10 × 10³ M−1 |
| Equiv. |
Δε measured at 301 nm |
Equiv. |
Δε measured at 310 nm |
Equiv. |
Δε measured at 313.5 nm |
| 0.5 |
−12.8 |
0.5 |
−30.5 |
1 |
+53.3 |
| 1 |
−26.8 |
1 |
−63.0 |
2 |
+70.3 |
| 2 |
−32.7 |
2 |
−75.7 |
3 |
+80.1 |
| 3 |
−35.1 |
3 |
−85.4 |
4 |
+91.0 |
| 4 |
−38.0 |
4 |
−91.0 |
|
|
| |Δε100%complex| |
39.35 ± 1.32 |
|Δε100%complex| |
96.46 ± 3.51 |
|Δε100%complex| |
102.9 ± 5.0 |
|
K
1
|
1.16 ± 0.005 |
K
2
|
1.34 ± 0.02 |
K
3
|
2.23 ± 0.1 |
| ee |
7.6 ± 0.3% |
ee |
15 ± 0.5% |
ee |
38 ± 2% |
|
|
|
(K1)2 |
1.35 ± 0.02 |
(K1)3 |
1.57 ± 0.03 |
|
|
|
ee |
15 ± 0.5% |
ee |
22 ± 0.7% |
Conclusions
We have demonstrated a conformational preference for a homochiral form of bis and tris(macrocycle)s, where an identical sense of twisting was induced throughout the entire molecule. Toward a comprehension of the interinfluence of several chiral elements in a single molecule, we attempted to explore the relationship between Kn and (K1)n. Due to uncertainty based on integration in NMR spectroscopy, we could not find a significant difference. Regarding intramolecular transmission, the preference in the bis or tris(macrocycle) seemed comparable to or less than the original preference induced in the monomeric macrocycle. Alternatively, the preference might be enhanced in the tris(macrocycle) in a complexed state through the intermolecular transmission of chirality. The results may present a new form of cooperativity, which would be a driving force to enhance a helical-sense preference with an increase in the number of elements, since such enhancement could be considered to be a type of sergeant-and-soldiers19 in a single molecule.
Conflicts of interest
There are no conflicts to declare.
References
- Ö. Demir and İ. Doğan, Chirality, 2003, 15, 242 CrossRef CAS PubMed; Y. Liu, S. A. Vignon, X. Zhang, K. N. Houk and J. F. Stoddart, Chem. Commun., 2005, 3927 RSC; S. Cantekin, D. W. R. Balkenende, M. M. J. Smulders, A. R. A. Palmans and E. W. Meijer, Nat. Chem., 2011, 3, 42 CrossRef PubMed; V. Diemer, J. Maury, B. A. F. L. Bailly, S. J. Webb and J. Clayden, Chem. Commun., 2017, 53, 10768 RSC.
- D. Casarini, L. Lunazzi, A. Mazzanti and E. Foresti, J. Org. Chem., 1998, 63, 4991 CrossRef CAS; I. R. Lahoz, A. Navarro-Vázquez, A. L. Llamas-Saiz, J. L. Alonso-Gómez and M. M. Cid, Chem. – Eur. J., 2012, 18, 13836 CrossRef PubMed; H. Bock, S. Huet, P. Dechambenoit, E. A. Hillard and F. Durola, Eur. J. Org. Chem., 2015, 1033 CrossRef; M. Ball, B. Fowler, P. Li, L. A. Joyce, F. Li, T. Liu, D. Paley, Y. Zhong, H. Li, S. Xiao, F. Ng, M. L. Steigerwald and C. Nuckolls, J. Am. Chem. Soc., 2015, 137, 9982 CrossRef PubMed; Z. J. Kinney, V. C. Kirinda and C. S. Hartley, Chem. Sci., 2019, 10, 9057 RSC; K. K. Kartha, A. Takai, Z. Futera, J. Labuta and M. Takeuchi, Angew. Chem., Int. Ed., 2021, 60, 16466 CrossRef PubMed.
- S. E. Penty, M. A. Zwijnenburg, G. R. F. Orton, P. Stachelek, R. Pal, Y. Xie, S. L. Griffin and T. A. Barendt, J. Am. Chem. Soc., 2022, 144, 12290 CrossRef CAS PubMed.
- A. D. Bain, Prog. Nucl. Magn. Reson. Spectrosc., 2003, 43, 63 CrossRef CAS.
- R. Katoono, Y. Tanaka, K. Kusaka, K. Fujiwara and T. Suzuki, J. Org. Chem., 2015, 80, 7613 CrossRef CAS PubMed.
- A preferred sense was assigned to M-helicity upon the intramolecular transmission of point chirality (R) on the nitrogen (ref. 5).
- R. Katoono, S. Kawai, K. Fujiwara and T. Suzuki, Chem. Sci., 2015, 6, 6592 RSC.
- A tris(macrocycle) relative to the structure C in fact adopted both heterochiral (C2-symmetry) and homochiral (D3-symmetry) forms.9 Regarding the structure E, either macrocycle would prefer the opposite sense to what was induced in a neighboring macrocycle.
- R. Katoono, K. Sakamoto and T. Suzuki, Chem. Commun., 2019, 55, 5503 RSC.
- J. E. Anthony, S. I. Khan and Y. Rubin, Tetrahedron Lett., 1997, 38, 3499 CrossRef CAS; M. Sonoda, A. Inaba, K. Itahashi and Y. Tobe, Org. Lett., 2001, 3, 2419 CrossRef PubMed; Y. Li, L. Xu, S. L.-F. Chan, Y. Li, R. Jiang, H. Liu and C.-M. Che, Chem. – Asian J., 2014, 9, 2842 CrossRef PubMed.
- Y. Tobe, N. Nakagawa, J. Kishi, M. Sonoda, K. Naemura, T. Wakabayashi, T. Shida and Y. Achiba, Tetrahedron, 2001, 57, 3629 CrossRef CAS.
- H. Kinoshita, N. Hirai and K. Miura, J. Org. Chem., 2014, 79, 8171 CrossRef CAS PubMed.
- P. Ehlers, A. Neubauer, S. Lochbrunner, A. Villinger and P. Langer, Org. Lett., 2011, 13, 1618 CrossRef CAS PubMed.
- K. Kondo, S. Yasuda, T. Sakaguchi and M. Miya, J. Chem. Soc., Chem. Commun., 1995, 55 RSC.
- R. Katoono, K. Kusaka, S. Kawai, Y. Tanaka, K. Hanada, T. Nehira, K. Fujiwara and T. Suzuki, Org. Biomol. Chem., 2014, 12, 9532 RSC.
- An imaginary value of |Δεmax| is related to measured values of Δε and ee or de according to the following equation: ee or de = Δε/|Δεmax|.
- P. Thordarson, Chem. Soc. Rev., 2011, 40, 1305 RSC.
-
S. Akine, TitrationFit, program for analyses of host–guest complexation, Kanazawa University, Kanazawa, Japan, 2013 Search PubMed.
- N. J. V. Zee, M. F. J. Mabesoone, B. Adelizzi, A. R. A. Palmans and E. W. Meijer, J. Am. Chem. Soc., 2020, 142, 20191 CrossRef CAS PubMed; T. Ikai, R. Ishidate, K. Inoue, K. Kaygisiz, K. Maeda and E. Yashima, Macromolecules, 2020, 53, 973 CrossRef.
Footnote |
| † Electronic supplementary information (ESI) available: NMR, UV and CD spectroscopic data, and titration experiments (Fig. S1–S7), experimental details of new compound syntheses, and copies of 1H, 13C NMR and MS spectra. See DOI: https://doi.org/10.1039/d3ob00171g |
|
| This journal is © The Royal Society of Chemistry 2023 |
Click here to see how this site uses Cookies. View our privacy policy here. 
 Open Access Article
 This Open Access Article is licensed under a
  *,
Takaaki
Kudo
and
Shunsuke
Kawai
*,
Takaaki
Kudo
and
Shunsuke
Kawai