
 Open Access Article
 This Open Access Article is licensed under a
 Creative Commons Attribution 3.0 Unported Licence
Second-harmonic-generation of [(Se,Te)Cl3]+[GaCl4]− with aligned ionic tetrahedra†
Maxime A.
Bonnin
a,
Lkhamsuren
Bayarjargal
b,
Victor
Milman
 c,
Björn
Winkler
*b and
Claus
Feldmann
*a
c,
Björn
Winkler
*b and
Claus
Feldmann
*a
aInstitute for Inorganic Chemistry (IAC), Karlsruhe Institute of Technology (KIT), Engesserstraße 15, D-76131 Karlsruhe, Germany. E-mail: claus.feldmann@kit.edu
bInstitute of Geosciences, Goethe University Frankfurt, Altenhoeferallee 1, D-60438 Frankfurt a. M., Germany. E-mail: b.winkler@kristall.uni-frankfurt.de
cDassault Systèmes BIOVIA, Cambridge, UK
First published on 30th March 2023
Abstract
[SeCl3][GaCl4] (1) and [TeCl3][GaCl4] (2) are prepared via Lewis-acid–base reaction of SeCl4 or TeCl4 with GaCl3 at 50 °C (1) and 140 °C (2) in quantitative yield. The ionic compounds contain pseudo-tetrahedral [SeCl3]+/[TeCl3]+ cations with a prominent stereochemically active electron lone pair at Se(IV)/Te(IV) as well as tetrahedral [GaCl4]− anions. Both compounds crystallize in the polar chiral space group P1 with an unidirectional alignment of all tetrahedral building units. They can be considered as the first examples of a much larger group of ionic compounds [MX3]+[M′X4]− (M, M′: metal or main-group element, X: halogen) showing nonlinear optical effects. Material characterization is performed by X-ray structure analysis based on single crystals and powder samples, thermogravimetry, optical spectroscopy, infrared and Raman spectroscopy. Second harmonic generation (SHG) is observed with intensities about 3-times stronger than for potassium dihydrogen phosphate (KDP) in the visible spectral regime with narrow-band-gap materials (2.8, 3.2 eV). Density functional theory calculations are employed to complement the experimental findings, interpret the Raman spectra, visualize the stereochemically active lone electron pair, and compute the SHG tensor.
1. Introduction
Second harmonic generation (SHG) and the underlying frequency doubling belong to the most often employed non-linear optical (NLO) processes.1 The frequency doubling of lasers (e.g., Nd:YAG: 1064 nm → 532 nm or Ti:sapphire: 800 nm → 400 nm) is a prominent example of this type of application.1a The occurrence of the SHG effect and the rational design of new NLO materials relies on several prerequisites. Due to symmetry constraints, SHG occurs only in non-centrosymmetric crystal structures.1 According to Miller's rule the SHG signal intensity is proportional to (n2 − 1)3 (n: refractive index). Hence, narrow-band-gap semiconductors (e.g., GaAs, GaSb) are known to produce intense SHG signals. Narrow band gaps, on the other hand, imply a limited transmission of visible light, which is counterproductive for most applications. To maximize the intensity of the SHG signal, furthermore, phase matching is desirable.1 Thus, it is advantageous if the velocities of the fundamental and the harmonic wave can be made equal by choosing a propagation direction in a birefringent crystal, where the difference in the refractive index due to dispersion is compensated by the birefringence. Finally, suitable SHG materials need to be stable when irradiated with high-intensity laser light.The occurrence of a strong NLO effect is usually correlated with specific structural features, such as the presence of orientationally ordered tetrahedra, stereochemically active lone electron pairs, Jahn–Teller-distorted MO6 octahedra, or π-orbital anionic groups.2 Structures containing tetrahedral networks, such as quartz and potassium dihydrogen phosphate (KDP) are well-known materials. Quartz only shows a comparably weak SHG intensity, while KDP is known for its very strong SHG effect.1b,3 Examples of NLO compounds with stereochemically active lone electron pairs are iodates, which are known for strong SHG effects with, for instance, Li2Ge(IO3)6 showing an SHG intensity 32× higher than KDP4 as the stereochemically active lone pair induces a strong polarization in the respective polar building unit. Se(IV)- and Te(IV)-based materials usually show lower SHG intensities than iodates (e.g., Bi3(SeO3)3(Se2O5)F: 8 × KDP, Ba(MoO2F)2(QO3)2 (Q = Se, Te): 2–5 × KDP).5
Here, we report on the synthesis, characterization, and properties of the novel compounds [SeCl3][GaCl4] (1) and [TeCl3][GaCl4] (2). Both are obtained with quantitative yield and contain aligned ionic tetrahedral building units and stereochemically active lone electron pairs. The title compounds show strong SHG effects with an SHG intensity 3× stronger than for KDP. In principle, they also stand for a large group of similar ionic compounds [MX3]+[M′X4]− (M, M′: metal or main-group element, X: halogen) with aligned tetrahedral building units, which are predominately known for silicates or phosphates until now.6 In difference to many NLO materials, the strong effect is observed in the visible spectral range. Beside the experimental evaluation via the Kurtz-Perry approach, the SHG tensors are also determined based on density functional theory (DFT) calculation.
2. Experimental section
2.1 General considerations
The starting materials SeCl4 (99,8% ABCR, Germany), TeCl4 (99% Sigma-Aldrich, Germany) and GaCl3 (99.999%, Sigma-Aldrich, Germany) were commercially available and used as received. All reactants were filled and stored in argon-filled gloveboxes (MBraun Unilab, Germany, O2/H2O <1 ppm). The reactions were performed using standard Schlenk techniques and glass ampoules. All glass ware was evacuated three times to <10−3 mbar, heated, and flushed with argon to remove all moisture.2.2 Synthesis
2.3 Analytical techniques
3. Results and discussion
3.1 Synthesis
[SeCl3][GaCl4] (1) and [TeCl3][GaCl4] (2) were prepared by a simple Lewis-acid–base reaction of the pure starting materials SeCl4 or TeCl4 with GaCl3 without any additional solvent (Fig. 1). After four days at 50 or 140 °C, the pure title compounds were obtained in quantitative yield and as light yellow crystals for 1 and violet crystals for 2. Both compounds are sensitive to moisture and need to be handled and stored under inert conditions. The purity of the title compounds was confirmed by X-ray powder diffraction and Rietveld refinement (Fig. 2), Fourier-transform infrared (FT-IR) spectroscopy (ESI: Fig. S1†), and thermogravimetry (TG) (ESI: Fig. S2†). According to TG, the title compounds are thermally stable up to 200 °C (1) and 300 °C (2). At higher temperature, they show dissociative sublimation via SeCl4/TeCl4 and GaCl3 (ESI: Fig. S2†). The fact that the title compounds re-crystallize from the gas phase, in principle, also opens the option to grow larger crystals or to form thinfilms via gas-phase deposition. Both can be interesting for future application and differentiates the title compounds, for instance, from well-known tellurite- or iodate-based SHG materials.20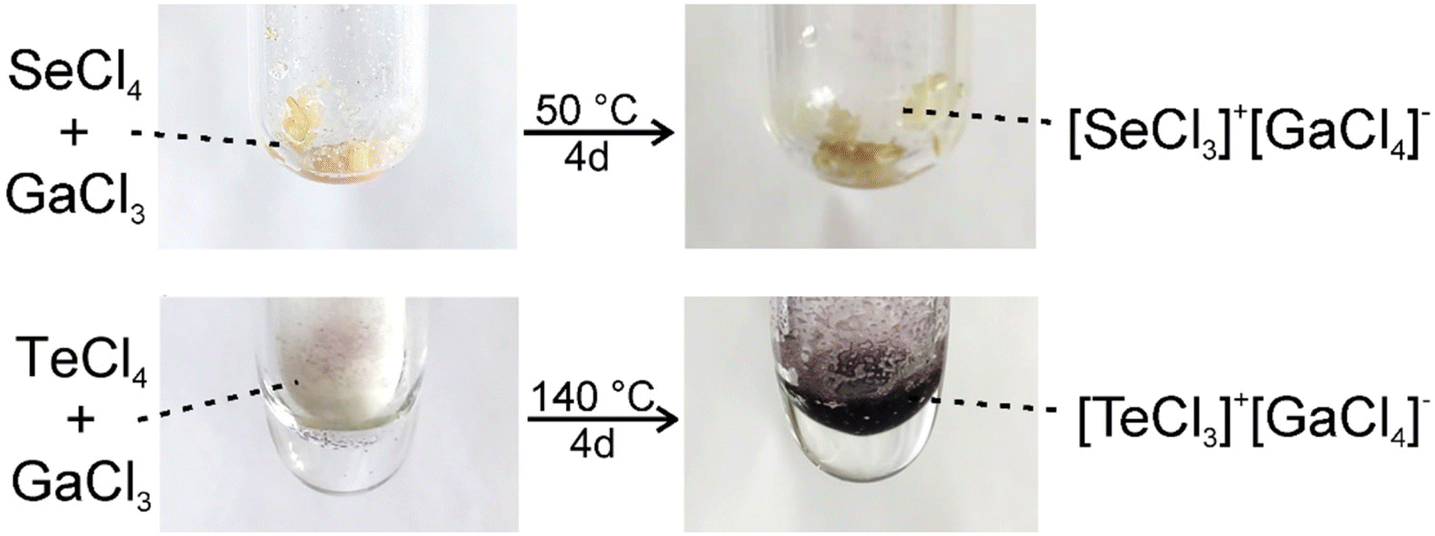 | ||
| Fig. 1 Scheme illustrating the synthesis of [SeCl3][GaCl4] and [TeCl3][GaCl4] with photos showing the pure starting materials (without any additional solvent) and the colour change indicating the formation of the pure products after heating (reactions performed in glass ampoules under argon). | ||
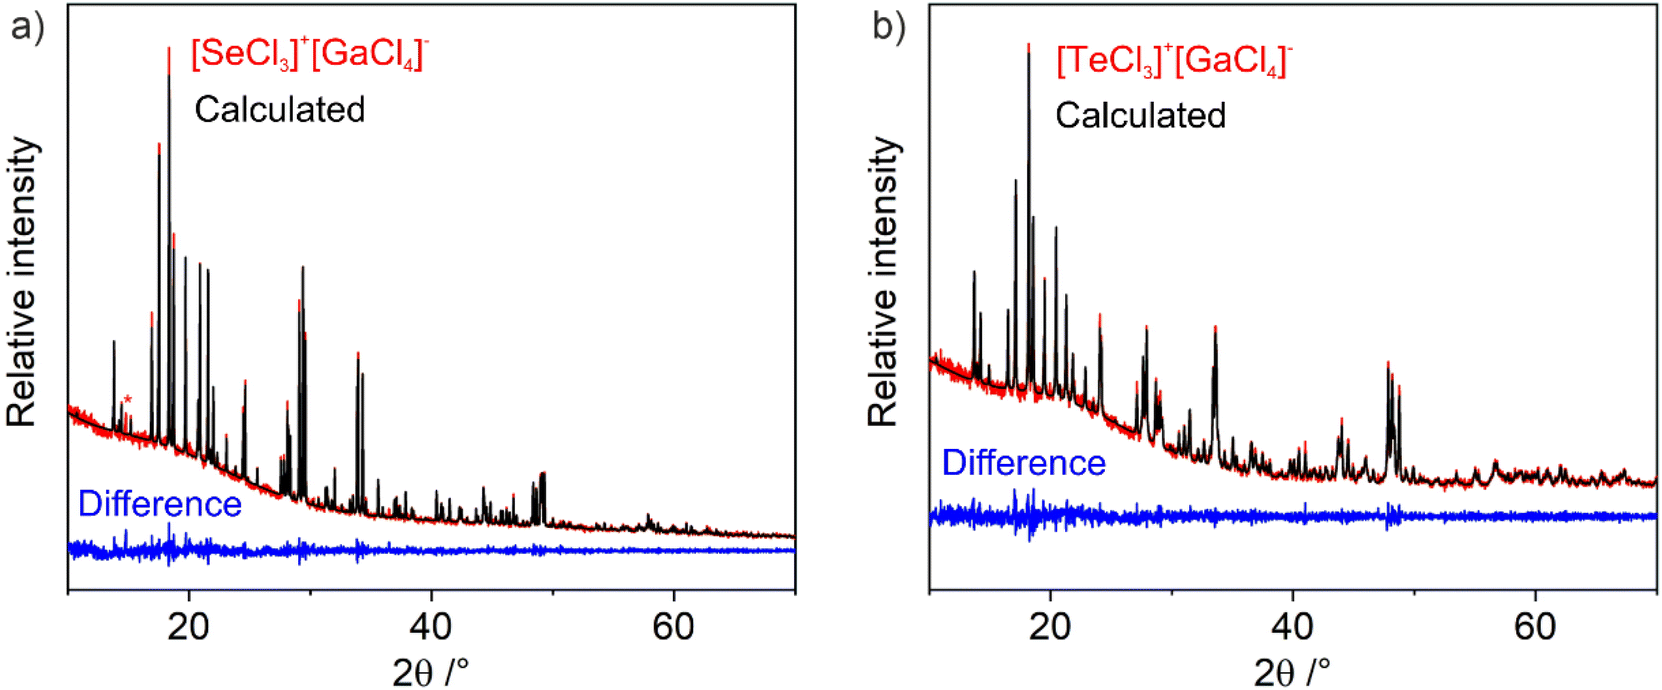 | ||
| Fig. 2 Rietveld refinement of diffraction patterns of (a) [SeCl3][GaCl4] and (b) [TeCl3][GaCl4] with experimental powder diffractogram, Rietveld refinement, and difference curve (*unassigned single Bragg reflection). | ||
3.2 Structural characterization
Single crystal X-ray structure analysis of [SeCl3][GaCl4] (1) and [TeCl3][GaCl4] (2) show that these phases crystallize in the triclinic space group P1 (Table 1 and ESI: Fig. S3†). Thus, both title compounds exhibit a chiral space group or so-called Sohncke space group without any symmetry other than translational symmetry.211 and 2 contain pseudo-tetrahedral [SeCl3]+ and [TeCl3]+ cations (Fig. 3a and b) as well as tetrahedral [GaCl4]− anions (Fig. 3c). The absence of a centre of inversion is clearly reflected by the uniaxial alignment of the tetrahedral building units (Fig. 3d). Comparable compounds and crystal structures of Lewis-acid–base adducts of chalcogenide chlorides and metal chlorides are known already and, for instance, include [SeCl3][SbCl6] or [TeCl3][NbCl6].22 The vast majority of these compounds, however, crystallizes in space groups with inversion symmetry. Related compounds, which also crystallize in Sohncke space groups without inversion symmetry, are [MCl3][FeCl4] (M: Se, Te) and [SeCl3][AlCl4].23 For these compounds, however, SHG and NLO effects were not examined or reported until now. Taken together, the new compounds [SeCl3][GaCl4] (1) and [TeCl3][GaCl4] (2) can be also taken as examples for a much larger group of ionic compounds [MX3]+[M′X4]− with aligned tetrahedral building units (M, M′: metal or main-group element, X: halogen).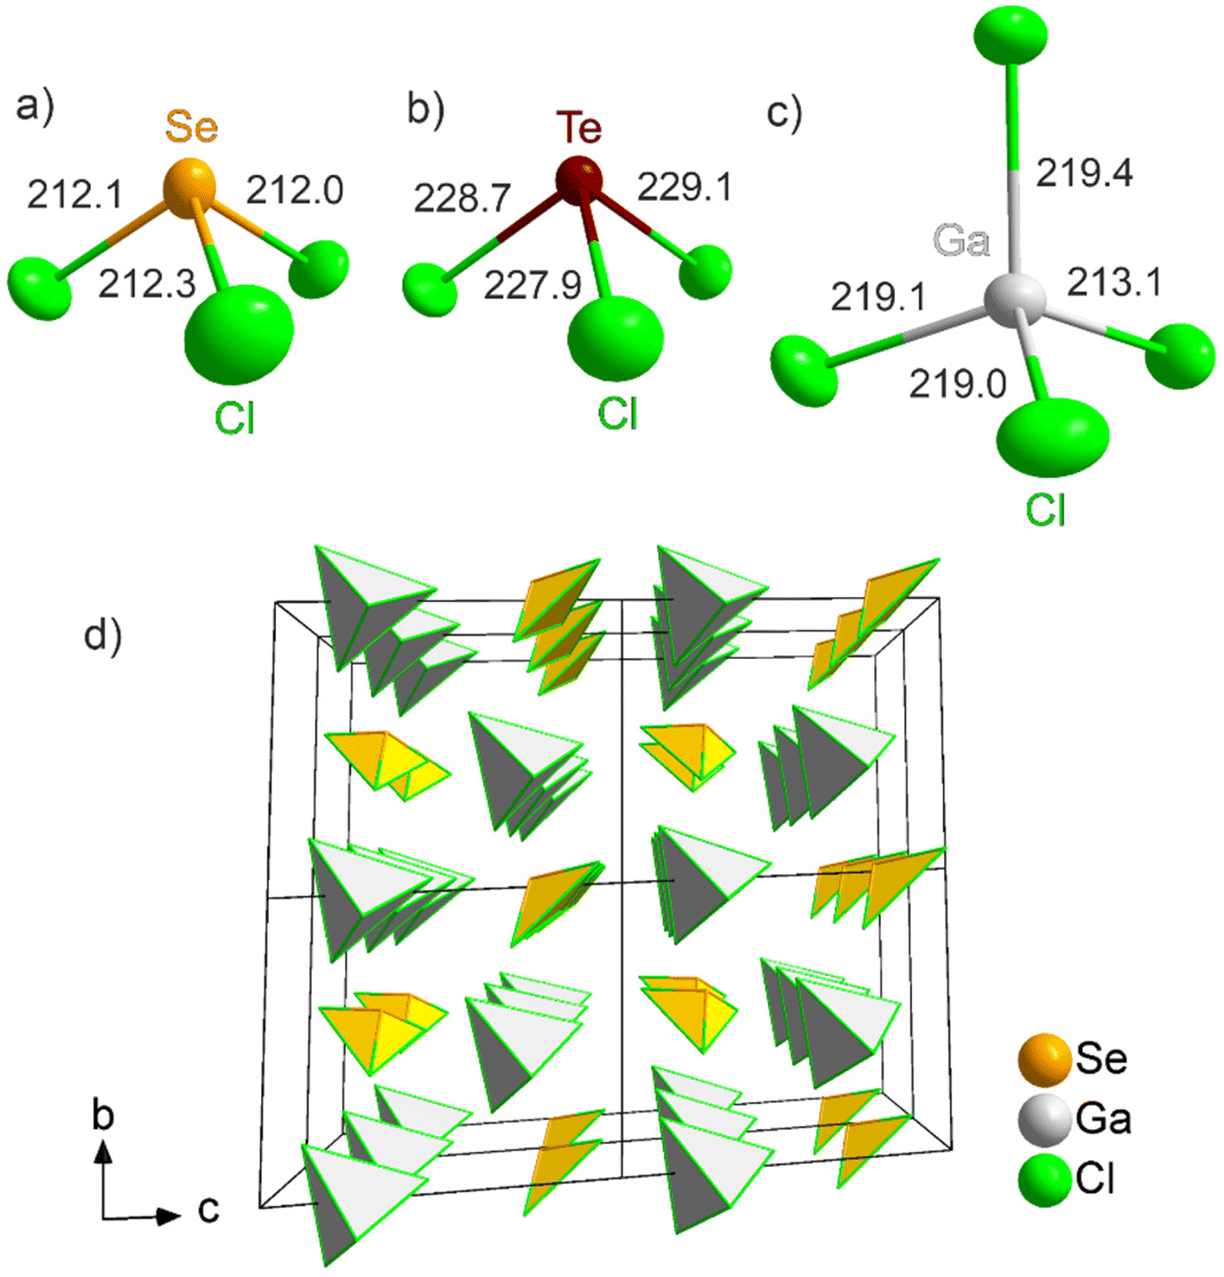 | ||
| Fig. 3 Tetrahedral building units in 1 and 2: pseudo-tetrahedral [SeCl3]+ (a) and [TeCl3]+ (b), tetrahedral [GaCl4]− anion (c), and (2 × 2 × 2) supercell showing the similarly aligned tetrahedra (d). | ||
| Compound | [SeCl3][GaCl4] | [TeCl3][GaCl4] |
| W (g mol−1) | 396.8 | 445.5 |
| Space group | P1 | P1 |
| Flack parameter | −0.01(3) | −0.04(3) |
| a (pm) | 638.0(2) | 652.1(1) |
| b (pm) | 826.4(3) | 836.7(1) |
| c (pm) | 984.9(3) | 994.1(2) |
| α (°) | 86.1(1) | 86.1(1) |
| β (°) | 77.6(1) | 77.3(1) |
| γ (°) | 83.3(1) | 82.3(1) |
| V (106 pm3) | 503.2(3) | 524.0(2) |
| Z | 2 | 2 |
| ρ calc. (g cm−3) | 2.62 | 2.82 |
| μ (mm−1) | 8.13 | 7.06 |
| λ(Mo-Kα) (pm) | 71.073 | 71.073 |
| T (K) | 200 | 200 |
| Observed reflections | 2997 | 3559 |
| Independent reflections | 2133 | 3239 |
| R 1 (I ≥ 2σI) | 0.0403 | 0.0453 |
| R 1 (all data) | 0.0531 | 0.0481 |
| wR2 (I ≥ 2σI) | 0.0876 | 0.1078 |
| wR2 (all data) | 0.0916 | 0.1101 |
| GooF | 0.828 | 1.000 |
The Se–Cl distances (211.4(5)–212.3(5) pm) in 1 are in accordance with literature data (e.g. [SeCl3][SbCl6]: 211.4–212.5 pm) (Fig. 3a).22a The Cl–Se–Cl angles (97.5(2)–100.2(2)°) confirm the pseudo-tetrahedral coordination. Due to the larger space required for the lone pair at Se(IV), the Cl–Se–Cl angles, as expected, are smaller than the ideal tetrahedral angle of 109.5°. The Te–Cl distances (227.9(5)–229.1(4) pm) in 2 are also in accordance with literature data ([TeCl3][AuCl4]: 229.1–229.8 pm) (Fig. 3b).24 The Cl–Te–Cl angles (94.2(2)–96.8(2)°) again reflect the pseudo-tetrahedral coordination. The Ga–Cl distances in the [GaCl4]− anion for 1 (213.6(6)–219.3(5) pm) and 2 (212.3(5)–219.7(5) pm) are very close to comparable compounds (e.g. GaCl3: 209.5–229.7 pm) (Fig. 3c).25 The Cl–Ga–Cl angles (1: 105.8(2)–114.1(2)°, 2: 104.7(2)–114.1(2)°) point to a minor distortion of the ideal tetrahedron only.
Besides X-ray diffraction, the title compounds were examined by vibrational spectroscopy and optical spectroscopy. Fourier-transform infrared (FT-IR) spectroscopy does not show any vibrations related to ν(O–H) or ν(C–H) at 3500–2800 cm−1, which confirms the absence of moisture and organic impurities (ESI: Fig. S1†). Broad vibrations at 1000–500 cm−1 are likely due to minor remnants of SeCl4, TeCl4, and GaCl3. Raman spectra of the title compounds show well-resolved vibrations (Fig. 4). Density functional perturbation theory (DFPT) calculations allow to assign atomic displacement patterns to the Raman bands (see Fig. 7). Bands with Raman shifts between 300–450 cm−1 are due to stretching vibrations of the [SeCl3]+ and [GaCl4]− ions. Bands with Raman shifts between ∼100–250 cm−1 are mainly bending vibrations of these groups. At lower frequencies, which we could not experimentally study here, the Raman bands correspond to more complex displacement patterns.
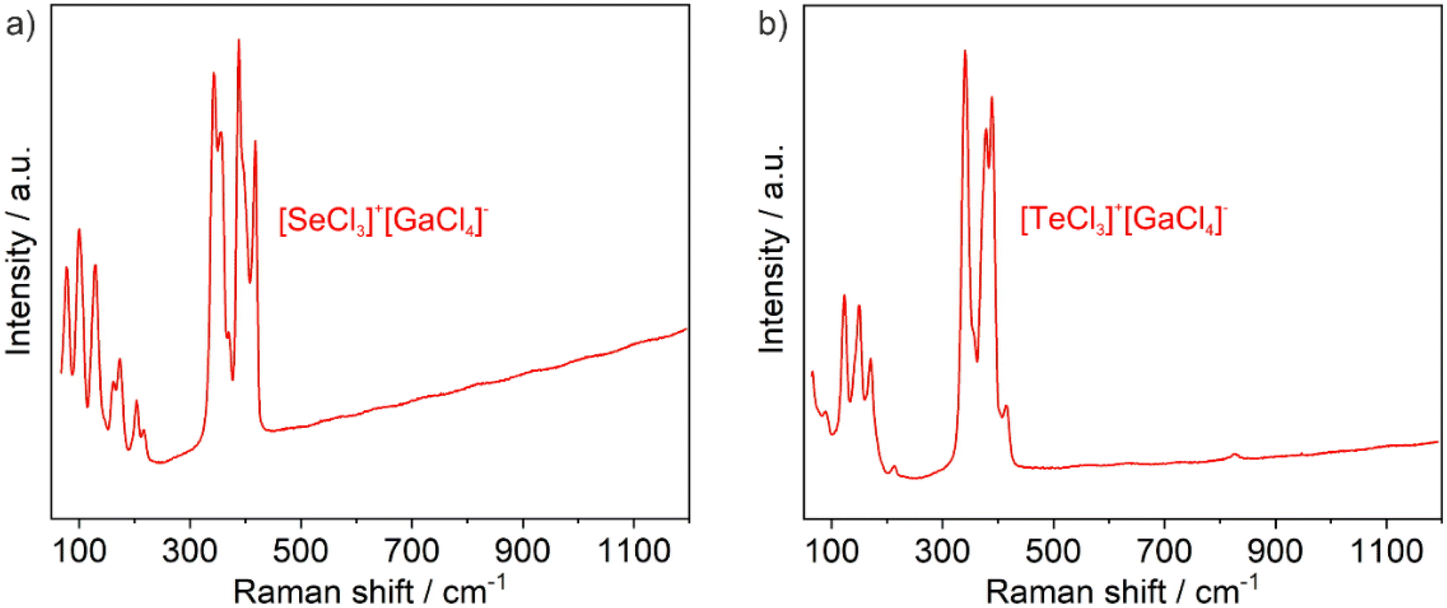 | ||
| Fig. 4 Raman spectra of (a) [SeCl3][GaCl4] and (b) [TeCl3][GaCl4]. | ||
Ultraviolet-visible (UV-Vis) spectroscopy shows a steep absorption at 300–350 nm, which can be related to valence-band-to-conduction-band transition (Fig. 5a). Based on Tauc plots, indirect band gaps can be determined with 2.8 eV for [SeCl3][GaCl4] (1) and 3.2 eV for [TeCl3][GaCl4] (2) (Fig. 5b). Interestingly, 1 with the more electronegative selenium has a smaller band gap than 2 with the less electronegative tellurium. In this regard, it needs to be taken into account that both Se and Te are centered in a cationic [MCl3]+ pseudo-tetrahedron nevellating the influence of Se/Te. On the other hand, the smaller band gap of [SeCl3][GaCl4] can be ascribed to the smaller size of the [SeCl3]+ pseudo-tetrahedron (212 pm for Se–Cl versus 228 pm for Te–Cl distance) contributing to a more intense overlap of energy states of [SeCl3]+ cation and [GaCl4]− anion to form the infinite semiconductor-type band structure. Beside the valence-band-to-conduction-band absorption, an additional weaker absorption is observed at 420–520 nm ([SeCl3][GaCl4]) and 480–650 nm ([TeCl3][GaCl4]), which can be related to Cl → Se and Cl → Te charge-transfer (CT) transitions (Fig. 5a). Here, the red-shift for [TeCl3][GaCl4] indeed reflects the lower electronegativity of tellurium compared to selenium. This CT-driven absorption is also causative for the light yellow colour of 1 and the violet appearance of 2 (Fig. 1).
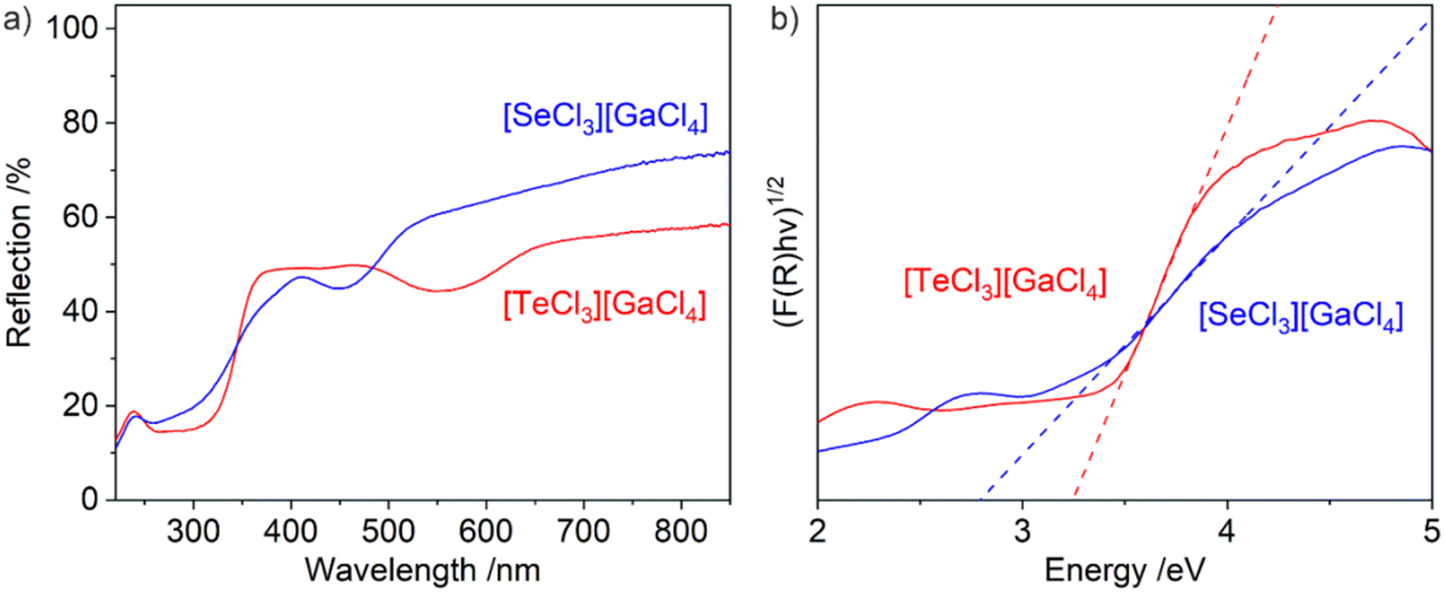 | ||
| Fig. 5 UV-Vis spectra (a) and Tauc plots for the band-gap determination (b) of [SeCl3][GaCl4] and [TeCl3][GaCl4]. | ||
3.3 Second harmonic generation
For [SeCl3][GaCl4] and [TeCl3][GaCl4] NLO properties are to be expected due to the ordered arrangement of the tetrahedral building units and in a structure with the polar chiral Sohncke space group P1.1,21 In order to determine the properties and performance of the title compounds, SHG effects were studied with the Kurtz-Perry approach,10 which offers several advantages in regard of the characterization of new compounds. First of all, SHG measurements can be performed based on microcrystalline powder samples. Moreover, the presence of enantiomeric or twinned crystals is not an issue if the individual domains are large enough (>1 μm). With crystallite sizes of 20 to 60 μm, the title compounds are well-suited for measurements based on the Kurtz-Perry approach. This approach also allows to distinguish between matchable and non-phase matchable materials due to the relationship between SHG intensities and grain sizes. However, this approach has some significant limitations. Specifically, it provides information about the averaged effective SHG coefficient with large uncertainty, as it is often difficult to quantify the grain size distribution in powder samples. In our experiment, unsorted powder samples with grain sizes less than <60 μm were exposed to laser light with a wavelength of 1064 nm. The converted light was detected at 532 nm. The measured SHG intensities are shown in the Table 2. Due to the weak colour of crystals of both [SeCl3][GaCl4] and [TeCl3][GaCl4], they are transparent in the spectral range of the incident laser as well as in the spectral range of the converted light.| Sample | Particle size (μm) | SHG intensities (mV) | |
|---|---|---|---|
| I | II | ||
| Quartz | 5–25 | 191(40) | 151(38) |
| Quartz | 25–50 | 292(59) | 385(70) |
| Al2O3 | 9 | 0(1) | 1(1) |
| KDP | 5–25 | 496(102) | 614(117) |
| KDP | 25–50 | 1698(310) | 2395(224) |
| [SeCl3][GaCl4] | <60 | 6101(1220) | — |
| [TeCl3][GaCl4] | <40 | — | 6053(1491) |
As the Kurtz-Perry approach does not result in absolute SHG intensities,10 quartz and KDP were examined at similar conditions as the reference compounds in order to assess the strength of the SHG signal. KDP is phase matchable (second-order susceptibility: d36 = 0.39 pm V−1), and therefore yields an SHG signal which is at least 5-times stronger than the non-phase-matchable quartz (d11 = 0.3 pm V−1) although the SHG coefficients are similar.26 Corundum (α-Al2O3) was analysed as a reference with a center of inversion, which does not show any SHG effect. Both title compounds show strong SHG signals (Table 2 and Fig. 6). The SHG intensity of [SeCl3][GaCl4] is around 3.6-times higher than the corresponding SHG intensity of KDP. [TeCl3][GaCl4] exhibits a signal with an intensity 2.5-times higher than KDP. However, it should be noticed that based on less controlled experimental conditions (e.g., grain sizes, grain size distributions, layer thickness), the SHG intensity of both compounds must be considered to be rather similar within the experimental uncertainty.
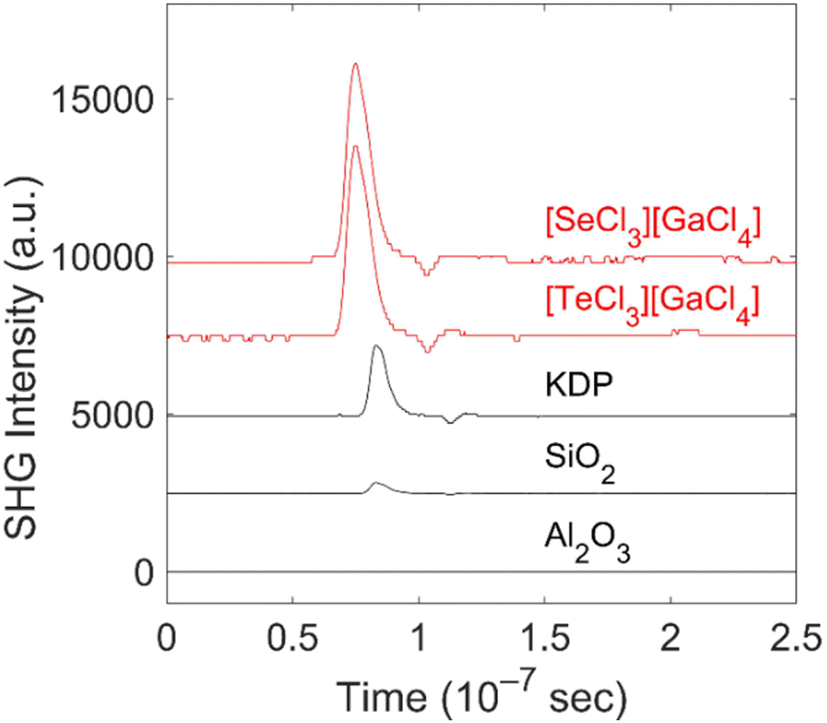 | ||
| Fig. 6 Representative SHG measurements of [SeCl3][GaCl4], [TeCl3][GaCl4], and reference samples. Here, it must be noticed that a quantitative assessment is not possible due to limitations of the Kurtz-Perry approach. | ||
3.4 DFT model calculation
Density functional theory (DFT) and density functional perturbation theory (DFPT) based calculations were employed to assign the Raman modes, visualize the stereochemically active lone electron pair and obtain the SHG tensor for 1 and 2. We have shown earlier that linear response-based DFT calculations allow computing SHG tensors even in low symmetry compounds,27 although with a systematic offset, as the DFT-GGA-PBE calculations underestimate the band gap. The dispersion-corrected DFT-calculations reproduce the structural parameters within a few percent. Electron density difference calculations confirm the presence of a stereochemically active electron lone pair, which appears as an umbrella-shaped charge accumulation about 0.75 Å from the position of the Se/Te atom (Fig. 7).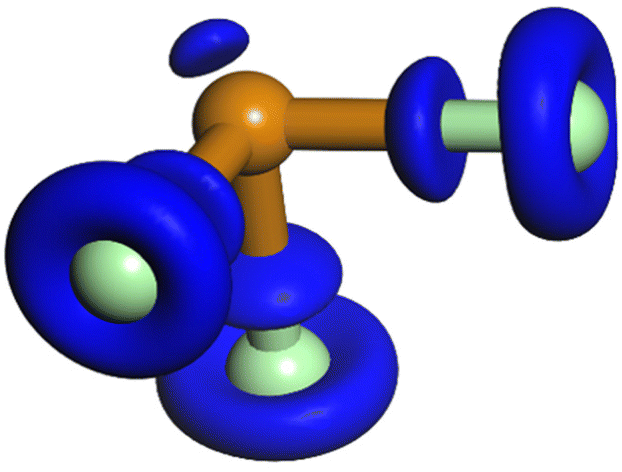 | ||
| Fig. 7 Isosurface of the electron density difference distribution at 0.05 e− Å−3 for [TeCl3][GaCl4], showing charge accumulation due to covalent bonding along the Te–Cl bond and an umbrella-shaped maximum about 0.75 Å from the Te atom. This is characteristic for stereochemically active lone electron pairs. | ||
The computed Raman spectra are compared to the experimentally determined spectra for [SeCl3][GaCl4] and [TeCl3][GaCl4] (Fig. 8a and b). While the overall match is reasonably good, there are some discrepancies in the intensities of some Raman bands. These are mainly due to experimental challenges, as the soft material had to be contained between glass slides and consisted of grains with sizes larger than the beam diameter. Therefore, the experimental Raman spectra do not represent powder averages. The DFPT calculations allow to visualize the displacement patterns associated with individual Raman bands (Fig. 8c and d).
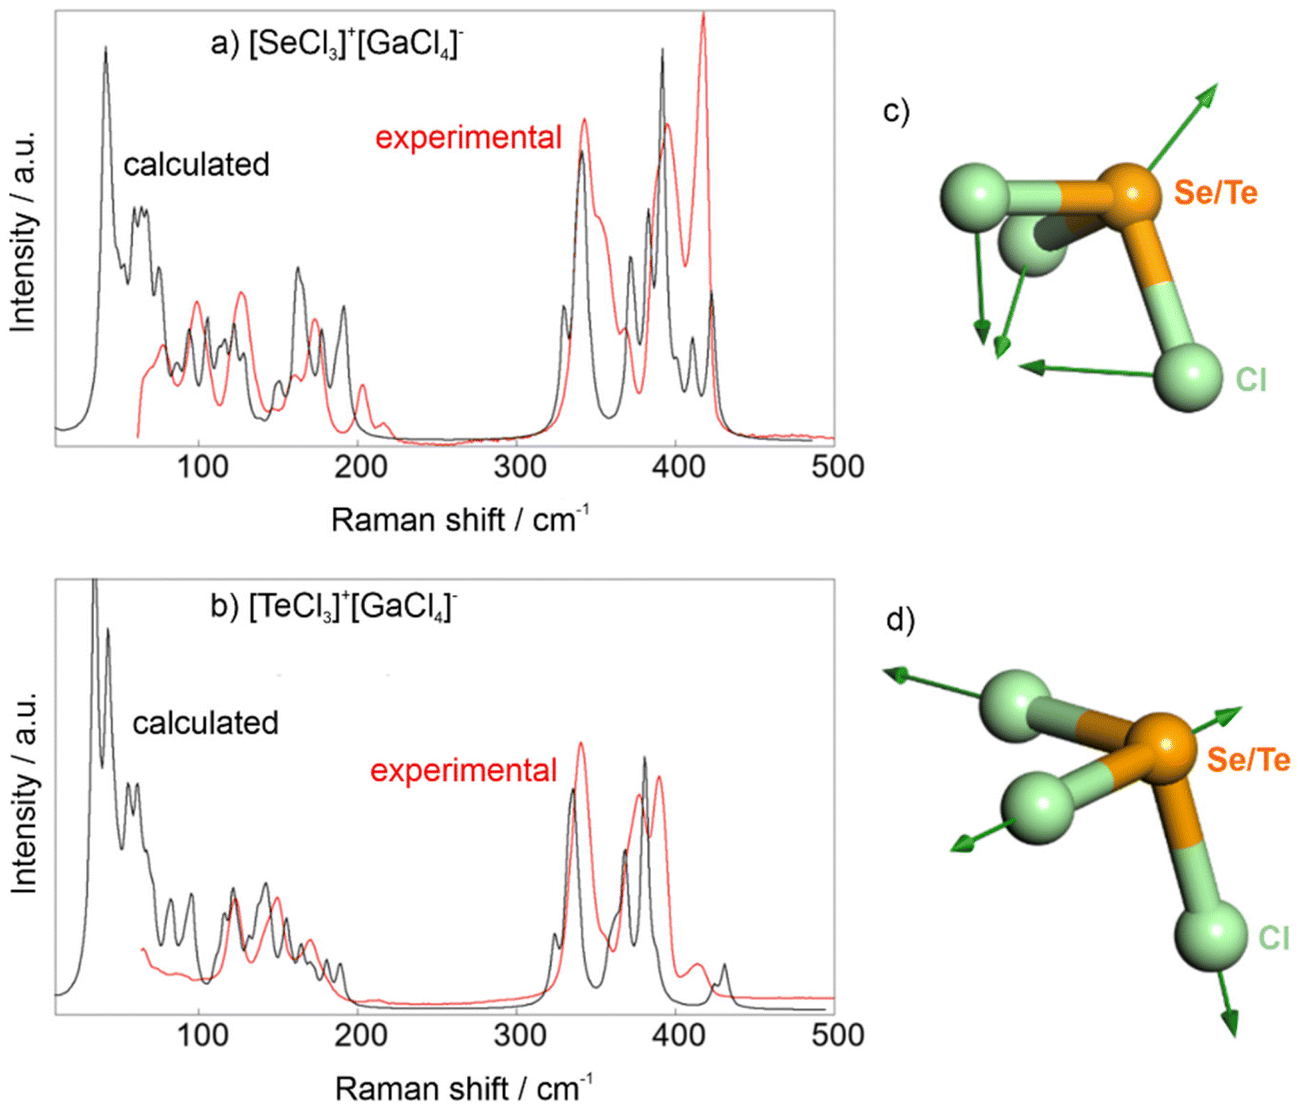 | ||
| Fig. 8 Experimental and DFPT-calculated Raman spectra of (a) [SeCl3]+[GaCl4]− and (b) [TeCl3]+[GaCl4]− (theoretical frequencies scaled by 7% to compensate for underbinding typically encountered in DFT-GGA-PBE-calculations); (c) typical displacement pattern for Raman modes with Raman shifts between 100–200 cm−1, which are predominantly bending motions of the [SeCl3]+/[TeCl3]+ cation (here for a mode at 180 cm−1) and [GaCl4]− anion; (d) typical displacement pattern of the [SeCl3]+/[TeCl3]+ cation for Raman modes with Raman shifts between 300–450 cm−1, which correspond to stretching vibrations (here for a mode at 375 cm−1). | ||
The SHG tensors for 1 and 2 were obtained assuming Kleinmann symmetry, and therefore have the symmetrically independent components d11, d12 = d26, d13 = d35, d14 = d25 = d36, d15 = d31, d16 = d21, d22, d23 = d34, d24 = d32, d33. The complete tensors are listed in Tables 3 and 4. The values have not been corrected for the systematic underestimation of the band gap in DFT-GGA-PBE calculations. The DFT-GGA-PBE band gaps are 2.6 eV for 1 and 3.2 eV for 2. Both calculated values are also well in agreement with the experimentally determined optical bandgaps of 2.8 eV for 1 and 3.2 eV for 2 (Fig. 5b).
| d x1 | d x2 | d x3 | d x4 | d x5 | d x6 | |
|---|---|---|---|---|---|---|
| d 1y | −14.2 | −1.5 | −0.5 | 3.6 | −1.6 | 4.6 |
| d 2y | 4.6 | 8.2 | 0.9 | −3.6 | 3.6 | −1.5 |
| d 3y | −1.6 | −3.6 | −0.9 | 0.9 | −0.5 | 3.6 |
| d x1 | d x2 | d x3 | d x4 | d x5 | d x6 | |
|---|---|---|---|---|---|---|
| d 1y | −9.7 | 0.4 | 0.2 | 3.6 | −1.7 | 3.8 |
| d 2y | 3.8 | 7.8 | 0.8 | −1.4 | 3.6 | 0.4 |
| d 3y | −1.7 | −1.4 | −1.2 | 0.8 | 0.2 | 3.6 |
We computed average effective SHG coefficients12 to facilitate a comparison. For [SeCl3][GaCl4] deff is 8.1 pm V−1, while deff is 6.1 pm V−1 for [TeCl3][GaCl4]. The corresponding values for quartz are deff(quartz) = 0.21 pm V−1, while for KDP deff(KDP) is 0.33 pm V−1. Within the substantial uncertainties of both the computations and the experiments, these values are consistent with the ratios of the observed SHG intensities of 1 and 2 to that of quartz, and indicate an about 20- to 30-times larger SHG intensity with respect to that of non-phase matchable quartz. This implies that 1 and 2 are also non-phase matchable. Conversely, if 1 and 2 were phase matchable, one would expect an SHG intensity about 200-times higher than KDP (factor 20 due to relative size of deff(KDP) to deff(1,2) multiplied by a factor of 10 due to phase matchability). Additional measurements of the grain-size dependence of SHG signals could provide further experimental constraints for the phase-matching conditions, but these were outside the scope of the present study.
4. Conclusions
The novel compounds [SeCl3][GaCl4] (1) and [TeCl3][GaCl4] (2) were prepared by simple Lewis-acid–base reaction of SeCl4/TeCl4 with GaCl3 near room temperature (50 °C, 140 °C) with quantitative yield. Both title compounds crystallize in the polar chiral Sohncke space group P1. They are composed of pseudo-tetrahedral [SeCl3]+/[TeCl3]+ cations with a prominent stereochemically active electron lone pair at Se(IV) as well as of tetrahedral [GaCl4]− anions. These tetrahedral building units show preferential orientation, which, together with the stereochemically active electron lone-pair, lead to the observed second harmonic generation (SHG) effect. [SeCl3][GaCl4] and [TeCl3][GaCl4] show strong SHG signals, 3.6× to 2.5× higher than for potassium dihydrogen phosphate (KDP). In contrast to the majority of SHG materials, the SHG effect is here observed in the visible spectral regime for semiconductors with narrow band gap (2.8 eV for [SeCl3][GaCl4], 3.2 eV for [TeCl3][GaCl4]). The experimental results (structure analysis, vibrational spectroscopy, SHG examination via Kurtz–Perry approach) were complemented by density functional theory calculations, which have supported conclusions drawn from the experimental findings, provided an interpretation of the vibrational spectra, confirmed the presence of the active lone electron pair, and have been used to obtain the SHG tensor.In sum, synthesis and characterization of [(Se,Te)Cl3][GaCl4] point to the opportunity of realizing new NLO materials with good performance by simple reactions and with quantitative yield. Moreover, [SeCl3][GaCl4] and [TeCl3][GaCl4] are the first representatives of a much larger group of ionic halides [MX3]+[M′X4]− with aligned tetrahedral building units and stereochemically active lone electron pairs (M, M′: metal or main-group element, X: halogen). In principle, processing via the gas phase is possible to obtain large crystals and/or thinfilms. Altogether, this raises the perspective of easily synthesized SHG materials with potentially even higher SHG intensity in the visible.
Conflicts of interest
There are no conflicts to declare.Acknowledgements
M. A. B. and C. F. acknowledge the Deutsche Forschungsgemeinschaft (DFG) for funding within the project “Crown-Ether-Coordination-Compounds with Unusual Structural and Optical Properties/Crown I (FE 911/14-1)”. B. W. is grateful for support through the BIOVIA Science Ambassador program. L. B. gratefully acknowledge funding from the DFG (project Ba4020).References
- (a) R. W. Boyd, Nonlinear Optics, Academic Press, New York, 4th edn, 2020 Search PubMed; (b) E. Garmire, Opt. Express, 2013, 21, 30532–30544 CrossRef PubMed.
- (a) S.-P. Guo, Y. Chi and G.-C. Guo, Coord. Chem. Rev., 2017, 335, 44–57 CrossRef CAS; (b) T. T. Tran, H. Yu, J. M. Rondinelli, K. R. Poeppelmeier and P. S. Halasyamani, Chem. Mater., 2016, 28, 5238–5258 CrossRef CAS; (c) K. M. Ok, E. O. Chi and P. S. Halasyamani, Chem. Soc. Rev., 2006, 35, 710–717 RSC.
- A. Ashkin, G. D. Boyd and D. A. Kleinman, Appl. Phys. Lett., 1965, 6, 179–180 CrossRef CAS.
- J. Chen, C. L. Hu, F. Kong and J. G. Mao, Acc. Chem. Res., 2021, 54, 2775–2783 CrossRef CAS PubMed.
- (a) S. Shi, C. Lin, G. Yang, L. Cao, B. Li, T. Yan, M. Luo and N. Ye, Chem. Mater., 2020, 32, 7958–7964 CrossRef CAS; (b) J. Y. Chung, H. Jo, S. Yeon, H. R. Byun, T.-S. You, J. I. Jang and K. M. Ok, Chem. Mater., 2020, 32, 7318–7326 CrossRef CAS; (c) M.-L. Liang, Y.-X. Ma, C.-L. Hu, F. Kong and J.-G. Mao, Chem. Mater., 2020, 32, 9688–9695 CrossRef CAS; (d) L. Geng, Q. Li, C.-Y. Meng, K. Dai, H.-Y. Lu, C.-S. Lind and W.-D. Chengd, J. Mater. Chem. C, 2015, 3, 12290–12296 RSC.
- (a) S. V. Krivovichev, O. Mentre, O. I. Siidra, M. Colmont and S. K. Filatov, Chem. Rev., 2013, 113, 6459–6535 CrossRef CAS PubMed; (b) J. Huang, S. Shu and C. Ge-Mei, Cryst. Growth Des., 2022, 22, 1500–1514 CrossRef CAS.
- X-RED32, Data Reduction Program, Stoe, Darmstadt, Germany, 2001 Search PubMed.
- G. M. Sheldrick, Acta Crystallogr., Sect. A: Found. Adv., 2015, 71, 3–8 CrossRef PubMed.
- DIAMOND, Crystal and Molecular Structure Visualization, Crystal Impact GbR, Bonn, Germany, 2016 Search PubMed.
- S. Kurtz and T. Perry, J. Appl. Phys., 1968, 39, 3798–3813 CrossRef CAS.
- L. Bayarjargal, C.-J. Fruhner, N. Schrodt and B. Winkler, Phys. Earth Planet. Inter., 2018, 281, 31–45 CrossRef CAS.
- P. Hohenberg and W. Kohn, Phys. Rev. B: Solid State, 1964, 136, 864–871 CrossRef.
- S. J. Clark, M. D. Segall, C. J. Pickard, P. J. Hasnip, M. J. Probert, K. Refson and M. C. Payne, Z. Kristallogr., 2005, 220, 567–570 CAS.
- J. P. Perdew, K. Burke and M. Ernzerhof, Phys. Rev. Lett., 1996, 77, 3865–3868 CrossRef CAS PubMed.
- K. Lejaeghere, G. Bihlmayer, T. Björkman, P. Blaha, S. Blügel, V. Blum and D. Caliste, et al. , Science, 2016, 351, aad3000-1–aad3000-7 CrossRef PubMed.
- H. J. Monkhorst and J. D. Pack, Phys. Rev. B: Solid State, 1976, 13, 5188–5192 CrossRef.
- S. Grimme, J. Antony, S. Ehrlich and H. Krieg, J. Chem. Phys., 2010, 132 CrossRef CAS PubMed , 154104(1–19).
- K. Refson, P. R. Tulip and S. J. Clark, Phys. Rev. B: Condens. Matter Mater. Phys., 2006, 73 CrossRef CAS , 155114(1–12).
- K. Miwa, Phys. Rev. B: Condens. Matter Mater. Phys., 2011, 84 CAS , 094304(1–13).
- (a) S.-P. Guo, Y. Chi and G.-C. Guo, Coord. Chem. Rev., 2017, 335, 44–57 CrossRef CAS; (b) J. Chen, C. L. Hu, F. Kong and J. G. Mao, Acc. Chem. Res., 2021, 54, 2775–2783 CrossRef CAS PubMed.
- H. D. Flack, Helv. Chim. Acta, 2003, 86, 905–921 CrossRef CAS.
- (a) B. Neumüller, C. Lau and K. Dehnicke, Z. Anorg. Allg. Chem., 1996, 622, 1847–1853 CrossRef; (b) J. Beck and T. Schlörb, Z. Kristallogr., 1999, 214, 780–785 CrossRef CAS.
- (a) B. A. Stork-Blaisse and C. Romers, Acta Crystallogr., Sect. B: Struct. Crystallogr. Cryst. Chem., 1971, 27, 386–392 CrossRef CAS; (b) V. B. Rybakov, L. A. Aslanov, S. V. Volkov, Z. A. Fokina and N. I. Timoshchenko, Zh. Neorg. Khim., 1991, 36, 2541–2548 CAS.
- P. Jones, D. Jentsch and E. Schwarzmann, Z. Naturforsch., B: Anorg. Chem., Org. Chem., 1986, 41, 1483–1484 CrossRef.
- S. I. Troyanov, T. Krahl and E. Kemnitz, Z. Kristallogr., 2004, 219, 88–92 CAS.
- A. Ashkin, G. D. Boyd and D. A. Kleinman, Appl. Phys. Lett., 1965, 6, 179–180 CrossRef CAS.
- M. A. Bonnin, L. Bayarjargal, S. Wolf, V. Milman, B. Winkler and C. Feldmann, Inorg. Chem., 2021, 60, 15653–15658 CrossRef CAS PubMed.
Footnote |
| † Electronic supplementary information (ESI) available. CCDC 2216148 and 2216149. For ESI and crystallographic data in CIF or other electronic format see DOI: https://doi.org/10.1039/d2qi02677e |
| This journal is © the Partner Organisations 2023 |