 Open Access Article
Creative Commons Attribution 3.0 Unported Licence
Ethyl ester/acyl hydrazide-based aromatic sulfonamides: facile synthesis, structural characterization, electrochemical measurements and theoretical studies as effective corrosion inhibitors for mild steel in 1.0 M HCl†
Mahmoud A. Bedair *ab,
Ahmed M. Abuelela*a,
Mubark Alshareef
 *c,
Medhat Owdaa and
Essam M. Eliwaa
aDepartment of Chemistry, Faculty of Science (Men's Campus), Al-Azhar University, Nasr City 11884, Cairo, Egypt. E-mail: m_bedier@azhar.edu.eg; m_bedier@yahoo.com; ahmed.abuelela@azhar.edu.eg
bCollege of Science and Arts, University of Bisha, P.O. Box 101, Al-Namas 61977, Saudi Arabia. E-mail: mbedair@ub.edu.sa
cDepartment of Chemistry, Faculty of Applied Science, Umm Al Qura University, Makkah 24230, Saudi Arabia. E-mail: mmshreef@uqu.edu.sa
First published on 20th December 2022
Abstract
In this research paper, aromatic sulfonamide-derived ethyl ester (p-TSAE) and its acyl hydrazide (p-TSAH) were directly synthesized, characterized, and employed for the first time as prospective anticorrosive agents to protect mild steel in 1.0 M HCl conditions. The corrosion efficiency was probed by electrochemical methods including polarization, impedance, and frequency modulation measurements. Optimal efficiencies of 94% and 92% were detected for the hydrazide and ester, respectively, revealing excellent corrosion inhibition. Moreover, both the hydrazide and ester molecules combat the cathodic and anodic reactions correspondingly in a mixed-type manner. The electron transfer (ET) at the inhibitor/metal interface was evaluated using DFT at the B3LYP/6-31g(d,p) level. Natural bond orbital analysis (NBO) and frontier molecular orbital analysis (FMO) calculations showed superior capabilities of the synthesized inhibitors to easily reallocate charge into the metal surface. However, the hydrazide molecules showed slightly better inhibition efficiency than the ester due to the strong interaction between the lone pairs of the nitrogen atoms and the d-orbitals of the metal. The chemical hardness of the hydrazide and ester are 2.507 and 2.511 eV, respectively, in good accordance with the recorded electrochemical inhibition efficiencies for both molecules. Good and straightforward correlations between the experiments and calculations are obtained.
1. Introduction
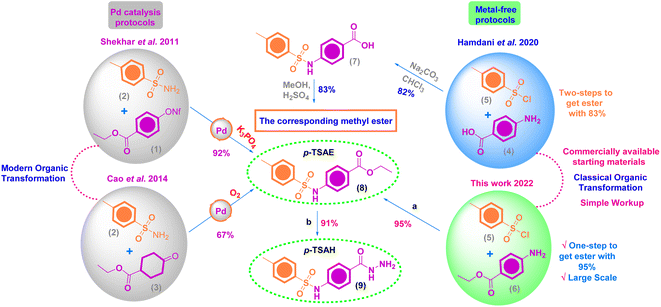
Organic molecules are widely used as effective corrosion inhibitors for mild steel in aqueous media as they are rich in adsorption centers, i.e. hetero atoms (O, N and S), and a small amount of the inhibitor can provide a high inhibition efficiency, which makes it cost effective.1–3 The rate of both cathodic and anodic corrosion reactions at the metal/solution interface can be suppressed to a high extent by the mutual interactions between the metal surface and the organic film, which are governed by an adsorption mechanism.4,5 While the rate of corrosion can be probed by electrochemical methods such as electrochemical impedance spectroscopy, electrochemical frequency modulation and potentiodynamic polarization, the metal–inhibitor interactions can be probed by theoretical calculations.6,7Aromatic/heterocyclic sulfonamides are a broad collection of privileged organic sulfur motifs that have received a lot of interest in the pharmaceutical industry as drugs and potential therapeutic candidates.8 In 2020, Mondal and Malakar documented in their review article the advanced protocols for the chemical synthesis of sulfonamides and their important synthetic and biological implementations.9 More recently, Iakovenko et al. (2022) described a novel approach for the synthesis of N-alkyl heteroaryl sulfonamides in good yields via the direct oxidative coupling of readily available heterocyclic thiols and primary amines under mild conditions.10 This landmark work has been extended to transform the prior products to the corresponding N,N-dialkyl heteroaryl sulfonamides through a microwave-assisted Fukuyama–Mitsunobu alkylation reaction.10 In 2021, Mkrtchyan and Iaroshenko reported a successful mechanochemical strategy to construct diverse aromatic sulfonamides by the Pd-mediated one-pot coupling transformation of K2S2O5 (a source of SO2) and amines with aryl bromides or aromatic carboxylic acids as arylation reagents.11
Abd El-Lateef's (2020) study showed that a new salicylidene isatin hydrazone sodium sulfonate inhibits the corrosion of carbon steel (CS) in 1.0 M HCl by up to 87.8%, and when merged with nickel (Ni2+) cations, the inhibition ability was increased up to 99.2%.12 In 2021, Verma and his colleagues13 reported the synthesis and characterization of three N-hydroxybenzothioamide analogues that exhibited inhibition efficiencies of over 90% at concentrations of 300 ppm. In March 2021, Abd El-Lateef et al.'s published article14 described the construction of a new hydrazide–hydrazone and its metal complexes with Zn(II) and ZrO(II), derived from nicotinic acid hydrazide and salicylaldehyde-5-sodium sulfonate salt. Chelate-based ZrO showed the best anti-corrosive potency with an efficacy reaching 97.4% at a dose of 5 × 10⁻⁴ mol L−1. In fact, several hydrazides and hydrazones have attracted a high level of attention in corrosion studies recently, as shown in Table 1.15–22 This table shows a comparison of recent reports and currently investigated compounds as corrosion inhibitors for mild steel in 1.0 M HCl, of which our investigated compounds show significant and promising efficiencies compared to the other published compounds.
| Inhibitor | Conc. | Metal substrate | Corrosive media | Temp. | Inhibition efficiencya (%) | Ref. |
|---|---|---|---|---|---|---|
| a Inhibition efficiencies (%) are tabulated according to the electrochemical impedance spectroscopy (EIS) measurements. | ||||||
| Acyl hydrazide–hydrazones containing acetophenone moiety | 300 mg L−1 | Mild steel | 1.0 M HCl | 308 K | 85.58–85.73 | 15 |
| Acyl hydrazide–hydrazones containing diphenylamine moiety | 5 × 10⁻³ mol L−1 | Mild steel | 1.0 M HCl | 303 K | 84.0–95.0 | 16 |
| Acyl hydrazide–hydrazones containing pyridinium salt | 1 × 10⁻³ mol L−1 | Mild steel | 1.0 M HCl | 298 K | 88.8–92.3 | 17 |
| Acyl hydrazide–hydrazones containing pyrazole moiety | 1 × 10⁻³ mol L−1 | Mild steel | 1.0 M HCl | 298 K | 75.7–93.0 | 18 |
| Acyl hydrazide–hydrazones containing naphthalene moiety | 5 × 10⁻³ mol L−1 | Mild steel | 1.0 M HCl | 303 K | 90.0–95.0 | 19 |
| Acyl hydrazides containing indole moiety | 1 × 10⁻³ mol L−1 | Mild steel | 0.5 M HCl | 303 K | 74.3–97.0 | 20 |
| Diacyl hydrazide–hydrazones containing ethanoanthracene moiety | 1 × 10⁻⁴ mol L−1 | N80 steel | 3.5% NaCl | 25 °C | 91.6–92.2 | 21 |
| Diacyl hydrazide–hydrazone–derived cationic gemini surfactant | 1 × 10⁻⁴ mol L−1 | X-65 steel | 1.0 M HCl | 25 °C | 91.44 | 22 |
| Acyl hydrazide containing sulfonamide moiety (p-TSAH) | 1.00 × 10⁻³ M | Mild steel | 1.0 M HCl | 25 °C | 93.73 | This study |
A combination of the hydrazide functional group and sulfur-containing compounds such as sulfonamides for application as corrosion inhibitors is rare in the literature, indicating a gap that needs to be filled. According to the best of our information, there is one research article, published in 2020 by Laggoun and co-authors, who described the protection impact of p-toluenesulfonyl hydrazide (p-TSH) on the copper surface in a 0.5 M HCl medium.23 In a promising result, p-TSH successfully blocked the corrosion sites on the copper surface with an approximate inhibition efficiency of 90% at 5 mM. Consequently, this finding encouraged us to synthesize ethyl 4-(4-methylphenylsulfonamido)benzoate (p-TSAE, 8) and 4-(4-methylphenyl-sulfonamido)benzohydrazide (p-TSAH, 9), and utilize them for the first time ever as potential anticorrosive agents to protect mild steel under acidic conditions due to 1.0 M HCl. We used DFT calculations with the B3LYP method and 6-31g(d,p) basis set to obtain molecular reactivity parameters on both the molecular and atomic levels. New and promising findings were obtained relating the molecular aspects of the synthesized inhibitors to mutual inhibitor–metal interactions.
2. Experimental and computational details
2.1 Materials and instrumental techniques
For the chemical synthesis, starting materials and reagents were obtained from commercial sources, particularly Acros Organics™ (Geel, Belgium), and used without further purification unless otherwise indicated. Solvents were obtained from Thermo Fisher Scientific™ and employed without additional purification. All reactions were carried out in oven-dried glassware. The purity of the synthesized compounds was investigated by TLC and performed on Merck precoated silica gel 60 F254 aluminum sheets with a solvent mixture of DCM–MeOH (99–1) as the eluent system. Spots were visualized under UV illumination at 254 nm. Chemical synthesis procedures were not optimized. Compound names are derived from ChemOffice Suite 2021 v21.0.0.28 and are not necessarily identical to those according to IUPAC nomenclature. Schemes were produced by the same version of ChemOffice. IR and MS data were plotted by OriginPro 2021. NMR spectra were delineated via MestReNova v12.0.2.Melting points were determined on a SMP50 Digital APP (Bibby Scientific, Staffordshire, UK) 120/230 V, in open capillaries and are uncorrected. The mid-IR spectra (KBr, ν/cm−1) were recorded on a CARY 630 FT-IR spectrophotometer (Agilent, Santa Clara, CA, USA). NMR spectra (1H NMR and 13C NMR) were recorded on a Bruker EX-500 MHz (1H: 500 MHz, 13C: 125 MHz) spectrometer (Bruker, USA) at room temperature. Tetramethylsilane (TMS) was used for internal calibration (1H NMR and 13C NMR: 0.00 ppm). Chemical shifts were reported in parts per million (ppm) on the δ scale and relative to residual solvent peaks (DMSO-d6: 1H: 2.50 ppm, 13C: 39.5 ppm). Coupling constants (J) are reported in Hz with the following abbreviations used to indicate splitting: s = singlet, d = doublet, t = triplet, q = quartet, m = multiplet, br = broad signal. Electron ionization mass spectra (EI-MS) were obtained using a GC MS-QP 2010 plus mass spectrometer (Shimadzu, Kyoto, Japan) at an electron voltage of 70 eV, with a time of 10 min, scan speed of 1000, and m/z range of 50–500.
2.2 Synthesis and characterization measurements
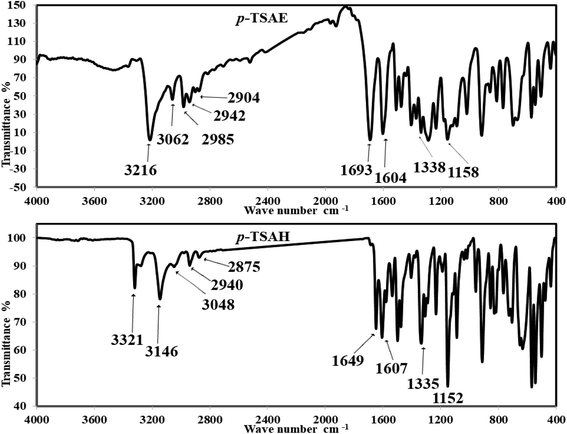
 Off-white amorphous solid; yield: 95%; mp 205 °C (lit. mp 202–206 °C (ref. 24)); mid FT-IR (KBr, ν/cm−1) 3216 (N–H stretching), 3062, 2985 (aromatic C–H stretching), 2942, 2904 (aliphatic C–H stretching), 1693 (ester C
![[double bond, length as m-dash]](https://www.rsc.org/images/entities/i_char_e001.gif) O stretching), 1604 (C
O stretching), 1604 (C![[double bond, length as m-dash]](https://www.rsc.org/images/entities/i_char_e001.gif) C stretching), 1511 (N–H bending), 1477 (aliphatic C–H bending), 1338 (asym. O
C stretching), 1511 (N–H bending), 1477 (aliphatic C–H bending), 1338 (asym. O![[double bond, length as m-dash]](https://www.rsc.org/images/entities/i_char_e001.gif) S
S![[double bond, length as m-dash]](https://www.rsc.org/images/entities/i_char_e001.gif) O stretching), 1288 (aromatic amine C–N stretching), 1234 (aromatic ester C–O stretching), 1158 (sym. O
O stretching), 1288 (aromatic amine C–N stretching), 1234 (aromatic ester C–O stretching), 1158 (sym. O![[double bond, length as m-dash]](https://www.rsc.org/images/entities/i_char_e001.gif) S
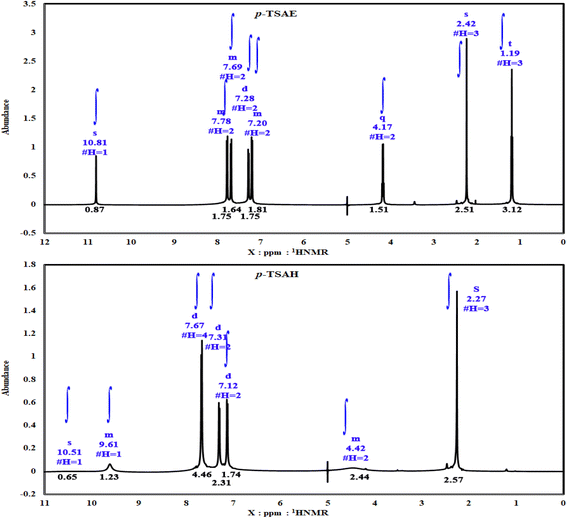
S![[double bond, length as m-dash]](https://www.rsc.org/images/entities/i_char_e001.gif) O stretching); 1H NMR (500 MHz, DMSO-d6, ppm) δ 10.81 (s, 1H, NH), 7.80–7.76 (m, 2H, ArCH), 7.71–7.67 (m, 2H, ArCH), 7.28 (d, J = 8.0 Hz, 2H, ArCH), 7.22–7.19 (m, 2H, ArCH), 4.17 (q, J = 7.1 Hz, 2H, ester CH2), 2.24 (s, 3H, ArCH3), 1.19 (t, J = 7.1 Hz, 3H, ester CH3). 13C NMR (125 MHz, DMSO, ppm) δ 165.66 (ester C
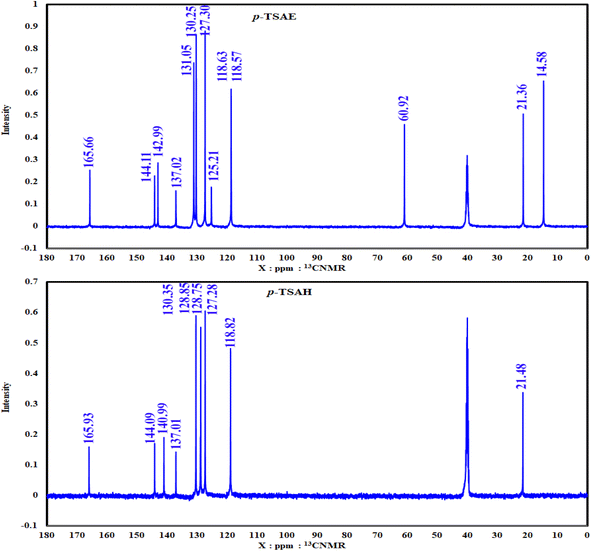
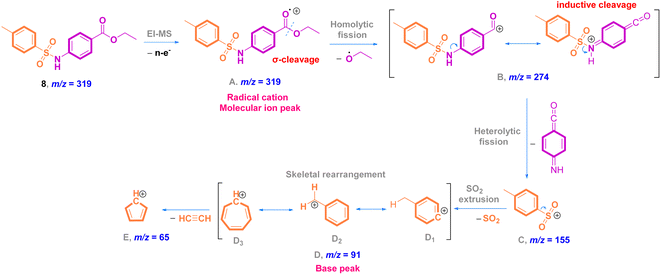
O stretching); 1H NMR (500 MHz, DMSO-d6, ppm) δ 10.81 (s, 1H, NH), 7.80–7.76 (m, 2H, ArCH), 7.71–7.67 (m, 2H, ArCH), 7.28 (d, J = 8.0 Hz, 2H, ArCH), 7.22–7.19 (m, 2H, ArCH), 4.17 (q, J = 7.1 Hz, 2H, ester CH2), 2.24 (s, 3H, ArCH3), 1.19 (t, J = 7.1 Hz, 3H, ester CH3). 13C NMR (125 MHz, DMSO, ppm) δ 165.66 (ester C![[double bond, length as m-dash]](https://www.rsc.org/images/entities/char_e001.gif) O), 144.11 (quat-C-CH3), 142.99 (quat-C-NH), 137.02 (quat-C-SO2), 131.05 (ArCH), 130.25 (ArCH), 127.30 (ArCH), 125.21 (quat-C-COOEt), 118.63 (ArCH), 118.57 (ArCH), 60.92 (ester CH2), 21.36 (ArCH3), 14.58 (ester CH3); EI-MS for C16H17NO4S [M]+ m/z (%): 319 (30), 274, 226, 182, 155, 92, 91 (100), 65.
O), 144.11 (quat-C-CH3), 142.99 (quat-C-NH), 137.02 (quat-C-SO2), 131.05 (ArCH), 130.25 (ArCH), 127.30 (ArCH), 125.21 (quat-C-COOEt), 118.63 (ArCH), 118.57 (ArCH), 60.92 (ester CH2), 21.36 (ArCH3), 14.58 (ester CH3); EI-MS for C16H17NO4S [M]+ m/z (%): 319 (30), 274, 226, 182, 155, 92, 91 (100), 65.
 Colorless amorphous solid; yield: 91%; mp 272–274 °C (lit. mp 270–272 °C (ref. 26)); mid FT-IR (KBr, ν/cm−1) 3321, 3279 (NH2 stretching), 3146 (N–H stretching), 3048, 2940 (aromatic C–H stretching), 2875 (aliphatic C–H stretching), 1649 (hydrazide C
![[double bond, length as m-dash]](https://www.rsc.org/images/entities/i_char_e001.gif) O stretching), 1607 (C
O stretching), 1607 (C![[double bond, length as m-dash]](https://www.rsc.org/images/entities/i_char_e001.gif) C stretching), 1579, 1536 (N–H bending), 1476 (aliphatic C–H bending), 1335 (asym. O
C stretching), 1579, 1536 (N–H bending), 1476 (aliphatic C–H bending), 1335 (asym. O![[double bond, length as m-dash]](https://www.rsc.org/images/entities/i_char_e001.gif) S
S![[double bond, length as m-dash]](https://www.rsc.org/images/entities/i_char_e001.gif) O stretching), 1292 (aromatic amine C–N stretching), 1152 (sym. O
O stretching), 1292 (aromatic amine C–N stretching), 1152 (sym. O![[double bond, length as m-dash]](https://www.rsc.org/images/entities/i_char_e001.gif) S
S![[double bond, length as m-dash]](https://www.rsc.org/images/entities/i_char_e001.gif) O stretching); 1H NMR (500 MHz, DMSO-d6, ppm) δ 10.51 (s, 1H, NH), 9.63–9.59 (m, 1H, NH), 7.67 (dd, J = 8.2, 2.6 Hz, 4H, ArCH), 7.31 (d, J = 8.0 Hz, 2H, ArCH), 7.12 (d, J = 8.5 Hz, 2H, ArCH), 4.45–4.38 (m, 2H, NH2), 2.27 (s, 3H, ArCH3); 13C NMR (126 MHz, DMSO, ppm) δ 165.93 (hydrazide C
O stretching); 1H NMR (500 MHz, DMSO-d6, ppm) δ 10.51 (s, 1H, NH), 9.63–9.59 (m, 1H, NH), 7.67 (dd, J = 8.2, 2.6 Hz, 4H, ArCH), 7.31 (d, J = 8.0 Hz, 2H, ArCH), 7.12 (d, J = 8.5 Hz, 2H, ArCH), 4.45–4.38 (m, 2H, NH2), 2.27 (s, 3H, ArCH3); 13C NMR (126 MHz, DMSO, ppm) δ 165.93 (hydrazide C![[double bond, length as m-dash]](https://www.rsc.org/images/entities/char_e001.gif) O), 144.09 (quat-C-CH3), 140.99 (quat-C-NH), 137.01 (quat-C-SO2), 130.35 (quat-C-CONHNH2), 128.85 (ArCH), 128.75 (ArCH), 127.28 (ArCH), 118.82 (ArCH), 21.48 (ArCH3); EI-MS for C14H15N3O3S [M + 2]+ m/z (%): 307 (7), 295, 241, 196, 162, 108, 92, 91 (100), 63.
O), 144.09 (quat-C-CH3), 140.99 (quat-C-NH), 137.01 (quat-C-SO2), 130.35 (quat-C-CONHNH2), 128.85 (ArCH), 128.75 (ArCH), 127.28 (ArCH), 118.82 (ArCH), 21.48 (ArCH3); EI-MS for C14H15N3O3S [M + 2]+ m/z (%): 307 (7), 295, 241, 196, 162, 108, 92, 91 (100), 63.
2.3 Electrochemical measurements
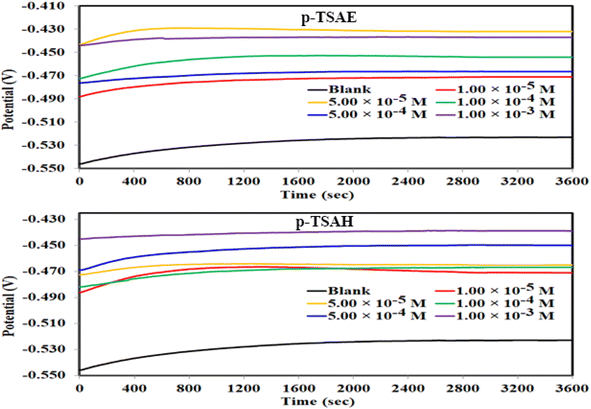
A three-electrode cell containing a fresh 100 ml aerated solution of 1.00 M HCl with/without different concentrations of the synthesized inhibitors was first left for 1 h to obtain a steady state open circuit potential. After the solution had reached the open circuit potential (EOCP), three consecutive electrochemical techniques, electrochemical frequency modulation (EFM), electrochemical impedance spectroscopy (EIS) and potentiodynamic polarization (PDP) were conducted at a temperature of 303.15 K. The first cell electrode was a mild steel working electrode (WE), with a total exposed surface area of 1 cm2 and elemental composition of 97.929% Fe, 0.330% C, 0.030% Mo, 0.836% Mn, 0.043% Al, 0.389% Si, 0.157% Cr, 0.033% S, 0.075% Ni, 0.014% Co, 0.149% Cu, and 0.015% W. The second electrode was a graphite counter electrode (CE), and the third was the saturated calomel electrode (SCE) as a reference electrode. The investigated inhibitor concentrations were 1.00 × 10⁻⁵, 5.00 × 10⁻⁵, 1.00 × 10⁻⁴, 5.00 × 10⁻⁴ and 1.00 × 10⁻³ M. EFM was achieved by applying 2 Hz and 5 Hz frequencies, with a base frequency of 0.1 Hz, and a perturbation signal of 10 mV, for 16 cycles of repeated sinusoidal waveform. The highest frequency should be at least twice the lower one, and slow enough to eliminate the double layer charging contribution to the current response. EIS measurements were carried out at the OCP in a frequency range from 1.0 × 10⁵ to 1.0 × 10⁻¹ Hz using 10 mV as the AC sinusoidal perturbation. PDP tests were carried out from −500 mV to 500 mV against the OCP with a sweeping rate of 0.5 mV s−1. Prior to each experiment, the WE was grounded with Si–C paper (300–800 grit), washed with fresh double distilled water, degreased with acetone, and dried. A Gamry REF 3000 potentiostat/galvanostat/Zra instrument was used for the measurements and the Echem Analyst 7.8.2 program for analysis, fitting and graphing of the data.2.4 Surface examination by SEM and XPS
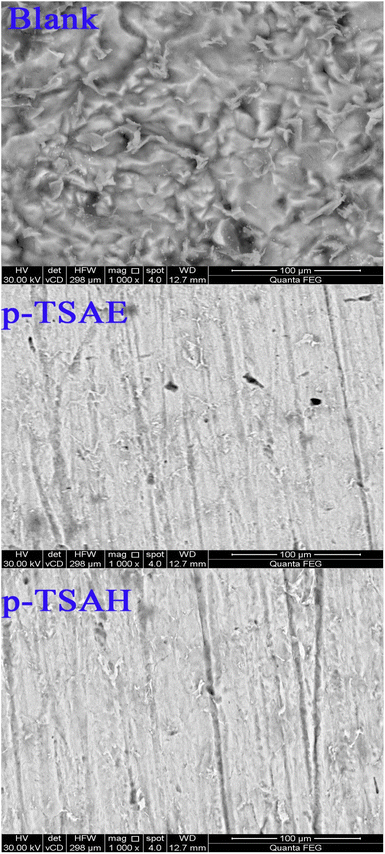
Scanning electron microscopy (SEM) and X-ray photoelectron spectroscopy (XPS) were used to examine the appearance of the mild steel surface, and therefore the element properties after immersion in the corrosive solution for 24 h with and without the addition of p-TSAE and p-TSAH molecules. SEM tests were done on an SEM, JOEL, JSM-T20, Japan instrument with an acceleration voltage of 30.00 kV and a magnification of 1000 times. XPS was carried out on a Scienta Omicron Nanotechnology instrument, Germany.2.5 Theoretical models
The geometries of the synthesized molecules in three dimensions were built using the Gaussview 6 (ref. 27) cartesian coordinates builder and were optimized following the convergence criteria of the Gaussian 09 software package.28 The theoretical procedure included Becke-style 3-parameter density functional theory using the Lee–Yang–Parr correlation functional, B3LYP, which was of reasonable computational cost for the specified molecules.29–31 The convergence was reached at a maximum force of 0.1 × 10⁻⁵ and displacement of 1.6 × 10⁻⁵, while the thresholds for energy and displacement were 45 × 10−5 and 180 × 10−5, respectively. The molecular orbitals were represented by the Gaussview 6 MO editor to accurately approximate the exact orbital densities. The frontier molecular orbital surfaces were adjusted to an isovalue of 0.02 and density of 0.0004 and presented as mesh surfaces using the molecular editor of Gaussview 6.27 The natural bond orbital surfaces were obtained using NBO version 3.1 (ref. 32) incorporated in the Gaussian 09 package. The NBO surfaces were extracted using the same edits as for the frontier molecular orbitals to accurately compare them. The parameters accounting for global reactivity were calculated using the HOMO and LUMO eigenvalues obtained from the DFT calculation.33 The structures were then used in a single point calculation to obtain the molecule energies, charges and populations using Hirshfeld surface analysis, in which there was a neutral molecule, singly-charged cation and singly-charged anion, in order to perform local reactivity analysis using Fukui functions. The closed shell model in Gaussian 09 forces each electron pair, in neutral molecules, into a single spatial orbital, while switching to the open shell model, to treat electrons spin up and spin down, in charged molecules.Monte Carlo (MC) simulation was used to investigate the interactions of p-TSAE and p-TSAH with the mild steel surface. The adsorption locator module of the Materials Studio 2017 software was utilized to examine how these molecules interacted with the Fe (110) surface.34 The COMPASS force field was used in all system adsorption computations. To verify that a sufficient depth was obtained, a crystal of Fe (110), with an edge of 30 Å, was built. This crystal was subsequently magnified to form a supercell (11 × 11). The optimal structures of p-TSAE and p-TSAH were investigated in order to find the most stable adsorption configurations on the Fe (110) surface in the neutral and protonated forms in the gas phase and in the presence of water and HCl molecules.
3. Results and discussion
3.1 Synthesis and characterization of inhibitors
![[double bond, length as m-dash]](https://www.rsc.org/images/entities/char_e001.gif) O and C
O and C![[double bond, length as m-dash]](https://www.rsc.org/images/entities/char_e001.gif) C stretching vibrations. The O
C stretching vibrations. The O![[double bond, length as m-dash]](https://www.rsc.org/images/entities/char_e001.gif) S
S![[double bond, length as m-dash]](https://www.rsc.org/images/entities/char_e001.gif) O stretching bands are observed at 1338 and 1158 cm−1 (ref. 26) (Fig. 1). The solid mode IR spectrum of acyl hydrazide 9 shows new frequencies, one of which is a slightly split medium band at 3321 and 3279 cm−1 due to NH2 vibration, and the other a medium band at 3146 cm−1, arising from N–H stretching. Moving to the double bond region, we detect two medium bands at 1649 and 1607 cm−1, which are probably attributable to the acyl hydrazide C
O stretching bands are observed at 1338 and 1158 cm−1 (ref. 26) (Fig. 1). The solid mode IR spectrum of acyl hydrazide 9 shows new frequencies, one of which is a slightly split medium band at 3321 and 3279 cm−1 due to NH2 vibration, and the other a medium band at 3146 cm−1, arising from N–H stretching. Moving to the double bond region, we detect two medium bands at 1649 and 1607 cm−1, which are probably attributable to the acyl hydrazide C![[double bond, length as m-dash]](https://www.rsc.org/images/entities/char_e001.gif) O and aromatic C
O and aromatic C![[double bond, length as m-dash]](https://www.rsc.org/images/entities/char_e001.gif) C moieties. Upon comparison with ester 8, O
C moieties. Upon comparison with ester 8, O![[double bond, length as m-dash]](https://www.rsc.org/images/entities/char_e001.gif) S
S![[double bond, length as m-dash]](https://www.rsc.org/images/entities/char_e001.gif) O shows two similar bands with slight differences at 1335 and 1152 cm−1 (ref. 26) (Fig. 1).
O shows two similar bands with slight differences at 1335 and 1152 cm−1 (ref. 26) (Fig. 1).
As shown in the 1D 1H NMR spectrum of acyl hydrazide derivative 9 (Fig. 2), the sulfonamide NH is slightly shielded at δ 10.51 ppm and a new peak corresponding to the hydrazide group –CONHNH2 is present at δ 9.61 ppm, confirming the successful hydrazinolysis step.26 The typical AA′XX′ pattern of two 1,4-disubstituted benzene rings is observed between δ 7.67 and 7.12 ppm. Prior to the aliphatic region, the NH2 group is observed as a broad singlet at δ 4.42 ppm.26 The absence of a peak corresponding to an ethyl ester group is indicative of the complete conversion of 8 to 9 via the hydrazinolysis reaction. As expected, the aromatic methyl group is shown as a singlet signal with the highest intensity at δ 2.27 ppm. Additionally, the well-analyzed 13C NMR spectrum of 9 (Fig. 3), reported for the first time, confirms the absence of the ethyl ester group, and shows the carbonyl chemical shift at δ 165.93 ppm, whilst the methyl of the tosyl fragment is shown at δ 21.48 ppm.
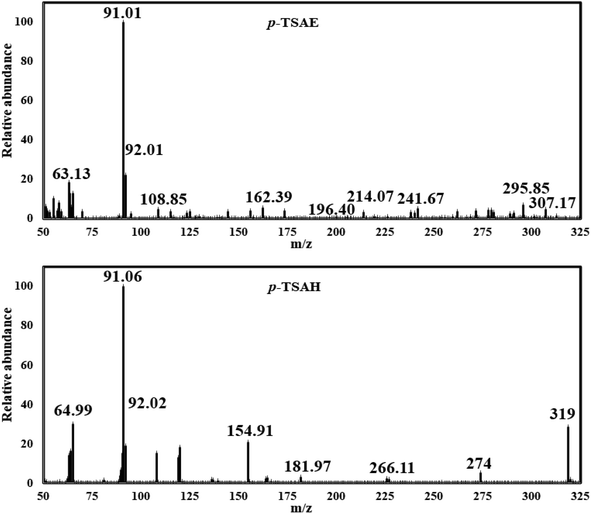
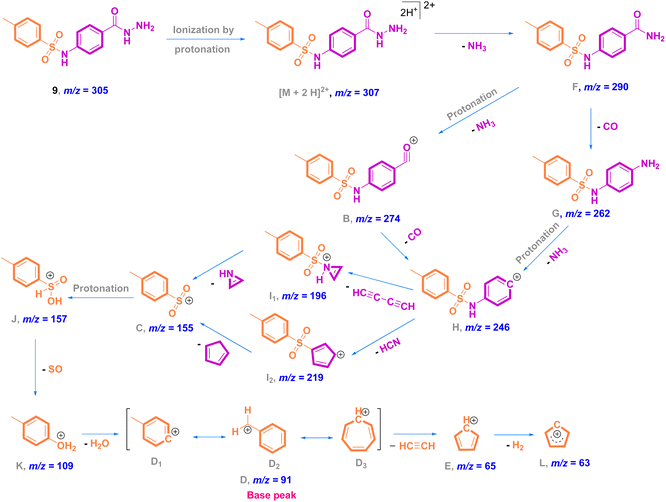
Mass analysis supported the chemical structure of 9 (non-reported) with a molecular ion peak at m/z = 307 [M + 2]+ (5%) and the p-tolyl fragment ion as the same base peak as that of 8 at m/z = 91 (100%) (Fig. 4). Ionization occurs by protonation of 9 to form the molecular ion peak at m/z = 307. Protonated hydrazide [M + 2H]2+ is fragmented to afford the corresponding amide F at m/z = 290 by elimination of NH3 (loss of 17 Da).38 Additional fragmentation of F via inductive cleavage of the C–N bond yields the corresponding acylium ion B at m/z = 274 after the loss of NH3 of 17 Da.39 Additionally, F can undergo decarbonylation (loss of CO, 28 Da) to produce amine G at m/z = 262. Both B and G may further dissociate to exhibit the prospective phenyl cation H at m/z = 246. Fragmentation of H after the neutral loss of a diacetylene gas molecule of 50 Da resulted in the formation of azirine ion I1 at m/z = 196. Additionally, H can be fragmented by the loss of HCN of 27 Da to produce another possible ion I2 at m/z = 219. Both fragment cations I1 and I2 can further disassociate to form the known ion C at m/z = 155,36,37 which upon protonation converts to cation J. The rearrangement of J drives the elimination of SO and the formation of an ion at m/z = 109,36 which dehydrates to generate the base peak at m/z = 91 (Scheme 3).37
3.2 Electrochemical measurements
 | (1) |
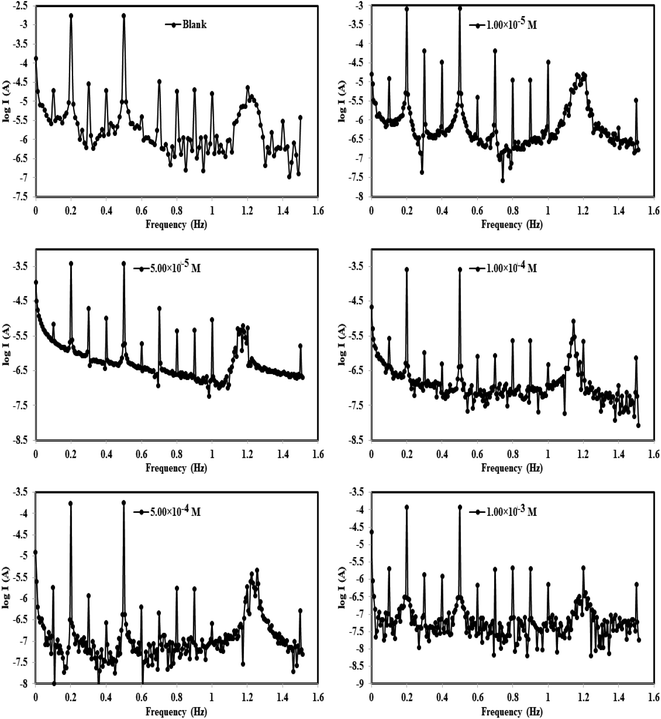 | ||
| Fig. 6 Intermodulation spectra for steel in 1.0 M HCl in the absence and presence of different concentrations of the p-TSAH compound at 30 °C. | ||
| Inhibitor name | Conc. (M) | icorr (μA cm−2) | βa (mV dec−1) | βc (mV dec−1) | CF-2 | CF-3 | k (mpy) | θ | ηEFM% |
|---|---|---|---|---|---|---|---|---|---|
| a Ecorr is the corrosion potential; icorr is the corrosion current density; βa and βc are Tafel constants for the anode and cathode; k is the corrosion rate; θ is the surface coverage; ηEFM is the inhibition efficiency. | |||||||||
| Blank | — | 2791 | 100.4 | 113.1 | 1.763 | 3.155 | 1275.00 | — | — |
| p-TSAE | 1.00 × 10⁻⁵ | 1453 | 99.04 | 186 | 2.013 | 2.853 | 664.10 | 0.4794 | 47.94 |
| 5.00 × 10⁻⁵ | 745.4 | 102.5 | 131.1 | 1.989 | 2.992 | 340.60 | 0.7329 | 73.29 | |
| 1.00 × 10⁻⁴ | 534.8 | 116.3 | 121.3 | 2.204 | 3.076 | 244.40 | 0.8084 | 80.84 | |
| 5.00 × 10⁻⁴ | 380.6 | 116.5 | 124 | 1.992 | 2.887 | 173.90 | 0.8636 | 86.36 | |
| 1.00 × 10⁻³ | 209 | 94.66 | 114.1 | 1.862 | 3.131 | 95.50 | 0.9251 | 92.51 | |
| p-TSAH | 1.00 × 10⁻⁵ | 1287 | 81.73 | 133.6 | 1.967 | 3.424 | 587.90 | 0.5389 | 53.89 |
| 5.00 × 10⁻⁵ | 599.5 | 87.95 | 120.8 | 1.986 | 3.061 | 273.90 | 0.7852 | 78.52 | |
| 1.00 × 10⁻⁴ | 463.6 | 117.6 | 120.9 | 1.982 | 3.037 | 211.80 | 0.8339 | 83.39 | |
| 5.00 × 10⁻⁴ | 303.5 | 111.4 | 115.1 | 2.074 | 3.099 | 138.70 | 0.8913 | 89.13 | |
| 1.00 × 10⁻³ | 158.6 | 84.18 | 90.8 | 1.729 | 2.975 | 72.46 | 0.9432 | 94.32 | |
The results confirmed that the high protecting ability of the p-TSAH and p-TSAE molecules approached 94.32% (p-TSAH) and 92.51% (p-TSAE) at 1.00 × 10⁻³ M. The slight difference in inhibition efficiency between the p-TSAH molecule and the p-TSAE molecule might be due to the presence of extra nitrogen atoms in the molecular skeleton of the former. This facilitates its adsorption to enhance the protection.
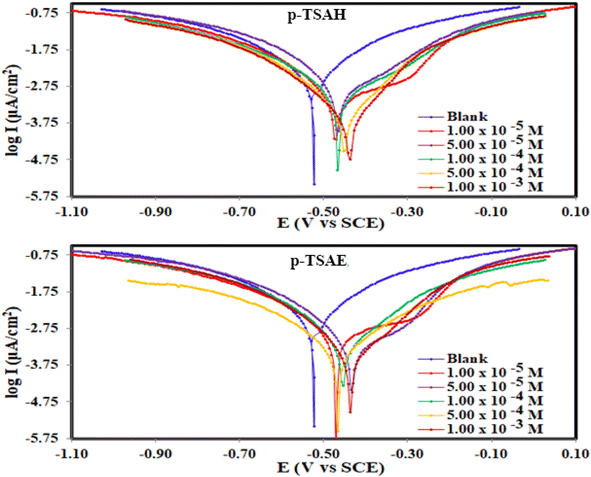 | ||
| Fig. 7 Potentiodynamic polarization curves for the corrosion of steel in 1.0 M HCl in the absence and presence of different concentrations of p-TSAH and p-TSAE compounds at 30 °C. | ||
The results derived from the Tafel plots, by fitting and extrapolation of the log current versus potential curves back to their intersections, in addition to the inhibition efficiency and surface coverage, are shown in Table 3. The data reveal that the Tafel constants (βa and βc) move to lower values when p-TSAH and p-TSAE samples are used in the corrosion systems. This suggests that p-TSAH and p-TSAE molecules contribute to the electrochemical reactions (both cathodic and anodic) through an adsorption mechanism promoting an intact metallic surface.47 Accordingly, the addition of p-TSAH or p-TSAE molecules significantly decreases the corrosion current icorr; the minimum obtained value is 580 μA cm−2 in the case of p-TSAH and 710 μA cm−2 in the case of p-TSAE at 1.00 × 10⁻³ M, Table 3. Correspondingly, Ecorr shifted to more positive values in the presence of p-TSAH or p-TSAE molecules while the difference, i.e. (ΔEcorr = |Ecorr(blank) − Ecorr(inhibitor)|), is less than 85 mV in most solutions. Therefore, a mixed type inhibition behavior of p-TSAH and p-TSAE molecules could be suggested.48 Furthermore, the tendency for passivation to take place by p-TSAH and p-TSAE is a function of icorr according to eqn (1), as described in section 3.2.2.
| Inhibitor name | Conc. (M) | Ecorr vs. SCE (mV) | icorr (μA cm−2) | βa (mV dec−1) | βc (mV dec−1) | k (mpy) | ΔEcorr (mV) | θ | ηPDP% |
|---|---|---|---|---|---|---|---|---|---|
| a Ecorr is the corrosion potential; icorr is the corrosion current density; βa and βc are Tafel constants for the anode and cathode; k is the corrosion rate; θ is the surface coverage; ηp is the inhibition efficiency. | |||||||||
| Blank | — | −523 | 8624 | 305 | 333 | 4137 | — | — | — |
| p-TSAE | 1.00 × 10⁻⁵ | −471 | 4050 | 607.8 | 572.6 | 1852 | 52 | 0.530 | 53.02 |
| 5.00 × 10⁻⁵ | −432 | 2730 | 526 | 429.2 | 1248 | 91 | 0.683 | 68.33 | |
| 1.00 × 10⁻⁴ | −454 | 1670 | 234.9 | 249.6 | 762.6 | 69 | 0.806 | 80.63 | |
| 5.00 × 10⁻⁴ | −466 | 1170 | 295.1 | 302.6 | 536 | 57 | 0.864 | 86.43 | |
| 1.00 × 10⁻³ | −437 | 710 | 183.8 | 209.4 | 324.5 | 86 | 0.918 | 91.76 | |
| p-TSAH | 1.00 × 10⁻⁵ | −471 | 3740 | 579.1 | 599.6 | 1709 | 52 | 0.566 | 56.61 |
| 5.00 × 10⁻⁵ | −465 | 2550 | 243.2 | 243.5 | 1164 | 58 | 0.704 | 70.42 | |
| 1.00 × 10⁻⁴ | −467 | 1410 | 219.4 | 232.1 | 646 | 56 | 0.836 | 83.64 | |
| 5.00 × 10⁻⁴ | −450 | 843 | 195.3 | 221.9 | 385.1 | 73 | 0.902 | 90.22 | |
| 1.00 × 10⁻³ | −439 | 580 | 177.1 | 212.8 | 265 | 84 | 0.933 | 93.27 | |
According to the data presented in Table 3, the protection abilities, or ηPDP, of p-TSAH and p-TSAE from the PDP measurements reached maxima of 93.27% (p-TSAH) and 91.76% (p-TSAE) at 1.00 × 10⁻³ M. The protection ability gradually improved upon the successive addition of either p-TSAH or p-TSAE molecules as extra molecules were adsorbed, and more of the mild steel surface was covered. The adsorbed organic layers reduced the interaction between the metallic surface and corrosive mineral acid.49 Therefore, the presence of several hetero atoms (S, N and O) in addition to donor–acceptor interactions from the aromatic conjugation π-systems to the empty d-shell of the mild steel facilitated the adsorption and increased the protection ability.
| Inhibitor | Conc. (M) | Rs (Ru) (Ω cm2) | Rct (Rp) (Ω cm2) | Q (μ Ω −1 sn cm−2) | n | Cdl (μF cm−2) | chi squared | S | α° | θ | ηz (%) |
|---|---|---|---|---|---|---|---|---|---|---|---|
| a Rs = solution resistance, Rct = charge transfer resistance, Q, n = variation parameters, Cdl = double layer capacitance, θ = surface coverage, ηz = inhibition efficiency. | |||||||||||
| Blank | — | 1.082 | 6.884 | 478.50 | 0.8836 | 225.363 | 2.25 × 10⁻² | −0.365 | −42.07 | — | — |
| p-TSAE | 1.00 × 10⁻⁵ | 1.612 | 17.15 | 366.70 | 0.8980 | 267.822 | 6.60 × 10 −3 | −0.469 | −49.87 | 0.5986 | 59.86 |
| 5.00 × 10⁻⁵ | 1.688 | 22.94 | 154.90 | 0.8780 | 97.423 | 6.83 × 10 −3 | −0.557 | −51.01 | 0.6999 | 69.99 | |
| 1.00 × 10⁻⁴ | 1.628 | 30.30 | 240.30 | 0.7819 | 115.712 | 7.86 × 10 −3 | −0.515 | −47.67 | 0.7728 | 77.28 | |
| 5.00 × 10⁻⁴ | 2.169 | 43.48 | 75.59 | 0.8570 | 42.753 | 3.34 × 10 −3 | −0.657 | −54.69 | 0.8417 | 84.17 | |
| 1.00 × 10⁻³ | 1.264 | 72.26 | 123.00 | 0.7149 | 18.702 | 1.48 × 10⁻³ | −0.580 | −50.23 | 0.9047 | 90.47 | |
| p-TSAH | 1.00 × 10⁻⁵ | 1.602 | 18.65 | 201.30 | 0.8670 | 121.667 | 6.78 × 10 −3 | −0.420 | −48.79 | 0.6309 | 63.09 |
| 5.00 × 10⁻⁵ | 1.582 | 24.6 | 218.20 | 0.8389 | 124.431 | 6.95 × 10 −3 | −0.429 | −50.02 | 0.7202 | 72.02 | |
| 1.00 × 10⁻⁴ | 1.996 | 34.33 | 109.00 | 0.8303 | 55.692 | 5.04 × 10 −3 | −0.517 | −50.63 | 0.7995 | 79.95 | |
| 5.00 × 10⁻⁴ | 1.257 | 54.29 | 479.00 | 0.7459 | 138.167 | 1.15 × 10⁻³ | −0.502 | −50.18 | 0.8732 | 87.32 | |
| 1.00 × 10⁻³ | 1.116 | 109.8 | 377.50 | 0.8446 | 210.160 | 7.65 × 10⁻⁴ | −0.746 | −65.77 | 0.9373 | 93.73 | |
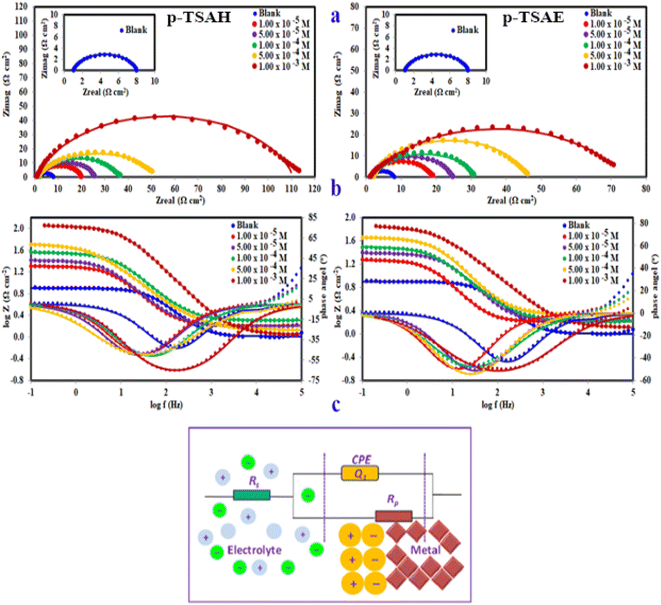
The equivalent circuit proposed for the studied systems is a physical model which demands that the model's components are attributed to a physical process in the electrochemical corrosion reaction. Accordingly, the proposed circuit model in Fig. 8 was built up using three components: two resistors, one accounting for the solution resistance (Rs) and the other accounting for the charge transfer resistance (Rct) in addition to a component with a constant phase. In general, the impedance of a constant phase element CPE (ZCPE) can be determined using the following equation:51
| ZCPE = [Q(jω)n]−1 | (2) |
While a double-layer capacitor is expected to proceed ideally, EIS experiments often do not behave ideally. In such a case, the double-layer capacitor in a real cell acts like a constant phase element (CPE).52
The capacitance of the double layer could then be determined by the following relationship:
| Cdl = [QRct1−n]1/n | (3) |
The Cdl reduction (Table 4) in the presence of p-TSAH or p-TSAE could be attributed to a decreased local dielectric constant and increased double layer thickness due to the replacement of H2O molecules adsorbed on the metallic surface by the organic inhibitors through the active sites.53 The protecting ability is related to the charge transfer resistance Rct by the relationship:
 | (4) |
When the capacitance goes down, in contrast, the impedance goes up when the connection is in series. This is a consequence of the inverse relationship between the capacitance and impedance. It can be seen in Table 4 that Rct gradually increases upon the addition of p-TSAH or p-TSAE inhibitors to reach maxima of 109.8 Ω cm2 (p-TSAH) and 72.26 Ω cm2 (for p-TSAE) at 1.00 × 10⁻³ M. The corresponding protection abilities at the same concentration are 93.73% for p-TSAH and 90.47% for p-TSAE. Overall, the EIS electrochemical outcomes support both the PDP and EFM results, which in turn promote the ability of both p-TSAH and p-TSAE molecules as candidates for effective corrosion inhibition.
Despite the limitless informative outcomes of the Nyquist Plots, they have one major shortcoming in that they cannot give any information about the frequency perturbation within the system under study. Another common representation of EIS data is the Bode plot, in which the frequency is plotted against both the absolute values of the impedance and the phase-shift (Fig. 8b). This representation provides much information about the interfacial organic layer, p-TSAH or p-TSAE molecules, adsorbed between the metallic surface and the corrosive mineral acid, and contains a single time constant that corresponds to the electrical double layer at the interface. For the blank solution curve in Fig. 8, the phase angle diverges from the standard value for a pure capacitor, which is −90°. This could be a result of frequency scattering due to the surface inhomogeneity caused by acid attack. On the other hand, the addition of either p-TSAH or p-TSAE molecules shifts the angles to more negative values away from those of the blank solution as an indication of enhanced capacitive behavior and that the surface becomes smoother upon the formation of the adsorbed organic layer. As shown in Fig. 8 and Table 4, the maximum angle deviation is −65.77° for p-TSAH and −50.23° for p-TSAE at 1.00 × 10⁻³ M. Moreover, the slopes at the middle frequencies shift much closer to the standard value of a pure capacitor of −1 (ref. 54) in the presence of both p-TSAH and p-TSAE molecules (Table 4).
3.3 Adsorption considerations
Adsorption isotherms are widely used to investigate the adsorption and protection mechanisms at the mild steel/1.0 M HCl interface. Several traditional adsorption isotherm equations were utilized to fit the results obtained from the EFM measurement of p-TSAH and p-TSAE molecules.1 The fitting data for the six adsorption models are shown in Fig. 9 and Table 5. The quality of the fitting is measured by R2 values that are close to unity. According to the R2 values, the quality of the fitting is in the order Langmuir > kinetic–thermodynamic > Flory–Huggins > Temkin > Freundlich > Frumkin. Therefore, the Langmuir model was found to be the most appropriate for the chosen EFM results. This isotherm considers that the metallic adsorbent surface is uniform (the active adsorption sites are equivalent), there is no interaction between the adsorbate (inhibitor) molecules, and the adsorption process occurs by the exchange of single adsorbed water molecules by single inhibitors.55 This isotherm is expressed as:56
 | (5) |
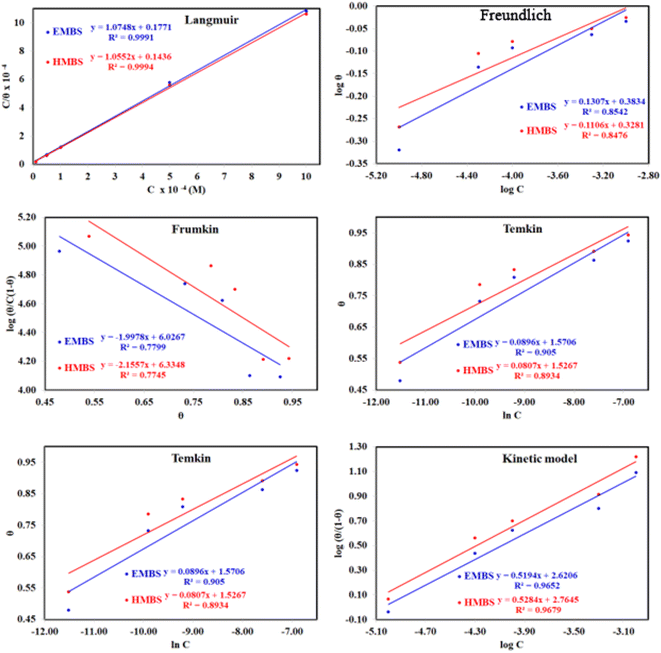 | ||
| Fig. 9 The different adsorption models for p-TSAH and p-TSAE compounds on the mild steel surface in 1.0 M HCl at 30 °C. | ||
| Adsorption isotherm model | Linear form equation | Inhibitor | Slope | Intercept | R2 | Kads, M−1 | ΔGads, kJ mol−1 |
|---|---|---|---|---|---|---|---|
| a R2 = regression correlation coefficient, K = binding constant, θ = surface coverage, c = concentration. | |||||||
| Freundlich | log![[thin space (1/6-em)]](https://www.rsc.org/images/entities/char_2009.gif) θ = log θ = log![[thin space (1/6-em)]](https://www.rsc.org/images/entities/char_2009.gif) K + 1/n K + 1/n![[thin space (1/6-em)]](https://www.rsc.org/images/entities/char_2009.gif) log log![[thin space (1/6-em)]](https://www.rsc.org/images/entities/char_2009.gif) C C |
p-TSAE | 0.13066 | 0.38343 | 0.85418 | 2.4178 | −12.34 |
| p-TSAH | 0.11061 | 0.32809 | 0.84755 | 2.1286 | −12.02 | ||
| Langmuir |  |
p-TSAE | 1.07480 | 0.00002 | 0.99906 | 56![[thin space (1/6-em)]](https://www.rsc.org/images/entities/char_2009.gif) 463 463 |
−37.68 |
| p-TSAH | 1.05515 | 0.00001 | 0.99937 | 69![[thin space (1/6-em)]](https://www.rsc.org/images/entities/char_2009.gif) 636 636 |
−38.21 | ||
| Frumkin |  |
p-TSAE | −1.99780 | 6.02670 | 0.77986 | 1.0634 × 10⁶ | −45.08 |
| p-TSAH | −2.15565 | 6.33479 | 0.77446 | 2.1617 × 10⁶ | −46.86 | ||
| Temkin |  |
p-TSAE | 10.10181 | −16.72345 | 0.90502 | 0.1910 | −5.95 |
| p-TSAH | 11.07539 | −17.87078 | 0.89339 | 0.1992 | −6.05 | ||
| Flory–Huggins |  |
p-TSAE | 2.16061 | 5.33216 | 0.95973 | 2.1486 × 10⁵ | −41.05 |
| p-TSAH | 2.06039 | 5.46038 | 0.96296 | 2.8865 × 10⁵ | −41.79 | ||
| Kinetic-thermodynamic |  |
p-TSAE | 0.51945 | 2.62065 | 0.96524 | 417.4933 | −25.32 |
| p-TSAH | 0.52835 | 2.76446 | 0.96795 | 581.3738 | −26.15 | ||
The adsorptive binding constant (Kads) is the inverse of the intercept of a c/θ vs. C plot. The Kads values are found to be 69![[thin space (1/6-em)]](https://www.rsc.org/images/entities/char_2009.gif) 636 M−1 for the p-TSAH molecule and 56
636 M−1 for the p-TSAH molecule and 56![[thin space (1/6-em)]](https://www.rsc.org/images/entities/char_2009.gif) 463 M−1 for the p-TSAE molecule. These large values of Kads are a good indicator of the strength of the adsorption process, with p-TSAH having priority over p-TSAE molecules.
463 M−1 for the p-TSAE molecule. These large values of Kads are a good indicator of the strength of the adsorption process, with p-TSAH having priority over p-TSAE molecules.
The adsorption free energy is estimated from the relationship:57
ΔGads = −RT![[thin space (1/6-em)]](https://www.rsc.org/images/entities/char_2009.gif) ln ln![[thin space (1/6-em)]](https://www.rsc.org/images/entities/char_2009.gif) 55.5Kads 55.5Kads
| (6) |
| (R = 8.314 J mol−1 K−1, T = 303.15 K, [H2O] = 55.5 mol L−1) |
ΔGads values were found to be −38.21 kJ mol−1 for the p-TSAH molecule and −37.68 kJ mol−1 for the p-TSAE molecule. The adsorption occurred in a spontaneous way as indicated from the negative values. ΔGads values can be grouped into three categories. The first is for values that are more than −20 kJ mol−1, considered as physical adsorption, which describes the electrostatic attraction between the metallic surface and the organic materials. The second category is for values less than −40 kJ mol−1, considered as chemical adsorption, which describes electron sharing from the active sites of the organic materials (lone pairs of hetero atoms, π electrons and aromatic moieties) to the empty orbitals of the metal. The third category is for values between −20 kJ mol−1 and −40 kJ mol−1, considered as mixed type.58 Our case matches with the third category as mixed type, but it is greatly shifted towards −40 kJ mol−1, so the priority is to chemical adsorption.
3.4 Surface analysis
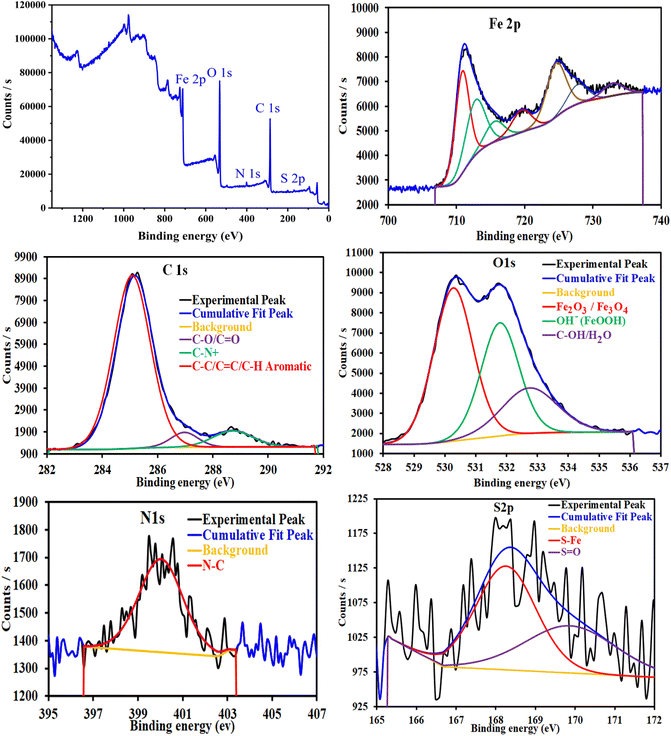
![[double bond, length as m-dash]](https://www.rsc.org/images/entities/char_e001.gif) C/C–H aromatic (285.18 eV), C–O/C
C/C–H aromatic (285.18 eV), C–O/C![[double bond, length as m-dash]](https://www.rsc.org/images/entities/char_e001.gif) O (286.97 eV) and C–N, C–N+ (288.72 eV). The N1s spectrum shows one peak at 400.03 eV, corresponding to N–C/N–H. The deconvoluted spectrum of O1s shows three bands at 530.28, 531.79 and 532.74 eV, corresponding to several iron oxides such as Fe2O3/Fe3O4/FeOOH and organic species such as C–O/C
O (286.97 eV) and C–N, C–N+ (288.72 eV). The N1s spectrum shows one peak at 400.03 eV, corresponding to N–C/N–H. The deconvoluted spectrum of O1s shows three bands at 530.28, 531.79 and 532.74 eV, corresponding to several iron oxides such as Fe2O3/Fe3O4/FeOOH and organic species such as C–O/C![[double bond, length as m-dash]](https://www.rsc.org/images/entities/char_e001.gif) O/C–OH. The S2p spectrum shows two peaks at 168.26 and 169.87 eV, corresponding to S–Fe/S
O/C–OH. The S2p spectrum shows two peaks at 168.26 and 169.87 eV, corresponding to S–Fe/S![[double bond, length as m-dash]](https://www.rsc.org/images/entities/char_e001.gif) O.
O.
3.5 Molecular reactivity
| Molecular parametersa | Mathematical formula | p-TSAH | p-TSAE |
|---|---|---|---|
| a The units used are eV except for ΔN which is a dimensionless quantity.b EHOMO and ELUMO were taken from DFT computation. | |||
| ELUMOb | — | −1.213 | −1.419 |
| EHOMOb | — | −6.228 | −6.440 |
| ΔE | (ELUMO − EHOMO) | 5.015 | 5.022 |
| Ionization potential (IP) | −EHOMO | 6.228 | 6.44 |
| Electron affinity (EA) | −ELUMO | 1.213 | 1.419 |
| Electronegativity (χ) | (IP + EA)/2 | 3.72 | 3.93 |
| Chemical potential (μ) | −χ | −3.72 | −3.93 |
| Chemical hardness (η) | (IP − EA)/2 | 2.507 | 2.511 |
| Chemical softness (σ) | 1/η | 0.399 | 0.398 |
| Electrophilicity index (ω) | χ2/2η | 2.76 | 3.075 |
| ΔN | (χmetal − χinh)/2(ηmetal + ηinh) | 1.152 | 1.109 |
The tendency of electrons to flow between the inhibitor and the metal surface can be estimated using the following equation:64
 | (7) |
A qualitative description of both the molecular and atomic reactivity can be explored further by investigating both the frontier molecular orbital and natural bond orbital densities. Fig. 12 shows the FMOs for p-TSAH and p-TSAE, specifically the HOMO and LUMO for each molecule. It shows that the HOMO of the p-TSAE molecule is delocalized mainly over the phenyl ring (attached to the ester group), and the nitrogen and oxygen atoms of the ester group, and less so over the other phenyl ring. It is worth noting the missing contribution of the sulfur atom to the HOMO of p-TSAE, while having three lone pairs with low electronegativity. This could be explained in that it is surrounded by two oxygen atoms and one nitrogen atom with higher electronegativity (N/O) (3.04/3.44) than sulfur (2.58). A fruitful synthesis of organic inhibitors then demands a delocalized distribution of hetero atoms across the molecule so that they don't cancel the donating ability of each other. The same surface density distribution stands for the HOMO of the p-TSAH molecule in Fig. 12, with a lack of electron density over the nitrogen atoms of the hydrazine group, which, instead, contributes to HOMO−1. Overall, the FMO analysis shows the priority of electron donation to the phenyl ring attached to either the ester or hydrazine group with contributions from the oxygen of the carbonyl group and the nitrogen atom at the linkage of the two aromatic rings being similar.
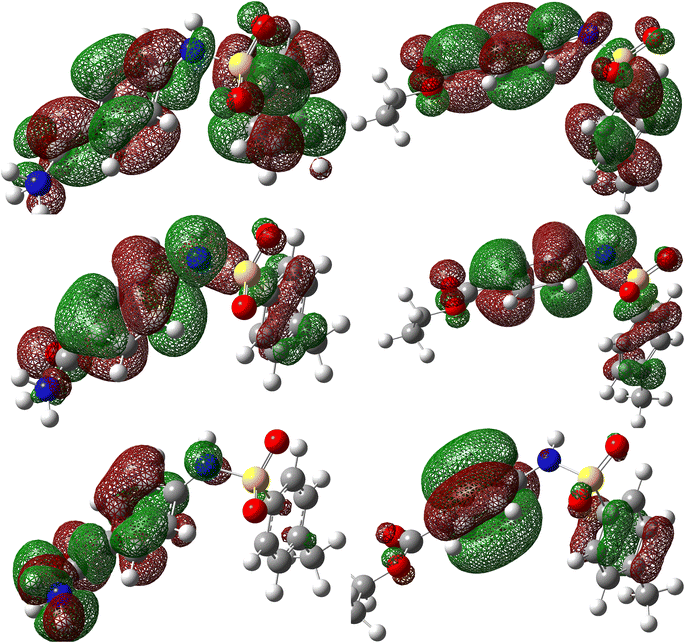 | ||
| Fig. 12 Frontier molecular orbital densities for p-TSAH (left) and p-TSAE (right); LUMO (upper), HOMO (middle), and HOMO−1 (bottom). | ||
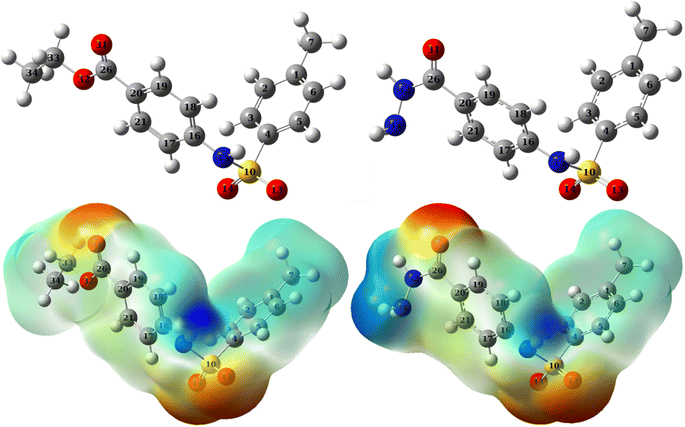
To evaluate the priority of individual atoms/groups involved in the HOMO of each molecule in sharing their electrons with the metal d-orbitals, the NBOs were analyzed.65 Tables 7 and 8 show the orbital hybridization schemes for the proposed sites of interactions ordered by the priority of the electron donating ability along with the corresponding eigenvalues in eV. In addition, atom numbering is provided in Fig. 13. The corresponding surface densities are provided in Tables S1 and S2 in the ESI† in the same order. According to Table 7, hybridizations of p-TSAH are in the following order: LP (1) C20 > LP (2) O31 > BD (2) C17–C21 > BD (2) C18–C19 > BD (2) C1–C6 > BD (2) C2–C3 > BD (2) C4–C5 > LP (1) N32 > LP (2) O13 > LP (3) O13 > LP (3) O14 > LP (2) O14 > LP (1) N15 > LP (1) N34 > BD (2) C26–O31, which corresponds to the orbitals from HOMO to HOMO−13 (Table S1†). This order corresponds to the abilities of the hybridizations to reallocate their electron density into d-orbitals of the metal; i.e. LP (1) C20 is at the top of the natural bond orbitals (HOMO), and hence the easiest donation takes place from it, followed by LP (2) O31 (HOMO−1), etc. p-TSAE shows similar donating behavior according to the sequence: LP (1) (C20) > LP (2) (O31) > BD (2) C17–C21 > BD (2) C18–C19 > BD (2) C1–C6 > BD (2) C2–C3 > BD (2) C4–C5 > LP (3) (O13) > LP (3) (O14) > LP (2) (O13) > LP (2) (O14) > LP (1) (N15) > LP (2) (O32) > BD (2) C26–O31. These hybridizations correspond to the orbitals from HOMO to HOMO−13 (Table S2†). Therefore, in both molecules most of the donating ability goes to the phenyl ring as well as the carbonyl group attached to it, followed by the other phenyl group and the oxygen atoms of the sulfonyl group. The oxygen and nitrogen atoms of the ester and hydrazine groups, respectively, show the lowest donating ability.
| Bond | Occupancy | Energy | NBO | s % (atom 1) | p % (atom 1) | s % (atom 2) | p % (atom 2) |
|---|---|---|---|---|---|---|---|
| LP (1) C20 | 1.057 | −0.104 | p | 0 | 99.99 | — | — |
| LP (2) O31 | 1.865 | −0.237 | p | 0 | 99.78 | — | — |
| BD (2) C17–C21 | 1.669 | −0.246 | 0.7256 p1.00 + 0.6881 p1.00 | 0.02 | 99.93 | 0 | 99.95 |
| BD (2) C18–C19 | 1.682 | −0.251 | 0.7329 p1.00 + 0.6803 p1.00 | 0.01 | 99.95 | 0 | 99.95 |
| BD (2) C1–C6 | 1.627 | −0.255 | 0.6920 p1.00 + 0.7219 p1.00 | 0.01 | 99.95 | 0 | 99.96 |
| BD (2) C2–C3 | 1.658 | −0.259 | 0.7189 p1.00 + 0.6951 p1.00 | 0 | 99.96 | 0 | 99.95 |
| BD (2) C4–C5 | 1.689 | −0.273 | 0.7500 p1.00 + 0.6614 p1.00 | 0.04 | 99.95 | 0 | 99.95 |
| LP (1) N32 | 1.758 | −0.278 | sp21.54 | 4.44 | 95.54 | — | — |
| LP (2) O13 | 1.816 | −0.287 | p | 0.07 | 99.63 | — | — |
| LP (3) O13 | 1.783 | −0.287 | p | 0.08 | 99.61 | — | — |
| LP (3) O14 | 1.772 | −0.287 | p | 0.07 | 99.62 | — | — |
| LP (2) O14 | 1.82 | −0.289 | p | 0.06 | 99.64 | — | — |
| LP (1) N15 | 1.833 | −0.314 | sp8.95 | 10.04 | 89.91 | — | — |
| LP (1) N34 | 1.962 | −0.34 | sp3.75 | 21.02 | 78.91 | — | — |
| BD (2) C26–O31 | 1.981 | −0.405 | 0.5520 sp40.39 + 0.8339 sp30.29 | 2.41 | 97.4 | 3.12 | 96.57 |
| Type | Occupancy | Energy | NBO | s % (atom 1) | p % (atom 1) | s % (atom 2) | p % (atom 2) |
|---|---|---|---|---|---|---|---|
| LP (1) C20 | 1.065 | −0.113 | p1.00 | 0 | 100 | — | — |
| LP (2) O31 | 1.849 | −0.253 | p0.99 | 0.01 | 99.74 | — | — |
| BD (2) C17–C21 | 1.671 | −0.255 | 0.7243 p + 0.6895 p | 0 | 99.94 | 0 | 99.95 |
| BD (2) C18–C19 | 1.682 | −0.258 | 0.7326 p + 0.6807 p | 0 | 99.95 | 0 | 99.95 |
| BD (2) C1–C6 | 1.625 | −0.259 | 0.6919 p + 0.7220 p | 0.01 | 99.95 | 0 | 99.96 |
| BD (2) C2–C3 | 1.657 | −0.263 | 0.7190 p + 0.6950 p | 0 | 99.96 | 0 | 99.95 |
| BD (2) C4–C5 | 1.688 | −0.278 | 0.7506 p + 0.6608 p | 0 | 99.95 | 0 | 99.95 |
| LP (3) O13 | 1.782 | −0.291 | p0.99 | 0.08 | 99.61 | — | — |
| LP (3) O14 | 1.771 | −0.291 | p0.99 | 0.06 | 99.63 | — | — |
| LP (2) O13 | 1.815 | −0.292 | p0.99 | 0.07 | 99.63 | — | — |
| LP (2) O14 | 1.819 | −0.293 | p0.99 | 0.07 | 99.63 | — | — |
| LP (1) N15 | 1.829 | −0.318 | sp9.36 | 9.65 | 90.31 | — | — |
| LP (2) O32 | 1.796 | −0.318 | p1.00 | 0 | 99.91 | — | — |
| BD (2) C26–O31 | 1.983 | −0.372 | 0.5512 p + 0.8343 p | 0 | 99.81 | 0 | 99.67 |
| f−k = [qk(N) − qk(N − 1)] | (8) |
| f+k = [qk(N + 1) − qk(N)] | (9) |
| p-TSAH | p-TSAE | ||||
|---|---|---|---|---|---|
| Atoms | f+ | f− | Atoms | f+ | f− |
| a Calculated using Hirshfeld charges at B3LYP/6-31G(d,p). | |||||
| C1 | 0.035 | 0.057 | S10 | 0.019 | 0.123 |
| O31 | 0.076 | 0.056 | O31 | 0.049 | 0.057 |
| S10 | 0.022 | 0.047 | C26 | 0.013 | 0.055 |
| O13 | 0.04 | 0.043 | C1 | 0.039 | 0.051 |
| C26 | 0.019 | 0.043 | C20 | 0.079 | 0.045 |
| C20 | 0.075 | 0.042 | C16 | 0.047 | 0.042 |
| C4 | 0.012 | 0.037 | C21 | 0.036 | 0.034 |
| C5 | 0.021 | 0.037 | O13 | 0.043 | 0.034 |
| C6 | 0.022 | 0.036 | C19 | 0.038 | 0.033 |
| C16 | 0.05 | 0.036 | C6 | 0.024 | 0.029 |
| C3 | 0.006 | 0.035 | C18 | 0.047 | 0.028 |
| C21 | 0.034 | 0.034 | C4 | 0.015 | 0.027 |
| O14 | 0.028 | 0.033 | C5 | 0.023 | 0.024 |
| C19 | 0.038 | 0.033 | O14 | 0.032 | 0.024 |
| C2 | 0.024 | 0.028 | C17 | 0.052 | 0.024 |
| C18 | 0.044 | 0.027 | C3 | 0.008 | 0.022 |
| C17 | 0.051 | 0.025 | C2 | 0.028 | 0.021 |
| N32 | 0.021 | 0.023 | O32 | 0.014 | 0.014 |
| N15 | 0.083 | 0.018 | C7 | 0.013 | 0.007 |
| C7 | 0.012 | 0.017 | C33 | 0.008 | 0.001 |
| N34 | 0.013 | 0.008 | C34 | 0.006 | −0.003 |
| — | — | — | N15 | 0.095 | −0.022 |
The electrophilic Fukui indices f− show that when a metal surface approaches p-TSAE, the S10 atom (f− = 0.123) has the largest electronic density contribution to the d-orbitals of the metal, however, on the basis of energy, because S10 orbitals come late within the NBOs, it should have a low probability of approaching the metal surface. On the other hand, phenyl rings show high electrophilic contributions to the metal surface, in agreement with the order of the NBOs, which confirms their ability to adhere to the metallic surface. The atoms of the p-TSAH molecule have close electrophilic Fukui indices to those of the atoms of p-TSAE molecule, however the nitrogen atoms of the hydrazine group of the p-TSAH molecule have the lowest electrophilic indices (N32 and N34 are 0.023 and 0.008, respectively) which confirms the electrochemical results in which p-TSAH has better corrosion inhibition than p-TSAE.
3.6 Monte Carlo simulations
MC simulations were used to identify the inhibitor molecule (p-TSAH and p-TSAE) attractions to the Fe surface as well as to offer a clear understanding of the adsorption mechanism. As a result, Fig. 14 shows that the most stable adsorption configuration for the protonated inhibitors is approximately flat. This flat and parallel orientation achieves the highest proper adsorption formations for p-TSAH and p-TSAE molecules on the Fe interface in the acidic solution, implying an enhancement in the adsorption and maximum surface coverage.68 As a result, we may conclude that p-TSAH and p-TSAE molecules prefer to interact with the Fe surface even after protonation through several functional groups, heteroatoms, and π bonds. Table 10 contains the adsorption and binding energy parameters. The results demonstrate that the examined p-TSAH and p-TSAE molecules exhibit substantial negative adsorption energy, which supports the enhanced and spontaneous inhibitory effect of these compounds on the mild steel surface. These findings suggest that the adsorbed H2O and HCl molecules on the Fe (110) surface can be gradually substituted by inhibitor molecules, resulting in the creation of a protective film between the metallic surface and the aqueous corrosive solution.69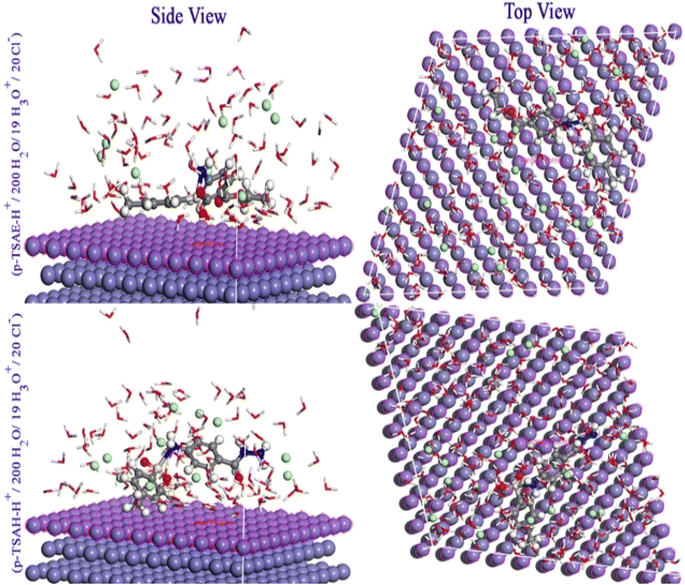 | ||
| Fig. 14 Monte Carlo simulations for the most favorable modes of adsorption obtained for p-TSAE-H+ and p-TSAH-H+ on the Fe (1 1 0) surface, side and top view. | ||
| Phase | Inhibitor | Total energy (kcal mol−1) | Adsorption energy (kcal mol−1) | Rigid adsorption energy (kcal mol−1) | Deformation energy (kcal mol−1) | (dEads/dNi) (kcal mol−1) | Binding energy (kcal mol−1) | IEa (%) |
|---|---|---|---|---|---|---|---|---|
| a Inhibition efficiency values obtained from EFM measurements. | ||||||||
| Gas phase | p-TSAE | −111.363 | −550.819 | −161.848 | −388.971 | −550.819 | 550.819 | 92.51 |
| p-TSAH | −173.753 | −622.299 | −177.272 | −445.026 | −622.299 | 622.299 | 94.32 | |
| p-TSAE-H+ | −145.089 | −734.915 | −175.178 | −559.736 | −734.915 | 734.915 | 92.51 | |
| p-TSAH-H+ | −205.944 | −752.517 | −190.172 | −562.344 | −752.517 | 752.517 | 94.32 | |
| Aqueous phase | p-TSAE | −5966.133 | −6565.058 | −6156.983 | −408.075 | −478.562 | 478.562 | 92.51 |
| p-TSAH | −5975.518 | −6583.533 | −6113.947 | −469.586 | −517.565 | 517.565 | 94.32 | |
| p-TSAE-H+ | −5939.723 | −6695.038 | −6105.430 | −589.608 | −668.719 | 668.719 | 92.51 | |
| p-TSAH-H+ | −6094.487 | −6806.550 | −6225.349 | −581.200 | −866.154 | 866.154 | 94.32 | |
3.7 The inhibition mechanism
The adsorption process on the metal interface is the key factor in determining the inhibition capacity of the organic molecules. This adsorption process includes the formation of a protective barrier layer over the metal surface, which shields it from aggressive components.70 Fig. 15 shows the adsorption modes of p-TSAH and p-TSAE in order to inhibit the mild steel corrosion in a hydrochloric acid solution. As indicated from the Langmuir isotherm model and the values of ΔG, our investigated inhibitors are mixed type between the physical and chemical adsorption modes, and the chemical mode predominates. This is in addition to the parallel adsorption configuration through multiple active sites deduced from the computational calculations. As a result, the electrons of the aromatic moieties, lone pairs of electrons on the hetero atoms (S, N and O) and π electrons (C![[double bond, length as m-dash]](https://www.rsc.org/images/entities/char_e001.gif) O and S
O and S![[double bond, length as m-dash]](https://www.rsc.org/images/entities/char_e001.gif) O), can exchange their electrons with the vacant “d” orbitals of Fe as chemical adsorption modes to limit further corrosion of the metal exposed to the corrosive solution.71 In the hydrochloric acid solution, the p-TSAH and p-TSAE molecules can be easily protonated. Thus, the electrostatic interaction between the positively charged protonated inhibitor species and the negatively charged Cl− ions (originally bonded to the steel surface) generates the physisorption mode. Furthermore, the extra electrons on the steel surface can be transferred back to the empty π* regions of the inhibitor molecules (retro-donation).72
O), can exchange their electrons with the vacant “d” orbitals of Fe as chemical adsorption modes to limit further corrosion of the metal exposed to the corrosive solution.71 In the hydrochloric acid solution, the p-TSAH and p-TSAE molecules can be easily protonated. Thus, the electrostatic interaction between the positively charged protonated inhibitor species and the negatively charged Cl− ions (originally bonded to the steel surface) generates the physisorption mode. Furthermore, the extra electrons on the steel surface can be transferred back to the empty π* regions of the inhibitor molecules (retro-donation).72
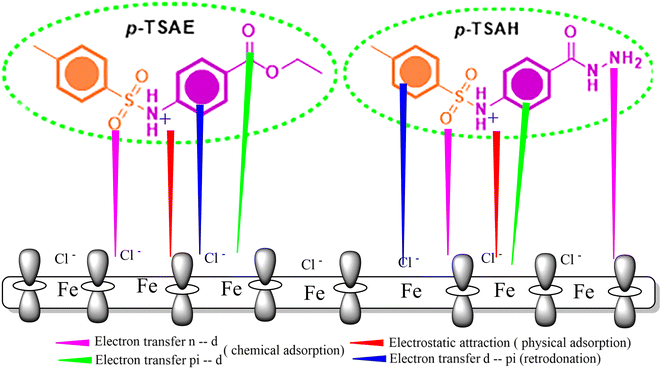 | ||
| Fig. 15 Pictorial representation of the adsorption of p-TSAE and p-TSAH on the steel surface in 1.0 M HCl. | ||
4. Conclusions
(1) The facile synthesis of two corrosion inhibitors has been achieved in a large, scalable approach based on the Hinsberg reaction, forming commercially available chemicals that can be applied in industrial applications.(2) The investigated synthesized compounds p-TSAH and p-TSAE were highly efficient inhibitors of corrosion, while p-TSAH had a better inhibition efficiency than p-TSAE in an acid medium.
(3) The adsorption of p-TSAH and p-TSAE on steel was tested against several isotherms and found to be in line with the Langmuir model.
(4) The adsorption of the compounds is of mixed type and controlled by the charge transfer mechanism.
(5) The design of organic inhibitors requires a delocalized distribution of hetero atoms across the molecule to achieve the optimal donating ability of these atoms.
(6) The active adsorption regions were confirmed using NBO and MC analysis.
Conflicts of interest
The authors declare that they have no known competing financial interests or personal relationships that could have appeared to influence the work reported in this paper.Acknowledgements
The authors extend their appreciation to the Deanship for Research & Innovation, Ministry of Education in Saudi Arabia for funding this research work through the project Number: IFP22UQU4320745DSR221.References
- A. M. Abuelela, M. A. Bedair, W. M. Zoghaib, L. D. Wilson and T. A. Mohamed, Molecular structure and mild steel/HCl corrosion inhibition of 4,5-Dicyanoimidazole: Vibrational, electrochemical and quantum mechanical calculations, J. Mol. Struct., 2021, 1230, 129647, DOI:10.1016/j.molstruc.2020.129647.
- M. A. Mostafa, A. M. Ashmawy, M. A. M. A. Reheim, M. A. Bedair and A. M. Abuelela, Molecular structure aspects and molecular reactivity of some triazole derivatives for corrosion inhibition of aluminum in 1 M HCl solution, J. Mol. Struct., 2021, 1236, 130292, DOI:10.1016/j.molstruc.2021.130292.
- A. Hassan, B. Heakal, A. Younis, M. Bedair, Z. El - Billy and M. Mohamed, Synthesis of some triazole Schiff base derivatives and their metal complexes under microwave irradiation and evaluation of their corrosion inhibition and biological activity, Egypt. J. Chem., 2019, 62, 1603–1624, DOI:10.21608/ejchem.2019.10834.1699.
- A. Chaouiki, F. Hazmatulhaq, D. I. Han, A. H. Al-Moubaraki, M. Bakhouch and Y. G. Ko, Predicting the interaction between organic layer and metal substrate through DFTB and electrochemical approach for excellent corrosion protection, J. Ind. Eng. Chem., 2022, 114, 190–204, DOI:10.1016/j.jiec.2022.07.009.
- A. Ashmawy, R. Said, I. Naguib, B. Yao and M. Bedair, Anticorrosion Study for Brass Alloys in Heat Exchangers during Acid Cleaning Using Novel Gemini Surfactants Based on Benzalkonium Tetrafluoroborate, ACS Omega, 2022, 7, 17849–17860, DOI:10.1021/acsomega.2c01119.
- M. N. Majeed, Q. A. Yousif and M. A. Bedair, Study of the Corrosion of Nickel–Chromium Alloy in an Acidic Solution Protected by Nickel Nanoparticles, ACS Omega, 2022, 7, 29850–29857, DOI:10.1021/acsomega.2c02679.
- M. M. B. El-Sabbah, M. A. Bedair, M. A. Abbas, A. Fahmy, S. Hassaballa and A. A. Moustafa, Synergistic Effect between Natural Honey and 0.1 M KI as Green Corrosion Inhibitor for Steel in Acid Medium, Z. Phys. Chem., 2019, 233, 627–649, DOI:10.1515/zpch-2018-1208.
- M. El-Gaby, Y. A. Ammar, M. I. H. El-Qaliei, A. M. ali, M. F. Hussein and F. A. Faraghally, Sulfonamides: Synthesis and the recent applications in Medicinal Chemistry, Egypt, J. Chem., 2020, 63, 5289–5327, DOI:10.21608/ejchem.2020.33860.2707.
- S. Mondal and S. Malakar, Synthesis of sulfonamide and their synthetic and therapeutic applications: Recent advances, Tetrahedron, 2020, 76, 131662, DOI:10.1016/j.tet.2020.131662.
- R. O. Iakovenko, D. Chrenko, J. Kristek, E. Desmedt, F. Zálešák, F. De Vleeschouwer and J. Pospíšil, Heteroaryl sulfonamide synthesis: scope and limitations, Org. Biomol. Chem., 2022, 20, 3154–3159, 10.1039/D2OB00345G.
- S. Mkrtchyan and V. O. Iaroshenko, Mechanochemical synthesis of aromatic sulfonamides, Chem. Commun., 2021, 57, 11029–11032, 10.1039/D1CC03224K.
- H. M. Abd El-Lateef, Corrosion inhibition characteristics of a novel salycilidene isatin hydrazine sodium sulfonate on carbon steel in HCl and a synergistic nickel ions additive: A combined experimental and theoretical perspective, Appl. Surf. Sci., 2020, 501, 144237, DOI:10.1016/j.apsusc.2019.144237.
- D. K. Verma, M. Kazi, M. S. Alqahtani, R. Syed, E. Berdimurodov, S. Kaya, R. Salim, A. Asatkar and R. Haldhar, N-hydroxybenzothioamide derivatives as green and efficient corrosion inhibitors for mild steel: Experimental, DFT and MC simulation approach, J. Mol. Struct., 2021, 1241, 130648, DOI:10.1016/j.molstruc.2021.130648.
- H. M. A. El-Lateef, K. A. Soliman, M. A. Al-Omair and M. S. S. Adam, A combination of modeling and experimental approaches to investigate the novel nicotinohydrazone Schiff base and its complexes with Zn(II) and ZrO(II) as inhibitors for mild-steel corrosion in molar HCl, J. Taiwan Inst. Chem. Eng., 2021, 120, 391–408, DOI:10.1016/j.jtice.2021.03.036.
- A. K. Singh, B. Chugh, M. Singh, S. Thakur, B. Pani, L. Guo, S. Kaya and G. Serdaroglu, Hydroxy phenyl hydrazides and their role as corrosion impeding agent: A detail experimental and theoretical study, J. Mol. Liq., 2021, 330, 115605, DOI:10.1016/j.molliq.2021.115605.
- H. Lgaz, I.-M. Chung, M. R. Albayati, A. Chaouiki, R. Salghi and S. K. Mohamed, Improved corrosion resistance of mild steel in acidic solution by hydrazone derivatives: An experimental and computational study, Arabian J. Chem., 2020, 13, 2934–2954, DOI:10.1016/j.arabjc.2018.08.004.
- F. El-Hajjaji, E. Ech-chihbi, N. Rezki, F. Benhiba, M. Taleb, D. S. Chauhan and M. A. Quraishi, Electrochemical and theoretical insights on the adsorption and corrosion inhibition of novel pyridinium-derived ionic liquids for mild steel in 1 M HCl, J. Mol. Liq., 2020, 314, 113737, DOI:10.1016/j.molliq.2020.113737.
- S. El Arrouji, K. Karrouchi, A. Berisha, K. Ismaily Alaoui, I. Warad, Z. Rais, S. Radi, M. Taleb, M. Ansar and A. Zarrouk, New pyrazole derivatives as effective corrosion inhibitors on steel-electrolyte interface in 1 M HCl: Electrochemical, surface morphological (SEM) and computational analysis, Colloids Surf., A, 2020, 604, 125325, DOI:10.1016/j.colsurfa.2020.125325.
- M. Chafiq, A. Chaouiki, M. R. Al-Hadeethi, R. Salghi, I. H. Ali, S. K. Mohamed and I.-M. Chung, A joint experimental and theoretical investigation of the corrosion inhibition behavior and mechanism of hydrazone derivatives for mild steel in HCl solution, Colloids Surf., A, 2021, 610, 125744, DOI:10.1016/j.colsurfa.2020.125744.
- D. Sunil, P. Kumari, P. Shetty and S. A. Rao, Indole Hydrazide Derivatives as Potential Corrosion Inhibitors for Mild Steel in HCl Acid Medium: Experimental Study and Theoretical Calculations, Trans. Indian Inst. Met., 2022, 75, 11–25, DOI:10.1007/s12666-021-02382-8.
- Y. M. Abdallah, O. A. El-Gammal, H. M. Abd El-Lateef and K. Shalabi, Synthesis and characterization of novel dicarbohydrazide derivatives with electrochemical and theoretical approaches as potential corrosion inhibitors for N80 steel in a 3.5% NaCl solution, RSC Adv., 2022, 12, 14665–14685, 10.1039/D2RA01751B.
- N. M. El Basiony, E. E. Badr, S. A. Baker and A. S. El-Tabei, Experimental and theoretical (DFT&MC) studies for the adsorption of the synthesized Gemini cationic surfactant based on hydrazide moiety as X-65 steel acid corrosion inhibitor, Appl. Surf. Sci., 2021, 539, 148246, DOI:10.1016/j.apsusc.2020.148246.
- R. Laggoun, M. Ferhat, B. Saidat, A. Benghia and A. Chaabani, Effect of p-toluenesulfonyl hydrazide on copper corrosion in hydrochloric acid solution, Corros. Sci., 2020, 165, 108363, DOI:10.1016/j.corsci.2019.108363.
- S. Shekhar, T. B. Dunn, B. J. Kotecki, D. K. Montavon and S. C. Cullen, A General Method for Palladium-Catalyzed Reactions of Primary Sulfonamides with Aryl Nonaflates, J. Org. Chem., 2011, 76, 4552–4563, DOI:10.1021/jo200443u.
- X. Cao, Y. Bai, Y. Xie and G.-J. Deng, Palladium-catalyzed arylation of aryl sulfonamides with cyclohexanones, J. Mol. Catal. A: Chem., 2014, 383–384, 94–100, DOI:10.1016/j.molcata.2013.11.023.
- S. S. Hamdani, B. A. Khan, S. Hameed, F. Batool, H. N. Saleem, E. U. Mughal and M. Saeed, Synthesis and evaluation of novel S-benzyl- and S-alkylphthalimide- oxadiazole -benzenesulfonamide hybrids as inhibitors of dengue virus protease, Bioorg. Chem., 2020, 96, 103567, DOI:10.1016/j.bioorg.2020.103567.
- R. Dennington, T. A. Keith, and J. M. Millam, GaussView 6, Semichem Inc, Shawnee Mission, KS, 2016 Search PubMed.
- M. J. Frisch, Gaussian 09, Gaussian, Inc., Wallingford, CT, 2009 Search PubMed.
- A. D. Becke, A new mixing of Hartree–Fock and local density-functional theories, J. Chem. Phys., 1993, 98, 1372, DOI:10.1063/1.464304.
- C. Lee, W. Yang and R. G. Parr, Development of the Colle-Salvetti correlation-energy formula into a functional of the electron density, Phys. Rev. B: Condens. Matter Mater. Phys., 1988, 37, 785–789, DOI:10.1103/PhysRevB.37.785.
- S. H. Vosko, L. Wilk and M. Nusair, Accurate spin-dependent electron liquid correlation energies for local spin density calculations: a critical analysis, Can. J. Phys., 1980, 58, 1200–1211, DOI:10.1139/p80-159.
- E. D. Glendening, A. E. Reed, J. E. Carpenter, and F. Weinhold, NBO Version 3.1, 2016 Search PubMed.
- M. M. Elsenety, B. A. Elsayed, I. A. Ibrahem and M. A. Bedair, Photophysical, DFT and molecular docking studies of Sm(III) and Eu(III) complexes of newly synthesized coumarin ligand, Inorg. Chem. Commun., 2020, 121, 108213, DOI:10.1016/j.inoche.2020.108213.
- Adsorption Locator Module Built in Materials Studio, BIOVIA, San Diego, CA, USA, 2017 Search PubMed.
- D. Song, H. Liu, A. Zhang and J. Qu, Fragmentation of typical sulfonamide drugs via heterolytic bond cleavage and stepwise rearrangement, RSC Adv., 2014, 4, 48426–48432, 10.1039/C4RA07737G.
- K. Klagkou, F. Pullen, M. Harrison, A. Organ, A. Firth and G. J. Langley, Fragmentation pathways of sulphonamides under electrospray tandem mass spectrometric conditions, Rapid Commun. Mass Spectrom., 2003, 17, 2373–2379, DOI:10.1002/rcm.1201.
- M. Sun, W. Dai and D. Q. Liu, Fragmentation of aromatic sulfonamides in electrospray ionization mass spectrometry: elimination of SO2 via rearrangement, J. Mass Spectrom., 2008, 43, 383–393, DOI:10.1002/jms.1335.
- D. Stražić, T. Benković, D. Gembarovski, D. Kontrec and N. Galić, Comprehensive ESI-MS and MS/MS analysis of aromatic hydrazones derived from nicotinic acid hydrazide, Int. J. Mass Spectrom., 2014, 371, 54–64, DOI:10.1016/j.ijms.2014.07.036.
- H. H. Fokoue, J. V Marques, M. V Correia, L. F. Yamaguchi, X. Qu, J. Aires-de-Sousa, M. T. Scotti, N. P. Lopes and M. J. Kato, Fragmentation pattern of amides by EI and HRESI: study of protonation sites using DFT-3LYP data, RSC Adv., 2018, 8, 21407–21413, 10.1039/C7RA00408G.
- P. Han, C. Chen, W. Li, H. Yu, Y. Xu, L. Ma and Y. Zheng, Synergistic effect of mixing cationic and nonionic surfactants on corrosion inhibition of mild steel in HCl: Experimental and theoretical investigations, J. Colloid Interface Sci., 2018, 516, 398–406, DOI:10.1016/j.jcis.2018.01.088.
- M. A. Bedair, S. A. Soliman, M. F. Bakr, E. S. Gad, H. Lgaz, I.-M. Chung, M. Salama and F. Z. Alqahtany, Benzidine-based Schiff base compounds for employing as corrosion inhibitors for carbon steel in 1.0 M HCl aqueous media by chemical, electrochemical and computational methods, J. Mol. Liq., 2020, 317, 114015, DOI:10.1016/j.molliq.2020.114015.
- M. A. Bedair, M. M. B. El-Sabbah, A. S. Fouda and H. M. Elaryian, Synthesis, electrochemical and quantum chemical studies of some prepared surfactants based on azodye and Schiff base as corrosion inhibitors for steel in acid medium, Corros. Sci., 2017, 128, 54–72, DOI:10.1016/j.corsci.2017.09.016.
- M. A. Bedair, E. H. Alosaimi and S. Melhi, A study of the inhibitive effect for corrosion of steel in 1.0 M HCl using a new nonionic surfactant based on coumarin moiety: chemical, electrochemical and quantum mechanics calculations, J. Adhes. Sci. Technol., 2021, 1–31, DOI:10.1080/01694243.2021.2018864.
- E. Berdimurodov, A. Kholikov, K. Akbarov, L. Guo, S. Kaya, K. P. Katin, D. K. Verma, M. Rbaa, O. Dagdag and R. Haldhar, Novel gossypol–indole modification as a green corrosion inhibitor for low–carbon steel in aggressive alkaline–saline solution, Colloids Surf., A, 2022, 637, 128207, DOI:10.1016/j.colsurfa.2021.128207.
- S. S. Alarfaji, I. H. Ali, M. Z. Bani-Fwaz and M. A. Bedair, Synthesis and Assessment of Two Malonyl Dihydrazide Derivatives as Corrosion Inhibitors for Carbon Steel in Acidic Media: Experimental and Theoretical Studies, Molecules, 2021, 26, 3183, DOI:10.3390/molecules26113183.
- M. A. Gebril, M. A. Bedair, S. A. Soliman, M. F. Bakr and M. B. I. Mohamed, Experimental and computational studies of the influence of non-ionic surfactants with coumarin moiety as corrosion inhibitors for carbon steel in 1.0 M HCl, J. Mol. Liq., 2022, 349, 118445, DOI:10.1016/j.molliq.2021.118445.
- S. A. Soliman, M. S. Metwally, S. R. Selim, M. A. Bedair and M. A. Abbas, Corrosion inhibition and adsorption behavior of new Schiff base surfactant on steel in acidic environment: Experimental and theoretical studies, J. Ind. Eng. Chem., 2014, 20, 4311–4320, DOI:10.1016/j.jiec.2014.01.038.
- K. Zakaria, M. A. Abbas and M. A. Bedair, Herbal expired drug bearing glycosides and polysaccharides moieties as green and cost-effective oilfield corrosion inhibitor: Electrochemical and computational studies, J. Mol. Liq., 2022, 352, 118689, DOI:10.1016/j.molliq.2022.118689.
- M. A. Bedair, S. A. Soliman and M. S. Metwally, Synthesis and characterization of some nonionic surfactants as corrosion inhibitors for steel in 1.0 M HCl (Experimental and computational study), J. Ind. Eng. Chem., 2016, 41, 10–22, DOI:10.1016/j.jiec.2016.07.005.
- M. Damej, R. Hsissou, A. Berisha, K. Azgaou, M. Sadiku, M. Benmessaoud, N. Labjar and S. El hajjaji, New epoxy resin as a corrosion inhibitor for the protection of carbon steel C38 in 1M HCl. experimental and theoretical studies (DFT, MC, and MD), J. Mol. Struct., 2022, 1254, 132425, DOI:10.1016/j.molstruc.2022.132425.
- M. A. Abbas and M. A. Bedair, Adsorption and Computational Studies for Evaluating the Behavior of Silicon Based Compounds as Novel Corrosion Inhibitors of Carbon Steel Surfaces in Acidic Media, Z. Phys. Chem., 2019, 233, 225–254, DOI:10.1515/zpch-2018-1159.
- A. Singh, K. R. Ansari, D. S. Chauhan, M. A. Quraishi, H. Lgaz and I.-M. Chung, Comprehensive investigation of steel corrosion inhibition at macro/micro level by ecofriendly green corrosion inhibitor in 15% HCl medium, J. Colloid Interface Sci., 2020, 560, 225–236, DOI:10.1016/j.jcis.2019.10.040.
- Q. Wang, X. Wu, H. Zheng, X. Xiao, L. Liu, Q. Zhang, P. Gao, Z. Yan, Y. Sun, Z. Li and X. Li, Insight into anti–corrosion behavior of Centipeda minima leaves extract as high–efficiency and eco–friendly inhibitor, Colloids Surf., A, 2022, 640, 128458, DOI:10.1016/j.colsurfa.2022.128458.
- M. A. Abbas, E. I. Arafa, E. S. Gad, M. A. Bedair, O. E. El-Azabawy and H. I. Al-Shafey, Performance assessment by experimental and Theoretical approaches of newly synthetized benzyl amide derivatives as corrosion inhibitors for carbon steel in 1.0 M hydrochloric acid environment, Inorg. Chem. Commun., 2022, 143, 109758, DOI:10.1016/j.inoche.2022.109758.
- S. Aourabi, M. Driouch, M. Sfaira, F. Mahjoubi, B. Hammouti, C. Verma, E. E. Ebenso and L. Guo, Phenolic fraction of Ammi visnaga extract as environmentally friendly antioxidant and corrosion inhibitor for mild steel in acidic medium, J. Mol. Liq., 2021, 323, 114950, DOI:10.1016/j.molliq.2020.114950.
- T. K. Sarkar, M. Yadav and I. B. Obot, Mechanistic evaluation of adsorption and corrosion inhibition capabilities of novel indoline compounds for oil well/tubing steel in 15% HCl, Chem. Eng. J., 2022, 431, 133481, DOI:10.1016/j.cej.2021.133481.
- H. M. Elaryian, M. A. Bedair, A. H. Bedair, R. M. Aboushahba and A. E.-A. S. Fouda, Synthesis, characterization of novel coumarin dyes as corrosion inhibitors for mild steel in acidic environment: Experimental, theoretical, and biological studies, J. Mol. Liq., 2022, 346, 118310, DOI:10.1016/j.molliq.2021.118310.
- M. Bedair, M. Metwally, S. Soliman, A. Al-Sabagh, A. Salem and T. Mohamed, Extracts of mint and tea as green corrosion inhibitors for mild steel in hydrochloric acid solution, Al-Azhar Bull. Sci., 2015, 26, 1–14, DOI:10.21608/absb.2015.23766.
- E. A. Badr, M. A. Bedair and S. M. Shaban, Adsorption and performance assessment of some imine derivatives as mild steel corrosion inhibitors in 1.0 M HCl solution by chemical, electrochemical and computational methods, Mater. Chem. Phys., 2018, 219, 444–460, DOI:10.1016/j.matchemphys.2018.08.041.
- R. G. Pearson, Chemical Hardness, Wiley-VCH Verlag GmbH, Weinheim, 1997 Search PubMed.
- M. A. Bedair, The effect of structure parameters on the corrosion inhibition effect of some heterocyclic nitrogen organic compounds, J. Mol. Liq., 2016, 219, 128–141, DOI:10.1016/j.molliq.2016.03.012.
- M. A. Bedair, S. A. Soliman, M. A. Hegazy, I. B. Obot and A. S. Ahmed, Empirical and theoretical investigations on the corrosion inhibition characteristics of mild steel by three new Schiff base derivatives, J. Adhes. Sci. Technol., 2019, 33, 1139–1168, DOI:10.1080/01694243.2019.1582889.
- M. K. M. K. Awad, M. S. S. M. Metwally, S. A. S. A. Soliman, A. A. A. El-Zomrawy and M. A. M. A. bedair, Experimental and quantum chemical studies of the effect of poly ethylene glycol as corrosion inhibitors of aluminum surface, J. Ind. Eng. Chem., 2014, 20, 796–808, DOI:10.1016/j.jiec.2013.06.009.
- R. Haldhar, S.-C. Kim, D. Prasad, M. A. Bedair, I. Bahadur, S. Kaya, O. Dagdag and L. Guo, Papaver somniferum as an efficient corrosion inhibitor for iron alloy in acidic condition: DFT, MC simulation, LCMS and electrochemical studies, J. Mol. Struct., 2021, 1242, 130822, DOI:10.1016/j.molstruc.2021.130822.
- S. Melhi, M. A. Bedair, E. H. Alosaimi, A. A. O. Younes, W. H. El-Shwiniy and A. M. Abuelela, Effective corrosion inhibition of mild steel in hydrochloric acid by newly synthesized Schiff base nano Co(II) and Cr(III) complexes: spectral, thermal, electrochemical and DFT (FMO, NBO) studies, RSC Adv., 2022, 12, 32488–32507, 10.1039/D2RA06571A.
- M. A. Abbas, M. A. Bedair, O. E. El-Azabawy, E. S. Gad, M. A. Abbas, M. A. Bedair, O. E. El-Azabawy and E. S. Gad, Anticorrosion Effect of Ethoxylate Sulfanilamide Compounds on Carbon Steel in 1 M Hydrochloric Acid: Electrochemical and Theoretical Studies, ACS Omega, 2021, 6, 15089–15102, DOI:10.1021/acsomega.1c01274.
- M. A. Bedair, A. S. Fouda, M. A. Ismail and A. Mostafa, Inhibitive effect of bithiophene carbonitrile derivatives on carbon steel corrosion in 1 M HCl solution: experimental and theoretical approaches, Ionics, 2019, 25, 2913–2933, DOI:10.1007/s11581-018-2811-0.
- M. M. Abdelsalam, M. A. Bedair, A. M. Hassan, B. H. Heakal, A. Younis, Z. I. Elbialy, M. A. Badawy, H. E.-D. Fawzy and S. A. Fareed, Green synthesis, electrochemical, and DFT studies on the corrosion inhibition of steel by some novel triazole Schiff base derivatives in hydrochloric acid solution, Arabian J. Chem., 2022, 15, 103491, DOI:10.1016/j.arabjc.2021.103491.
- N. Arrousse, R. Salim, Y. Kaddouri, A. Zarrouk, D. Zahri, F. El Hajjaji, R. Touzani, M. Taleb and S. Jodeh, The inhibition behavior of two pyrimidine-pyrazole derivatives against corrosion in hydrochloric solution: Experimental, surface analysis and in silico approach studies, Arabian J. Chem., 2020, 13, 5949–5965, DOI:10.1016/j.arabjc.2020.04.030.
- H. M. Elaryian, M. A. Bedair, A. H. Bedair, R. M. Aboushahba and A. E.-A. S. Fouda, Corrosion mitigation for steel in acid environment using novel p-phenylenediamine and benzidine coumarin derivatives: synthesis{,} electrochemical{,} computational and SRB biological resistivity, RSC Adv., 2022, 12, 29350–29374, 10.1039/D2RA05803K.
- M. A. Bedair, A. M. Abuelela, W. M. Zoghaib and T. A. Mohamed, Molecular structure, tautomer's, reactivity and inhibition studies on 6-Methyl-2-thiouracil for mild steel corrosion in aqueous HCl (1.00 M): Experimental and Theoretical Studies, J. Mol. Struct., 2021, 1244, 130927, DOI:10.1016/j.molstruc.2021.130927.
- M. Ouakki, M. Galai, Z. Aribou, Z. Benzekri, E. H. El Assiri, K. Dahmani, E. Ech-chihbi, A. S. Abousalem, S. Boukhris and M. Cherkaoui, Detailed experimental and computational explorations of pyran derivatives as corrosion inhibitors for mild steel in 1.0 M HCl: Electrochemical/surface studies, DFT modeling, and MC simulation, J. Mol. Struct., 2022, 1261, 132784, DOI:10.1016/j.molstruc.2022.132784.
Footnote |
| † Electronic supplementary information (ESI) available. See DOI: https://doi.org/10.1039/d2ra05939h |
| This journal is © The Royal Society of Chemistry 2023 |

