DOI:
10.1039/D2RA06287A
(Paper)
RSC Adv., 2023,
13, 3592-3601
Optical transitions and radiative properties of green emitting Ho3+:YVO4 phosphor
Received
6th October 2022
, Accepted 20th November 2022
First published on 26th January 2023
Abstract
The Ho3+-doped YVO4 phosphors were successfully prepared via a sol–gel process in which citric acid was used as a chelating agent. X-ray diffraction (XRD) confirmed the effective inclusion of Ho3+ ions into the host matrix with the formation of single phase YVO4. The surface morphology was observed using SEM, the results of which showed a grain growth propensity and the agglomeration of prepared phosphors. The V–O (VO43−) vibration mode was analyzed through Fourier transform infrared (FTIR) spectra. The spectroscopic properties were reported through UV-vis-NIR diffuse reflectance and photoluminescence (PL) spectra. The Judd–Ofelt (J–O) intensity parameters Ω2 = 0.03 × 10⁻²⁰ cm2, Ω4 = 0.22 × 10⁻²⁰ cm2, and Ω6 = 0.23 × 10⁻²⁰ cm2 obtained for the Y0.97VO4:0.03Ho3+ phosphors were used to obtain the total transition probabilities (AT), radiative lifetimes (τrad) and branching ratios (β) for the certain transitions of Ho3+ ions. Under 310 nm UV excitation, the visible emission spectra were measured, and an intense emission was observed around 541 nm (green region) for all the samples. The emission cross-section σP(λ) was 3.22 × 10⁻²¹ cm2 and the branching ratio (β) was 0.816; these were investigated to capture the optimal concentration of the Y0.97VO4:0.03Ho3+ phosphor. The estimated color coordinates were observed in the green region of CIE diagram. Ultimately, the superior properties (σP(λ), β, and color purity) of Y0.97VO4:0.03Ho3+ phosphor may make it suitable for green emitting devices.
1. Introduction
Recently, the zircon structured orthovanadate (AVO4, A = trivalent metal ion) has attracted substantial research attention because of its applicability in a wide variety of areas.1 This material is not only used as a luminescent host material but has also been used in diverse applications in the fields of gas sensing, high power lasers, fuel cell anodes, and counter electrodes in electrochromic devices.2–4 Yttrium vanadate (YVO4) is a well-recognized host lattice for rare-earth (RE) activators from the family of AVO4. YVO4 shows excellent thermal, mechanical, and optical properties, and it exhibits wide absorption in the UV region; therefore, RE doped phosphors are widely used for optoelectronic application alongwith biosensors and laser devices.5–12 YVO4 shows high birefringence and can be used as a polarizer in the infrared (IR) region.13 YVO4 is also a good up-conversion host due to its low phonon energy (∼880 cm−1). Many studies have examined up-conversion luminescence in RE3+-doped and co-doped YVO4 phosphors.14–17 YVO4:Nd3+ performs better than YAG:Nd3+, and it is therefore a good laser excitable host crystal for Nd3+ ions, and has shown remarkable applicability in laser-diode pumped micro lasers.18–21
At present, to conquer multiple color tunability, the phosphor materials are used in energy conversion and materials technology. Due to its efficient energy conversion, the high color purity and thermal stability of Eu3+-doped YVO4 make it a promising red phosphor for use in a wide range of applications in luminescence and display devices, such as fluorescent lamps, cathode ray tubes, plasma display panels, etc.22–30 Foka et al.31 synthesized Dy3+-doped YVO4 phosphor via the combustion route and reported white emission with excitation in the UV region. Liu et al.32 synthesized YVO4:Ln3+ (Ln = Eu, Sm, Dy) via the microwave heating method and reported its morphology and photoluminescence (PL) results. Xu et al.33 studied the effects of organic additives on the shape and morphology of RE3+-doped YVO4 phosphors synthesized via a hydrothermal method. They have found remarkable results, which can be used for tunability in the display panels. Their PL study indicates an efficient multicolor emission that can be useful in lasers and displays related to the optoelectronic devices. Huang et al.34 synthesized (Bi3+, RE3+) co-doped YVO4 phosphor by a solid-state reaction technique and reported that the phosphors could improve the efficiency of the power conversion of dye-sensitized and crystalline silicon (c-Si) solar cells. The energy transfer between single and triply doped RE3+ ions in the YVO4 host and its luminescence property have recently been studied by Medvedev et al.35 Moreover, all the rare earth ions and their doped systems of the phosphors with Ho3+ ion serve as good activators due to energy transfer and reflecting the multiple color emission. Zhou et al.36 studied the PL property of red emitting YVO4:Pr3+ phosphor, which is considered to be a good candidate for optical thermal sensing applications. YVO4 phosphors have been synthesized through various synthesis methods, such as co-precipitation,37 solution combustion,38 solid state reaction,34 microwave heating,32 sol–gel,39,40 microemulsions,41 solvothermal,42 ultrasonic,43 and spray pyrolysis methods.44 The YVO4:(Ho3+,Yb3+) phosphors synthesized by different synthesis method and their effect on luminescence have recently been studied.39 The study indicates that the YVO4:(Ho3+,Yb3+) phosphor prepared by sol–gel method exhibit better optical properties than the phosphor synthesized by the combustion and solid state reaction methods.
In the present work, most notably, we have successfully synthesized trivalent holmium (Ho3+)-doped YVO4 phosphors with different doping concentrations. The samples were characterized in terms of their physical and radiative properties by using X-ray diffraction (XRD), scanning electron microscopy (SEM), Fourier transform infrared (FTIR) spectroscopy, ultraviolet-visible (UV-vis) spectrometry, and photoluminescence (PL) techniques.
2. Materials preparation and analysis
Phosphor materials of Y1−xVO4:xHo3+ (x = 0.01, 0.03, 0.05, 0.07, 0.09, 0.11) were prepared through the sol–gel method. The details of the sample composition and the starting materials along with required weights are given in Table 1. The appropriate amounts of Y(NO3)3·6H2O, NH4VO3, Ho(NO3)3·5H2O, and citric acid (chelating agent for the metal ions) were weighed and added into a 150 ml glass beaker with 10 ml deionized water. The prepared solution was stirred for 1 hour to ensure uniform homogeneity. Next, the solution was placed in a hot oven until it was completely dried. The dried gels were heated in air at 400 °C for upto 2 hours. The preheated powder samples were ground and again heated in air at 800 °C for 2 hours to acquire the final samples. Fig. 1 shows a flow chart of the synthesis method.
Table 1 Detailed information of sample and weight of the required starting materials
| Samples |
Base materials |
| Y0.99VO4:0.01Ho3+ |
Y = 0.7583g |
V = 0.2338g |
C.A = 1.5368g |
Ho = 0.0176g |
| Y0.97VO4:0.03Ho3+ |
Y = 0.7430g |
V = 0.2338g |
C.A = 1.5368g |
Ho = 0.0592g |
| Y0.95VO4:0.05Ho3+ |
Y = 0.7277g |
V = 0.2338g |
C.A = 1.5368g |
Ho = 0.0882g |
| Y0.93VO4:0.07Ho3+ |
Y = 0.7123g |
V = 0.2338g |
C.A = 1.5368g |
Ho = 0.1243g |
| Y0.91VO4:0.09Ho3+ |
Y = 0.6970g |
V = 0.2338g |
C.A = 1.5368g |
Ho = 0.1578g |
| Y0.89VO4:0.11Ho3+ |
Y = 0.6817g |
V = 0.2338g |
C.A = 1.5368g |
Ho = 0.1940g |
| Y = Y(NO3)3·6H2O, V = NH4VO3, C.A = citric acid, Ho = Ho(NO3)3·5H2O |
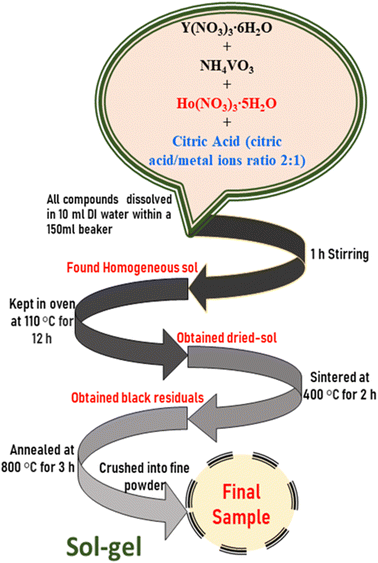 |
| | Fig. 1 Flow chart of synthesis method of Y1−xVO4:xHo3+ phosphors. | |
The phase of prepared powders was identified using a RIGAKU (Miniflex-II) XRD spectrometer with CuKα light radiation as X-ray. FTIR spectrum in the 4000–400 cm−1 range was obtained on a Thermo Fisher Nicolet (6700 FT-IR) spectrometer utilizing KBr pellets. The sample surface morphology was imaged using a S-3400, SEM (Hitachi, Japan). The diffuse reflection spectrum was captured with a UV-VIS-NIR (Cary-5000) spectrophotometer. PL characterizations were carried out at room temperature using a RF-5301PC, Shimadzu, fluorescence spectrophotometer with a Xenon flash lamp as an excitation source.
3. Results and discussion
Fig. 2 shows the crystal structure of the YVO4 compound with different orientations. YVO4 is (zircon type structure) crystallized in the tetragonal I41/amd space group. In this structure, Y3+ atom has D2d site symmetry and is bonded in 8-coordinate geometry to eight equivalent O2− atoms to form an anti-prism. Out of these eight Y–O bonds, four have shorter bond lengths (2.33 Å) whereas the other four have longer bond lengths (2.45 Å). The V5+ atom is bonded with four equivalent O2− atoms to form VO43− tetrahedra which share edges with YO8 dodecahedrons, as shown in Fig. 2. All V–O bond lengths are 1.74 Å. The O2− atom is bonded with two equivalent Y3+ atoms and one V5+ atom.45,46 Fig. 3 shows the observed XRD patterns of the YVO4 phosphors produced through the sol–gel technique. The observed XRD patterns are counterpart with the standard card of JCPDF 70-1281. No miscellaneous or additional peak is observed in all the XRD patterns, thus suggesting a single-phase material and indicates that the crystal structure of host matrix does not change with the addition of Ho3+ ion. The ionic radius of Ho3+ (r = 0.89 Å) was found to be well matched with ionic radius of Y3+ (r = 0.9 Å, CN = 8), thus indicates that the Ho3+ is successfully incorporated at the Y3+ sites. The XRD pattern shows that the prepared YVO4 crystallizes in the tetragonal I41/amd space group alongwith cell parameters a = 7.120 Å, c = 6.289 Å, and volume = 318.82 Å3. The average crystallite size can be determined using the formula,| |
D = 0.9λ/β![[thin space (1/6-em)]](https://www.rsc.org/images/entities/char_2009.gif) cos cos![[thin space (1/6-em)]](https://www.rsc.org/images/entities/char_2009.gif) θ θ
| (1) |
here, λ (1.540598 Å) is the wavelength of X-ray radiation, and the diffraction angle of Bragg's (θ) and Full width at half maxima (FWHM) is denoted by β. The average crystallite size of the phosphor samples was within the 20–30 nm range.
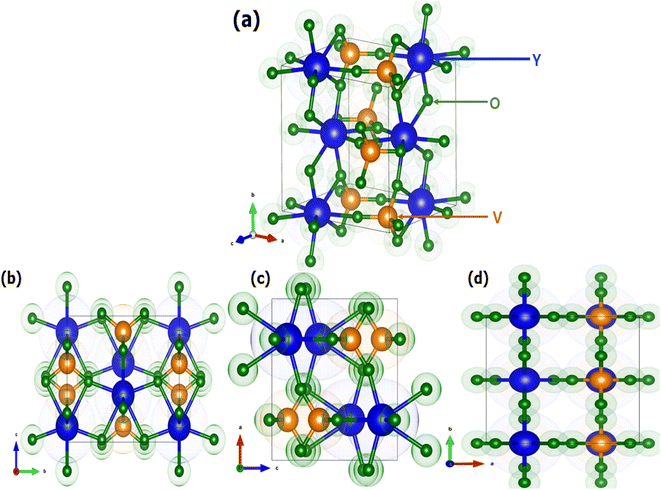 |
| | Fig. 2 Crystal structure of YVO4 (a) standard orientation and (b–d) three different orientations 100, 010, and 001. | |
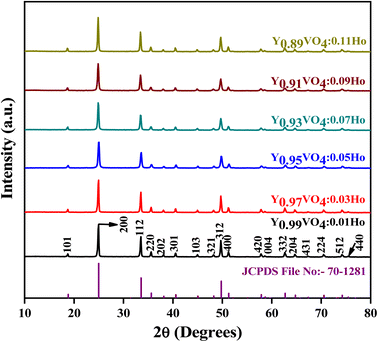 |
| | Fig. 3 Powder XRD patterns of Y1−xVO4:xHo3+ phosphors. | |
Fig. 4 presents SEM images of the synthesized Y0.97VO4:0.03Ho3+ phosphor. The inhomogeneous morphology and large grain size are observed in the SEM images. SEM images reveal that the phosphor particles morphologies are not uniform, they also show that the phosphor particles are irregular and agglomerated Fig. 4(b) shows an enlarged view of the “zone (a)’” of Fig. 4(a), wherein the sample consists of voids, and pores that are most likely due to the evolution of large amount of gases during the process of sintering. The grain size distribution is broad, and the average particles size ranges from 100 nm to 500 nm for the Y0.97VO4:0.03Ho3+ phosphor. These characteristics suggest that the optical properties are suitable for the industrial use.
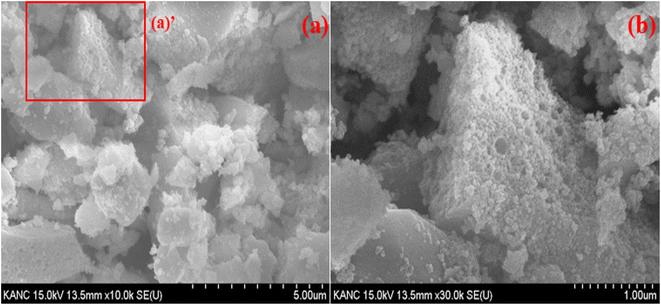 |
| | Fig. 4 (a) SEM image of Y0.97VO4:0.03Ho3+ phosphor and (b) enlarged view of zone (a)’. | |
Fig. 5 reveals the FTIR spectrum of Y0.97VO4:0.03Ho3+ phosphor, which is used to analyze the chemical structure and presence of the functional groups associated with the crystal. The intense band situated at 814 cm−1 is remarkably matched with the characteristic vibrational modes of the V–O group of the tetrahedral structure of VO43− group.47 The weak band occurring at 450 cm−1 is attributable to the Y–O group of structural vibrations. The very weak bands observed between 1100 to 1400 cm−1 is due to the presence of C–O and nitrate groups alongwith the band between 1400 to 1500 cm−1 associated with the vibrations of carboxylate anions of the citric acid. A very weak band observed at 2350 cm−1 corresponds to the asymmetrical stretching modes of CO2.17 Some very weak bands beyond 3500 cm−1 are also assigned to the water molecules present on the sample surface.
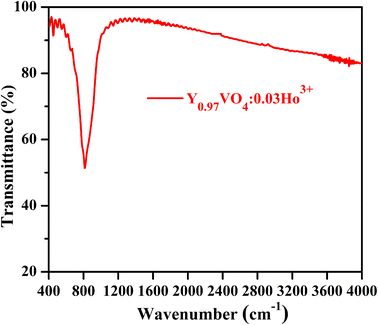 |
| | Fig. 5 FT-IR spectrum of Y0.97VO4:0.03Ho3+ phosphor. | |
Fig. 6(a) depicts the diffuse reflectance spectrum of Y0.97VO4:0.03Ho3+ phosphor. The sharp peaks observed around 421, 458, 469, 478, 489, 544, and 651 nm are associated with the transitions from the ground state of 5I8 to the 5G5, 5G6 + 5F1, 3K8, 5F2, 5F3, 5F4 + 5S2, and 5F5 excited states of Ho3+ ions, respectively.48,49 The extracted absorption coefficient (α cm−1) with the Kubelka–Munk function can be written as:48
| |
 | (2) |
where
R is the sample reflectance. The extracted optical coefficient (
α cm
−1) can be calculated by using relation (
2). The optical band gap (
Eg) for the Y
0.97VO
4:0.03Ho
3+ phosphor can be estimated using the Tauc relation:
48| | |
F(R) hv ≈ A(hv − Eg)n
| (3) |
where
A is a constant,
F(
R) is the absorption coefficient,
hv is the energy of the photon, and
n = 1/2 (and/or 2) for allowed direct (and/or indirect) transition.
Fig. 6(b and c) represents the variation between the (
F(
R)*
hv)
n and
hv (eV). By generalizing the linear region of the plot to (
F(R) *
hv)
2 = 0 and (F(R) *
hv)
1/2 = 0, the energy bandgaps for the indirect and direct allowed transitions are found to be 3.30 ± 0.24 eV and 3.59 ± 0.38 eV, respectively for the Ho
3+ doped YVO
4 phosphor.
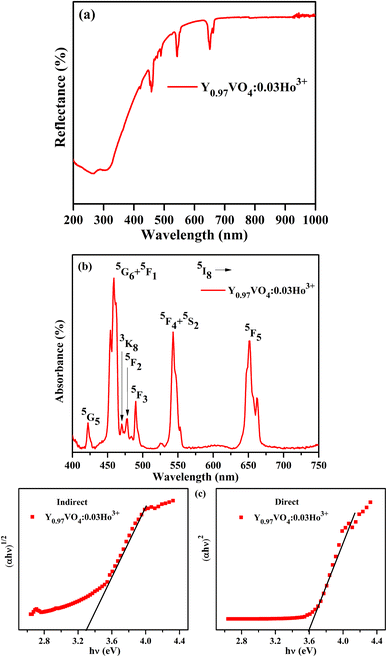 |
| | Fig. 6 (a) Diffuse reflection spectrum, (b) absorption spectrum and (c) plots of indirect and direct bandgaps of Y0.97VO4:0.03Ho3+ phosphor. | |
The Judd–Ofelt theory49,50 is used to characterize the spectroscopic properties of rare earth doped host matrix, for which details are available elsewhere.51 Therefore, these remarkable outcomes explain the existence theory of the material properties. The doped YVO4 phosphor is an excellent host matrix for rare earth doping to support the energy conversion to the Ho3+ ions. According to Judd–Ofelt theory, the oscillator strengths (fcal) of an electric dipole multiplets (J → J′) of Ho3+ can be expressed as,
| |
 | (4) |
where
Ωλ (
λ = 2, 4 & 6) are the J–O intensity parameters and
U(λ) are the doubly diminished matrix elements taken from ref.
52, and these tensor operators are independent of the host. The measured oscillator strengths (
fmeas) for the observed absorption bands are calculated using,
53| |
 | (5) |
where
N is the ion concentration (ions/cm
3),
d is the sample thickness, and OD (
λ) is the optical density as a function of wavelength.
Table 2 reports the oscillator strength (
fmeas and
fcal) for Ho
3+:YVO
4 phosphor alongwith the other hosts.
Ωλ parameters are evaluated through a standard least square fitting method with the known oscillator strengths of the absorption transitions. The magnitude of root mean square (
δrms) provides information on the quality of the fit, and its formula is,
| | |
δrms = [(fmeas − fcal)2/(p − q)]1/2
| (6) |
where
p and
q are the number of transitions employed to the fit and the required fixed parameters, respectively. The observed small r.m.s. deviation (see
Table 2) indicates the authenticity of J–O theory.
Table 2 Measured and calculated oscillator strengths (fexp and fcal) for Ho3+ ions in the Y0.97VO4:0.03Ho3+ phosphor
| [S′L′J′] manifold |
λ (nm) |
Y0.97VO4:0.03Ho3+ a |
CaSc2O4 (ref. 54) |
SrLaGaO4 (ref. 55) |
Y3Al5O10 (ref. 56) |
| fmeas × 10−6 |
fcal × 10−6 |
fmeas × 10−6 |
fmeas × 10−6 |
fmeas × 10−6 |
| Present work. |
| 5G5 |
421 |
0.05 |
0.35 |
1.11 |
— |
3.61 |
| 5G6 + 5F1 |
458 |
0.73 |
0.74 |
5.47 |
20.7 |
5.83 |
| 3K8 |
469 |
0.01 |
0.11 |
— |
0.29 |
4.03 |
| 5F2 |
478 |
0.03 |
0.11 |
— |
0.10 |
| 5F3 |
489 |
0.09 |
0.20 |
— |
0.92 |
| 5S2 + 5F4 |
544 |
0.48 |
0.62 |
1.73 |
3.86 |
4.72 |
| 5F5 |
651 |
0.68 |
0.44 |
2.12 |
3.37 |
3.86 |
| δrms |
0.45 |
0.14 |
5.36 |
0.89 |
Table 3 shows the J–O intensity parameters (Ω2, Ω4, and Ω6) of various host matrices. It is well known that the Ω2 parameter is associated with the covalency of the Ho–O bond, and that the Ω4 and Ω6 intensity parameters are related to the bulk properties of the host matrix. From Table 3, it can be seen that the magnitude of Ω2 in YVO4 phosphor is comparable with that in the YAG (Y3A5O10) and lower than those in the other reported host matrices, thus indicates lower covalency around the Ho–O bond. Using the J–O intensity parameter, Ωλ values; the transition probabilities for the radiative transitions (Arad), excited states of radiative lifetimes (τR), and branching ratios (β) are calculated for the Ho3+:YVO4 phosphor using the formula,53
| |
 | (7) |
where
AT is the total radiative transition probability and is estimated by the sum of the
Arad.
Table 4 represents total radiative transition probabilities (
AT), radiative lifetime (
τrad) of certain excited states, and branching ratios for certain emission transitions of Ho
3+ ions in YVO
4 phosphor. From
Table 4, it can be seen that the magnitudes of radiative lifetime for the excited levels are in the order of
3K
8 >
5F
5 >
5F
2 >
5F
3 >
5F
4 >
3H
5 >
5G
6. The observed magnitudes of the radiative lifetimes of Ho
3+:YVO
4 are comparatively higher than those of the reported Ho
3+ doped hosts: CaScO
4,
54 SrLaGaO
4,
55 Y
2O
3,
58 and Lu
2SiO
5,
60 respectively.
Table 3 Judd–Ofelt intensity parameters (Ωλ, λ = 2, 4 & 6) for Ho3+ ions in the host matrices
| Host matrix |
Ω2 |
Ω4 |
Ω6 |
| Present work. |
| Y0.97VO4:0.03Ho3+ a |
0.03 |
0.22 |
0.23 |
| CaSc2O4(ref. 54) |
3.78 |
5.17 |
1.92 |
| SrLaGaO4(ref. 55) |
1.25 |
0.42 |
1.80 |
| Y3Al5O10(ref. 56) |
0.04 |
2.67 |
1.89 |
| SrLaGa3O7(ref. 57) |
2.23 |
0.85 |
1.81 |
| Y2O3(ref. 58) |
0.45 |
0.59 |
0.32 |
| LiYF4(ref. 59) |
1.16 |
2.24 |
2.09 |
Table 4 Radiative properties of certain excited levels/transitions of Ho3+ ions in the Y0.97VO4:0.03Ho3+ phosphor
| [S′L′J′] manifold |
AT (s−1) |
τrad (μs) |
| 3H5 |
1497 |
668 |
| 5G6 |
1592 |
628 |
| 3K8 |
159 |
6297 |
| 5F2 |
867 |
1153 |
| 5F3 |
1060 |
943 |
| 5F4 |
1082 |
924 |
| 5F5 |
542 |
1845 |
| Transition |
β |
| 3H5 → 5I8 |
0.423 |
| 5G6 → 5I8 |
0.752 |
| 3K8 → 5I8 |
0.880 |
| 5F2 → 5I8 |
0.566 |
| 5F3 → 5I8 |
0.524 |
| 5F4 → 5I8 |
0.816 |
| 5F5 → 5I8 |
0.775 |
Fig. 7(a) represents the PL excitation spectra of Y1−xVO4:xHo3+ phosphor materials in the wavelength range from 220 to 530 nm that are obtained by observing the emission wavelength at 541 nm. The broad excitation band appearing between the ∼220 and 350 nm wavelength range is the charge transfer (CT) transition (at 310 nm) from the oxygen ligand (O2−) to the central vanadium atom (V5+) within the VO43− group, as well as the CT band (at 270 nm) from O2− to Ho3+ ions.32,44,61,62 Some sharp excitation peaks appear at ∼360, 420, 450, 456, 468, 475, and 487 nm, and these are attributed to the transitions from the ground state 5I8 to 3H6, 5G5, 5F1,5G6, 3K8, 5F2, and 5F3 of the excited states of Ho3+ ions, respectively.63 Among all these observed sharp peaks, the 456 nm peak is the most prominent. Under UV excitation of 310 nm, the PL emission spectra of Y1−xVO4:xHo3+ phosphors are measured from the 450 nm to 700 nm wavelength region, and the results are represented in Fig. 7(b). The emission spectra show intense green emissions around 541, 546, and 551 nm, which are attributed to the (5S2 + 5F4) → 5I8 transitions of Ho3+ ion. A few small emission peaks are observed around 475 nm (5F2 → 5I8), 485 nm (5F3 → 5I8), 526 nm (5G5 → 5I7), and 650 and 661 nm (5F5 → 5I8) wavelengths.63,64 Fig. 8 shows the energy level diagram of Ho3+ ion with possible transitions. Under UV excitation at 310 nm, the excitation energy is first absorbed by VO43− group, which excites the electrons from the filled oxygen 2p levels in the valence band to the empty vanadium 3d levels of the conduction band. The emission from the VO43− group is not observed in this phosphor. Instead of emission from the VO43− group, the resonant energy transfer takes place from the VO43− group to the 5G4 level of the Ho3+ ion. From 5G4 level, the non-radiative transitions take place to lower lying levels of Ho3+ ion and due to this, various emissions take place at different wavelengths as indicated in Fig. 8.
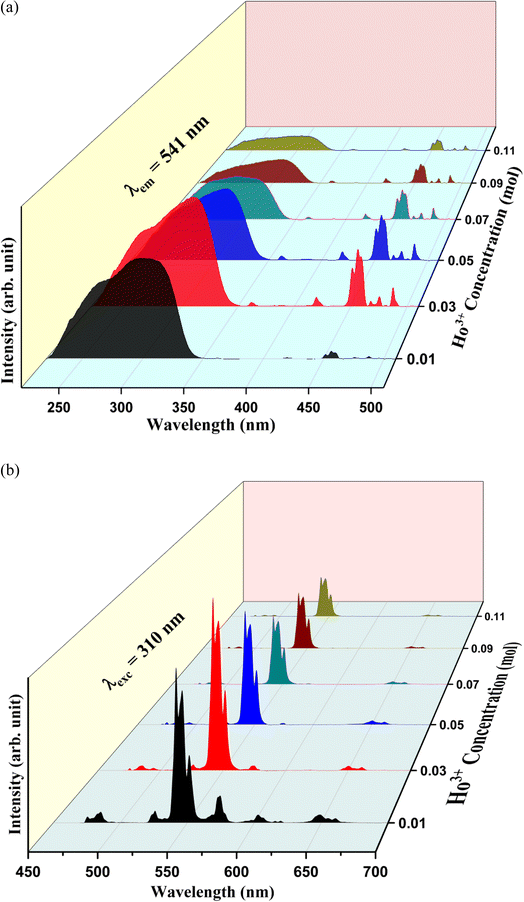 |
| | Fig. 7 Photoluminescence spectra of Y1−xVO4:xHo3+ phosphors: (a) excitation spectra (λemi = 541 nm) and (b) emission spectra (λexc = 310 nm). | |
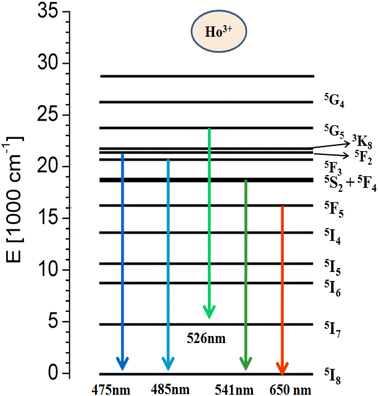 |
| | Fig. 8 Schematic energy level diagram of Ho3+ ion. | |
In general, the doping concentration could affect the efficiency or performance of the phosphor, so it is necessary to analyze the effect of Ho3+ ion concentration on the PL intensity. In the present analysis, the concentration of Ho3+ ion in the YVO4 host is varied from 0.01 to 0.11 mol, and the resultant PL intensity as a function of Ho3+ ion concentration is shown in Fig. 9. The PL intensity is maximum at x = 0.03, and it then decreases due to the effect of concentration quenching. This result suggests that the optimum concentration of Ho3+ ion in the YVO4 host is 0.03 mol. The concentration quenching depends on the critical distance (RC) between the activator ion and the quenching site. According to Blasse, RC can be calculated using the following expression:65
| |
 | (10) |
here,
V = volume of unit cell,
Xc = optimal concentration of Ho
3+ ions, and
N = number of dopant sites available in the unit cell. In our case,
V = 318.82 Å
3,
Xc = 0.03, and
N = 4. From
eqn (10), this equates to a critical distance of 17.18 Å, which is greater than 5 Å, thus indicating a smaller chance of energy transfer
via exchange interaction. Therefore, the process of energy transfer occurs
via electric multipolar interaction, which causes concentration quenching of Ho
3+ ion in the prepared phosphors.
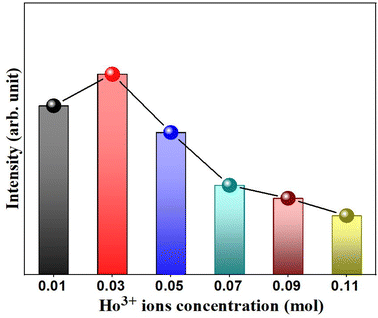 |
| | Fig. 9 Variation of emission intensity (I541nm) as a function of Ho3+ concentration in the Y1−xVO4:xHo3+ phosphor. | |
The peak stimulated emission cross-section (σp) for the (5S2 + 5F4) → 5I8 transition of Ho3+ ion for the optimum (Y0.97VO4:0.03Ho3+) phosphor is also obtained from the following relation53
| |
 | (11) |
Here,
λP and Δ
λeff are the peak wavelength and effective line width of the emission band, respectively. The estimated Δ
λeff and
σp(
λ) are 6.33 nm and 3.22 × 10
−21 cm
2, respectively for the (
5S
2 +
5F
4) →
5I
8 transition of Ho
3+ ions in YVO
4 phosphor. The values of
σp (
λ) (3.22 × 10
−21 cm
2) and
β (0.816) for the green emission of Ho
3+:YVO
4 are larger than Y
2O
3:Ho
3+ (
σp (
λ) = 1.32 × 10
−21 cm
2;
β = 0.65),
58 which suggests that the Ho
3+:YVO
4 phosphor is a desirable optical material for low threshold and high gain applications. These remarkable results provide information on energy transfer from VO
43− group to Ho
3+ ions.
The CIE (Commission International de I'Eclairage) chromaticity coordinates of the prepared Y1−xVO4:xHo3+ phosphor materials are represented in Fig. 10. The results show that the CIE coordinates fall in the green region.66,67 The color coordinates and color purity of the prepared phosphors are summarized in Table 5.
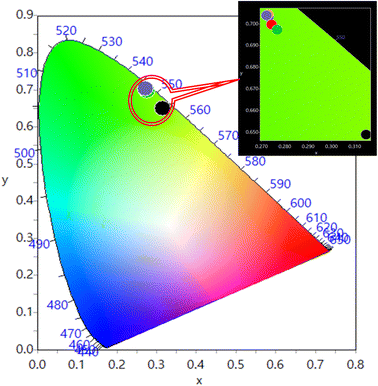 |
| | Fig. 10 CIE diagram for Y1–xVO4:xHo3+ phosphors. | |
Table 5 Commission International de I'Eclairage (CIE) color coordinates and color purity for the Y1−xVO4:xHo3+ phosphors using PL emission at λexc = 310 nm
| Y1−xVO4:xHo3+ |
λexc = 310 nm |
Color purity (%) |
| x |
y |
| x = 0.01 |
0.315 |
0.649 |
84.27( ) ) |
| x = 0.03 |
0.273 |
0.704 |
98.64( ) ) |
| x = 0.05 |
0.274 |
0.700 |
97.61( ) ) |
| x = 0.07 |
0.276 |
0.700 |
97.56( ) ) |
| x = 0.09 |
0.277 |
0.697 |
96.78( ) ) |
| x = 0.11 |
0.282 |
0.699 |
97.18( ) ) |
4. Conclusions
In summary, we report herein the spectroscopic properties of a homogenous series of Y1−xVO4:xHo3+ phosphor materials synthesized using the sol–gel synthesis procedure. SEM analysis shows the irregular particles size of the phosphor. The preparation of a single-phase compound was confirmed by the XRD patterns. The optical transitions of Ho3+ ions are identified through diffuse reflectance spectrum. Using these absorption bands, the oscillator strength of the bands (fexp & fcal), the Judd–Ofelt parameters (Ωλ, λ = 2, 4, & 6), total radiative transition probabilities (AT), radiative lifetimes (τrad), and branching ratios (β) for the transition of Ho3+ ions in Y0.97VO4:0.03Ho3+ phosphor are reported. The energy conversion; and optical direct and indirect bandgaps are observed for YVO4 phosphor doped with Ho3+ ions. In this approach, the energy transfer to the Ho3+ ions supports the results of the spectroscopic analyses. The phosphor exhibited a strong excitation band in the UV region at 310 nm while monitoring emission at 541 nm. Upon 310 nm excitation, all the synthesized phosphors showed intense PL emission in the green region. Concentration quenching of Ho3+ ion was observed after 0.03 mol and this was mainly attributed to the electric multipolar interaction process. The Y0.97VO4:0.03Ho3+ phosphor showed good emissive properties with very high color purity, suggesting that this material would be useful for green emitting devices.
Conflicts of interest
There are no conflicts to declare.
Acknowledgements
This work was supported by the National Research Foundation of Korea (NRF) grant funded by the Korea government (MSIT) (No. 2021R1A2C1092509).
References
- V. Panchal, S. Lopez-Moreno, D. Sanatamaria-Perez, D. Errandonea, F. J. Manjon, P. Rodriguez-Hernandez, A. Munoz, S. N. Achary and A. K. Tyagi, Phys. Rev. B: Condens. Matter Mater. Phys., 2011, 84, 02411 CrossRef
 .
. - V. Panchal, D. Errandonea, A. Segura, P. Rodrguez-Hernandez, A. Munoz, S. Lopez-Moreno and M. Bettinelli, J. Appl. Phys., 2011, 110, 43723 CrossRef
 .
. - N. Deligne, V. Gonze, D. Bayot and M. Devillers, Eur. J. Inorg. Chem., 2008, 6, 896–902 CrossRef
 .
. - E. V. Tsipis, V. V. Kharton, N. P. Vyshatko, A. L. Shaula and J. R. Frade, J. Solid State Chem., 2003, 176, 47–56 CrossRef CAS
 .
. - Z. Xu, X. Kang, C. Li, Z. Hou, C. Zhang, D. Yang, G. Li and J. Lin, Inorg. Chem., 2010, 49, 6706 CrossRef CAS PubMed
 .
. - Z. Y. Hou, P. P. Yang, C. X. Li, L. L. Wang, H. Z. Lian, Z. W. Quan and J. Lin, Chem. Mater., 2008, 20, 6686 CrossRef CAS
 .
. - F. He, P. Yang, N. Niu, W. Wang, S. Gai, D. Wang and J. Lin, J. Colloid Interface Sci., 2010, 343, 71 CrossRef CAS PubMed
 .
. - P. Huang, D. Chen and Y. Wang, J. Alloys Compd., 2011, 509, 3375 CrossRef CAS
 .
. - L. Xie, H. Song, Y. Wang, W. Xu, X. Bai and B. Dong, J. Phys. Chem. C, 2010, 114, 9975 CrossRef CAS
 .
. - L. Li, M. Zhao, W. Tong, X. Guan, G. Li and L. Yang, Nanotechnology, 2010, 21, 195601 CrossRef PubMed
 .
. - M. Yu, J. Lin and J. Fang, Chem. Mater., 2005, 17, 1783–1791 CrossRef CAS
 .
. - A. Bao, H. Lai, Y. Yang, Z. Liu, C. Tao and H. Yang, J. Nanopart. Res., 2010, 12, 635–643 CrossRef CAS
 .
. - E. A. Maunders and L. G. DeShazer, J. Opt. Soc. Am., 1971, 61, 684 Search PubMed
 .
. - F. S. Ermeneux, R. Moncorge, P. Kabro, J. A. Capobianco, M. Bettinelli and E. Cavalli, Adv. Solid State Lasers, OSA, Washington, DC, 1996, p. SM9 Search PubMed
 .
. - J. Sun, J. Zhu, X. Liu and H. Du, Mater. Res. Bull., 2013, 48, 2175–2179 CrossRef CAS
 .
. - J. A. Coppabianco, P. Kabro, F. S. Ermeneux, R. Moncorge, M. Bettinelli and E. Cavalli, Chem. Phys., 1197, 214, 329–340 CrossRef
 .
. - M. Mahata, S. Tiwari, S. Mukherjee, K. Kumar and V. Rai, J. Opt. Soc. Am. B, 2014, 31, 1814–1821 CrossRef CAS
 .
. - J. E. Bernard and A. J. Alcock, Opt. Lett., 1993, 18, 968 CrossRef CAS PubMed
 .
. - G. C. Bowkett, G. W. Baxter, D. J. Booth, T. Taira, H. Teranishi and T. Kobayashi, Opt. Lett., 1194, 19, 957 CrossRef PubMed
 .
. - D. Shen, A. Liu, J. Song and K. Ueda, Appl. Opt., 1198, 37, 7785 CrossRef PubMed
 .
. - X. Li, H. Xu, R. Yan, Y. Jiang, R. Fan, Z. Dong and D. Chen, Optik, 2021, 228, 165789 CrossRef CAS
 .
. - A. K. Levine and F. C. Palilla, Appl. Phys. Lett., 1964, 5, 118–120 CrossRef CAS
 .
. - A. Bril, W. L. Wanmaker and J. Broos, J. Chem. Phys., 1965, 43, 311 CrossRef CAS
 .
. - L. R. Singh and R. S. Ningthoujam, J. Appl. Phys., 2010, 107, 104304–104306 CrossRef
 .
. - W. M. Yen, S. Shionoya and H. Yamamoto, Phosphor Handbook, CRC Press, Boca-Raton, 2nd edn, 1999 Search PubMed
 .
. - C. Hsu and R. C. Powell, J. Lumin., 1975, 10, 273–293 CrossRef CAS
 .
. - M. Wu, S. Choi and H. K. Jung, Mater. Res. Bull., 2016, 78, 20–25 CrossRef CAS
 .
. - U. Rambabu, D. P. Amalnerkar, B. B. Kale and S. Buddhudu, Mater. Res. Bull., 2000, 35, 929–936 CrossRef CAS
 .
. - L. Shirmane, C. Feldmann and V. Pankratov, Phys. B, 2017, 504, 80–85 CrossRef CAS
 .
. - S. M. Rafiaei and M. Shokouhimehr, Mater. Chem. Phys., 2019, 229, 431–436 CrossRef CAS
 .
. - K. E. Foka, B. F. Dejene and H. C. Swart, Phys. B, 2016, 480, 95–99 CrossRef CAS
 .
. - Y. Liu, H. Xiong, N. Zhang, Z. Leng, R. Li and S. Gan, J. Alloys Compd., 2015, 653, 126–134 CrossRef CAS
 .
. - Z. Xu, X. Kang, C. Li, Z. Hou, C. Zhang, D. Yang, G. Li and J. Lin, Inorg. Chem., 2010, 49, 6706–6715 CrossRef CAS PubMed
 .
. - X. Y. Huang, J. X. Wang, D. C. Yu, S. Ye, Q. Y. Zhang and X. W. Sun, J. Appl. Phys., 2011, 109, 113526 CrossRef
 .
. - V. A Medvedev, D. V. Mamonova, I. E. Kolesnikov, A. R. Khokhlova, M. D. Mikhailov and A. A. Manshina, Inorg. Chem. Commun., 2020, 118, 107990 CrossRef
 .
. - H. Zhou, W. Gao, P. Cai, B. Zhang and S. Li, Solid State Sci., 2020, 104, 106283 CrossRef CAS
 .
. - Y. H. Li and G. Y. Hong, J. Solid State Chem., 2005, 175, 645–649 Search PubMed
 .
. - S. Ekambaram and K. C. Patil, J. Alloys Compd., 1995, 217, 104–107 CrossRef CAS
 .
. - A. Dwivedi, E. Rai, D. Kumar and S. B. Rai, ACS Omega, 2019, 4, 6903–6913 CrossRef CAS PubMed
 .
. - M. Yu, J. Lin, Z. Wang, J. Fu, S. Wang, H. J. Zhang and Y. C. Han, Chem. Mater., 2002, 14, 2224–2231 CrossRef CAS
 .
. - L. D. Sun, Y. X. Zhang, J. Zhang, C. H. Yan, C. S. Liao and Y. Q. Lu, Solid State Commun., 2002, 124, 35–38 CrossRef CAS
 .
. - G. Jia, Y. Song, M. Yang, Y. Huang, L. Zhang and H. You, Opt. Mater., 2009, 31, 1032–1037 CrossRef CAS
 .
. - L. Zhu, J. Y. Li, Q. Li, X. D. Liu, J. Meng and X. Q. Cao, Nanotechnology, 2007, 18, 055604–055609 CrossRef
 .
. - Y. H. Zhou and J. Lin, Opt. Mater., 2005, 27, 1426–1432 CrossRef CAS
 .
. - M. R. Dolgos, A. M. Paraskos, M. W. Stoltzfus, S. C. Yarnell and P. M. Woodward, J. Solid State Chem., 2009, 182, 1964–1971 CrossRef CAS
 .
. - W. O. Milligan and L. W. Vernon, J. Phys. Chem. A, 1952, 56, 145–147 CrossRef CAS
 .
. - Y. Sun, H. Liu, X. Wang, X. Kon and H. Zhang, Chem. Mater., 2006, 18, 2726–2732 CrossRef CAS
 .
. - C. Shivakumara, R. Saraf and P. Halappa, Dyes Pigm., 2016, 126, 154–164 CrossRef CAS
 .
. - B. R. Judd, Phys. Rev., 1962, 127, 750 CrossRef CAS
 .
. - G. S. Ofelt, J. Chem. Phys., 1962, 37, 511 CrossRef CAS
 .
. - A. A. Kaminskii, Crystalline Lasers, CRC Press, 1996 Search PubMed
 .
. - W. T. Carnall, H. Crosswhite and H. M. Crosswhite, Energy Level Structure and Transition Probabilities of the Trivalent Lanthanides in Laf, Argonne National Laboratory, Argonne, IL, 1975 Search PubMed
 .
. - M. Seshadri, E. F. Chillcce, J. D. Marconi, F. A. Sigoli, Y. C. Ratnakaram and L. C. Barbosa, J. Non-Cryst. Solids, 2014, 402, 141 CrossRef CAS
 .
. - Ş. Georgescu, A. Ştefan, O. Toma and A.-M. Voiculescu, J. Lumin., 2015, 162, 174–179 CrossRef
 .
. - M. Kaczkan and M. Malinowski, Materials, 2021, 14, 3831 CrossRef CAS PubMed
 .
. - M. Malinowski, Z. Frukacz, M. Szuflinska, A. Wnuk and M. Kaczkan, J. Alloys Compd., 2000, 300–301, 389–394 CrossRef CAS
 .
. - M. Kaczkan, I. Pracka and M. Malinowski, Opt. Mater., 2004, 25, 345–352 CrossRef CAS
 .
. - V. Singh, V. K. Rai, B. Voss, M. Haase, R. P. S. Chakradhar, D. T. Naidu and S. H. Kim, Spectrochim. Acta, Part A, 2013, 109, 206–212 CrossRef CAS PubMed
 .
. - B. M. Walsh, G. W. Grew and N. P. Barnes, J. Phys.: Condens. Matter, 2005, 17, 7643–7665 CrossRef CAS
 .
. - Q. Dong, G. Zhao, J. Chen, Y. Ding, B. Yao and Z. Yu, Opt. Mater., 2010, 32, 873–877 CrossRef CAS
 .
. - S. R. Bullock, B. R. Reddy, P. Venkateswarlu and S. K. N. Stevenson, J. Opt. Soc. Am. B, 1197, 14, 553–559 CrossRef
 .
. - A. Huignard, V. Buissette, A. Franville, T. Gacoin and J. Boilot, J. Phys. Chem. B, 2003, 107, 6754–6759 CrossRef CAS
 .
. - I. E. Kolesnikov, A. A. Kalinichev, M. A. Kurochkin, D. V. Mamonova, E. Y. Kolesnikov and E. Lahderanta, J. Phys. Chem. C, 2019, 123, 5136–5143 CrossRef CAS
 .
. - V. Singha, G. Lakshminarayana, A. Wagh and N. Singh, Optik, 2020, 207, 164284 CrossRef
 .
. - G. Blasse, Phys. Lett. A, 1968, 28, 444–445 CrossRef CAS
 .
. - Monika, R. S. Yadav, A. Rai and S. B. Rai, Sci. Rep., 2021, 11, 4148 CrossRef CAS PubMed
 .
. - P. Tadge, I. R. Martín, S. B. Rai, S. Sapra, T. M. Chen, V. Lavín, R. S. Yadav and S. Ray, J. Lumin., 2022, 252, 119261 CrossRef CAS
 .
.
|
| This journal is © The Royal Society of Chemistry 2023 |
Click here to see how this site uses Cookies. View our privacy policy here.  Open Access Article
 *a,
M. Seshadrib,
Deepak Taikarc,
S. J. Dhobled and
R. S. Yadav
 e
e
![[thin space (1/6-em)]](https://www.rsc.org/images/entities/char_2009.gif) cos
cos![[thin space (1/6-em)]](https://www.rsc.org/images/entities/char_2009.gif) θ
θ


.
.
.
.
.
.
.
.
.
.
.
.
.
.
.
.
.
.
.
.
.
.
.
.
.
.
.
.
.
.
.
.
.
.
.
.
.
.
.
.
.
.
.
.
.
.
.
.
.
.
.
.
.
.
.
.
.
.
.
.
.
.
.
.
.
.
.


