 Open Access Article
Investigation of small inhibitor effects on methane hydrate formation in a carbon nanotube using molecular dynamics simulation†
Mohsen Abbaspour *a,
Fateme Fotourechia,
Hamed Akbarzadehb and
Sirous Salemia
aDep. of Chemistry, Hakim Sabzevari University, Sabzevar, Iran. E-mail: m.abbaspour@hsu.ac.ir
bDep. of Physical Chemistry, Faculty of Chemistry, Kharazmi University, Tehran, Iran
First published on 28th February 2023
Abstract
In this work, we simulated water molecules in fixed and rigid (15,0) CNTs and the confined water molecules formed a hexagonal ice nanotube in the CNT. After the addition of methane molecules in the nanotube, the hexagonal structure of confined water molecules disappeared and were replaced by almost all the guest methane molecules. The replaced molecules formed a row of water molecules in the middle of the hollow space of the CNT. We also added five small inhibitors with different concentrations (0.8 mol% and 3.8 mol%) to methane clathrates in CNT: benzene, 1-ethyl-3-methylimidazolium chloride ionic liquid ([emim+][Cl−] IL), methanol, NaCl, and tetrahydrofuran (THF). We investigated the thermodynamic and kinetic inhibition behaviors of the different inhibitors on the methane clathrate formation in the CNT using the radial distribution function (RDF), hydrogen bonding (HB), and angle distribution function (ADF). Our results showed that the [emim+][Cl−] IL is the best inhibitor from both aspects. It was also shown that the effect of THF and benzene is better than that of NaCl and methanol. Furthermore, our results showed that the THF inhibitors tended to aggregate in the CNT, but the benzene and IL molecules were distributed along the CNT and can affect the inhibitor behavior of THF in the CNT. We have also examined the effect of CNT chirality using the armchair (9,9) CNT, the effect of CNT size using the (17,0) CNT, and the effect of CNT flexibility using the (15,0) CNT by the DREIDING force field. Our results showed that the IL has stronger thermodynamic and kinetic inhibition effects in the armchair (9,9) and the flexible (15,0) CNT than the other systems, respectively.
1. Introduction
Gas hydrates are compounds in which water molecules create cage-like structures and trap gas molecules such as methane. The cage structures are formed using the hydrogen bonding (HB) of water molecules.1,2 There is a large amount of methane stored as methane hydrates (methane clathrates) at the ocean floor. In recent years, many scientists have paid much attention to clathrates because of their important role as an energy source.3 It has been anticipated that the derivable energy of gas clathrates in the ocean is about twice that of all other fossil fuels.4,5 The gas hydrate is also a clean fuel because the combustion of methane produces only H2O and CO2. It should also be noted that CO2 and CH4 are greenhouse gases. Therefore, the exploitation of oceanic methane hydrates requires the development of technologies to expediently condense water and reinsert carbon dioxide into the hydrate from which methane was extracted.4Gas clathrates can be also created during oil transportation. In this case, gas hydrates produce a major problem because they block the oil transport process.4,6 Therefore, many attempts have been made in recent years to understand the mechanism of clathrate creation and control (or inhibit) the formation of gas clathrates by several factors and different chemical compounds through the molecular simulations approach. For example, Anderson et al.7 investigated the performance of four hydrate inhibitors (PVP, PEO, VIMA, and PVCap) with the hydrate surface using molecular dynamic (MD) simulations. They found that the binding of inhibitors to the hydrate surface discomposes hydrate crystallization and growth. Luis et al.4 examined the effect of an external electric field on the three-phase coexistence temperature of methane gas, liquid water and methane hydrate using MD simulation. They found that the external electric field in the range of 0.1–0.9 (V nm−1) causes a 22.5 K shift of the three-phase coexistence temperature to higher temperatures. Bai et al.8 simulated gas hydrate nucleation and growth in aqueous NaCl solution. They found that the hydrate formation begins in a region with low ionic concentration, and the electrolyte ions prevent the hydrate formation. Bhattacharjee et al.9 investigated the effect of a polar amino acid on gas hydrate growth kinetics using MD simulation. They indicated that the gas hydrate growth kinetics is significantly enhanced in presence of the amino acid. Choudhary et al.10 investigated the effect of additives on gas hydrate formation using MD simulation. They showed that a low concentration of methanol and NaCl enhances gas hydrate growth kinetics. Zi et al.11 investigated the gas hydrate formation and inhibition on a metal surface. They proved the inhibition effects of light oil on the gas hydrate growth.
Recently, Tariq et al.12 reviewed the role of ionic liquids as gas hydrate inhibitors and concluded that ionic liquids are efficient thermodynamic inhibitors. They showed that the efficiency of the ionic liquids decreased as the length of the alkyl chain of the cation increased. They also indicated that more research studies are needed in this area to examine economic, biocompatible, and noncorrosive ionic liquids. Haji et al.13 investigated the inhibition mechanism of some imidazolium ionic liquids on gas hydrate formation using MD simulation. They showed that the presence of ions near the hydrate structure leads to the prevention of water and gas molecules adsorbing on the surface, and inhibits the growth of gas hydrate crystals. Chu et al.14 experimentally examined the effects of ionic liquids on the dissociation temperature of methane hydrate, and found that a smaller length of alkyl chain leads to a stronger inhibition effect.
Understanding the transport of gases and their physio-chemical interactions in nano-confinements is very important because this knowledge enables us to prepare more efficient strategies for gas storage processes at the nano-scale environments.15 The mechanism of multi-scale shale gas formation and the gas transmissibility in the process of shale gas recovery are some of the most relevant examples that need further investigations.15,16 Among different nanopores, carbon nanotubes (CNTs) have received much attention in scientific research in recent years because of their unique physical properties and important potential applications. Many of these applications are associated with gas absorption and high-rate flowing gases through the nanopores.15,17,18 Moreover, an important and urgent subject that is given less attention is the potential of CNT channel membranes for gas hydrate formation.15 Recently, Zhao et al.1 studied the formation of H2 hydrates in carbon nanotubes. They found that the hydrogen molecules in the gas hydrate structures are contained in a one-dimensional nanochannel, in which the guest hydrogen molecules create a molecular wire. More recently, Akbarzadeh et al.19 investigated the formation of methane hydrates in carbon nanotubes with different sizes. They showed that the water molecules are replaced by the guest CH4 molecules in the ice nanotubes.
In this work, we initially simulated water molecules confined in (15,0) CNT. After that, to form the methane clathrate, methane molecules were added in the nanotube. Then, to examine the small clathrate inhibitors, we added five inhibitors with the different concentrations (0.8 mol% and 3.8 mol%) to the methane clathrates in the CNT: benzene, 1-ethyl-3-methylimidazolium chloride ionic liquid ([emim+][Cl−] IL), methanol, NaCl, and tetrahydrofuran (THF). We also investigated the thermodynamic and kinetic inhibition behaviors of the different inhibitors on the methane clathrate formation in the CNT using the radial distribution function (RDF), hydrogen bonding (HB), and angle distribution function (ADF).
2. Simulation method
We initially simulated 108 water molecules in (15,0) CNT with the length of 50 Å (according to the work of Zhao et al.1). Next, to form the methane clathrate, we simulated 108 water molecules and 18 methane molecules in the CNT.1 Finally, to examine the effect of different inhibitors, 108 water molecules, 18 methane molecule and one (0.8 mol%) or five (3.8 mol%) inhibitor molecules (benzene, 1-ethyl-3-methylimidazolium chloride ionic liquid ([emim+][Cl−] IL), methanol, NaCl, and tetrahydrofuran (THF)) were simulated in the CNT.Our simulations for pure water, water + methane, and water + methane + inhibitor in the CNT were initially run at 1000 K for 1 ns to overcome the initial configurations. Then, the simulations were performed at 250 K for 20 ns of equilibration, followed by a production time of 5 ns for calculated properties.1,20 In these simulations, the CNT was kept in a fixed position.1,19,20 We performed all of the simulations in the NVT ensemble, and the Nosé–Hoover thermostat was used with the relaxation time of 0.1 ps. The DL_POLY software21 was used with the Verlet leapfrog algorithm with the time step of 1 fs. The Ewald summation method was used for electrostatic interactions. The cutoff distance was 12 Å. Periodic boundary conditions were applied in all three directions. To avoid artificial influence from periodic images, the CNT was placed in the center of a simple orthorhombic box with vacuum on both sides separating it from the next periodic image in Z direction. We used the SPC/E22 model for the confined water molecules. Previous investigations23,24 on the ability of different water models to compute the thermodynamics, dynamics, and structure of the nano-confined water molecules indicated that the results of some water models are almost similar, but the SPC/E water model is the optimum choice. The OPLS-AA potential is an accurate force field model that can describe the structural and thermodynamic properties of a variety of organic molecules.25,26 The OPLS-AA model was used for benzene, ionic liquid, methanol, and THF.26–28 Fu and Tian27 examined the capability of different forcefields (including OPLS-AA, AMBER, CHARMM, GROMOS) in the calculation of the experimental structural and thermodynamics properties of liquid benzene using MD simulations, and recommended that the OPLS-AA is the best one. We also successfully used the OPLS-AA model for the simulation of ionic liquid.29,30 Recently, the OPLS-AA force field has been used in the simulation of THF as a solvent.26 The methane molecule is modeled by a united-atom 12-6 LJ model (σ = 3.758 Å and ε = 0.2959 kcal mol−1).31 The Lennard-Jones (LJ) potential was also used to represent the interactions of Na+ and Cl− ions.32 The LJ parameters for the heterogeneous interactions were obtained by utilizing the geometric mean for ε and the arithmetic mean for σ.33 According to the previous simulations on the gas hydrate formation in nanostructures,1,19,34 the charge on every atom was fixed during these simulations and no charge was considered on the CNT atoms or the gas molecules.
3. Results and discussion
3.1 The methane hydrate and inhibitors in the CNT
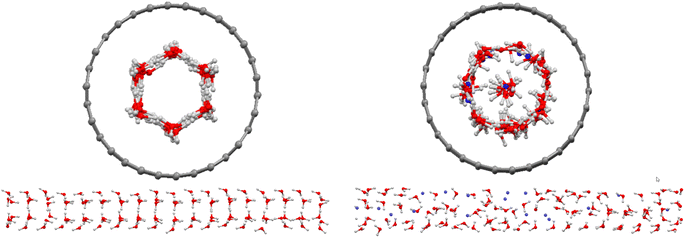
Initially, we simulated 108 water molecules in (15,0) CNT, and the final configuration after 25 ns of simulation time is presented in Fig. 1. In agreement with the previous simulations on water molecules in the (15,0) CNT,1 the water molecules form a hexagonal ice nanotube in the CNT. After the addition of 18 methane molecules in the nanotube, the hexagonal structure of confined water molecules disappeared and are replaced by almost all of the guest methane molecules (with the exception of 3 methane molecules). The replaced molecules (14 water molecules) formed a row of water molecules in the middle of the hollow space of the CNT (Fig. 1). Previous studies indicated that the guest–ice nanotube interaction plays a significant role in the structure of the formed gas clathrates.35 Due to the stronger methane–CNT than ice–CNT interactions, the guest CH4 molecules tend to replace the water molecules in the wall of the ice nanotube. However, it is not clear why three methane molecules stayed in the middle space of the CNT. This can be due to the competition between the guest–CNT interaction and the hydrogen bond (HB) network in the ice nanotube. The confined water molecules try to keep the HB network in the ice nanotube, but the guest methane molecules reduce the number of the HBs between the confined water molecules.Recently, Zhao et al.1 simulated 108 water and 18 hydrogen molecules confined in the same nanotube. However, their results showed that all of the added gas molecules were positioned in the middle space of the CNT. The difference between our results using the methane gas and the simulated results of Zhao et al.1 using hydrogen gas is because of the fact that the methane–CNT interactions are stronger than the hydrogen–CNT interactions (the attraction parameter of the LJ potential for methane is ε = 0.2959 (kcal mol−1)31 and for hydrogen is ε = 0.1039 (kcal mol−1)36).
After the addition of one (0.8 mol%) and five (3.8 mol%) inhibitor molecules in the CNT, the methane molecules in the middle of the hollow space of the CNT increase, whereas the water molecules decrease in this area. This is due to the change of different interactions by adding the inhibitor molecules. According to Fig. S1 in the ESI,† after the addition of the inhibitors in the confined methane clathrate, the absorbed methane molecules in the ice nanotube are replaced by the added inhibitors. Therefore, the number of methane molecules in the middle space of the CNT increases. In this case, the number of water molecules in the middle space is more than the blank system (methane clathrate without the inhibitor). However, by adding more inhibitor molecules, some of them are placed in the middle space.
3.2 Thermodynamic inhibition of methane hydrate in the CNT
Addition of an inhibitor increases the Gibbs free energy, whereas the enthalpy change is relatively constant. To increase the Gibbs free energy, the inhibitor initially changes the structure of the water molecules. In other words, the inhibitor leads to non-randomness or a structure other than hydrate-like nanoclusters in water. Therefore, the performance of the inhibitor material is aided by the competition of water molecules to interact with the inhibitor by hydrogen bonding (HB) or coulombic forces. Therefore, the more the inhibitor affects the structure of the water molecules, the better thermodynamic inhibitor is the inhibitor material.13To examine the effect of thermodynamic inhibition by the different inhibitors, it is better to compare their radial distribution functions (RDFs) between the oxygen atoms of the confined water molecules. The RDFs for the confined molecules have been computed using the following formula:37
 | (1) |
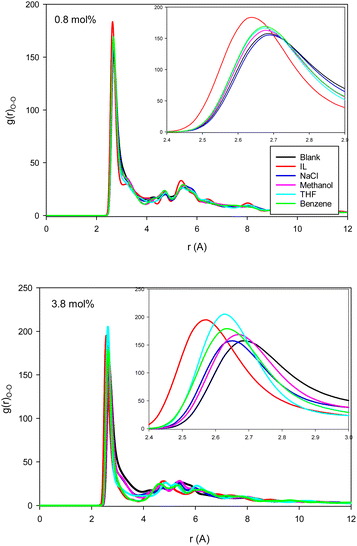 | ||
| Fig. 2 The water–water (O–O) RDFs for the different systems containing one (0.8 mol%) and five (3.8 mol%) inhibitors in the CNT. | ||
The second first O–O RDF peak represents the number of hydrogen bonds (HBs) in the system.38 According to Fig. 2, the IL, THF, and benzene must have a greater number of HBs between the confined molecules. To examine this idea, we calculated the average number of HBs per water molecule (〈HB〉) for the different systems from the last configuration of the confined molecules using the VMD software39 by the criteria of HB length of 2.7 Å and angle of 150°, and the results are presented in Fig. 3. The 〈HB〉 results in Fig. 3 are almost in good agreement with the O–O RDFs in Fig. 2, as expected. According to Fig. 3, the 〈HB〉 between water molecules decreases by addition of methane to the pure water because of the methane hydrate formation. The 〈HB〉 increases by addition of inhibitor molecules because the added inhibitor displaces the methane molecules from the wall of the ice nanotube to the middle space. Therefore, the interaction between the water molecules in the ice nanotube increases. It is also shown that the 〈HB〉 increases by increasing the inhibitor concentration, which is due to the displacement of the confined water molecules in the middle space to the wall of the ice nanotube because some of the added inhibitor molecules are positioned in the middle space of the CNT. By comparison between the O–O RDFs and 〈HB〉 in Fig. 2 and 3, we can conclude that a better inhibitor leads to more 〈HB〉 between the water molecules.
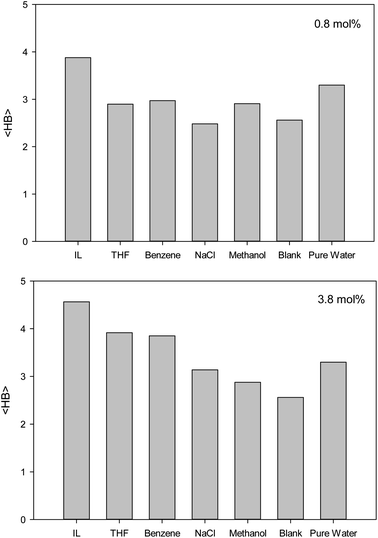 | ||
| Fig. 3 The average number of HBs per water molecule (〈HB〉) for the different systems containing one (0.8 mol%) and five (3.8 mol%) inhibitors in the CNT. | ||
3.3 Kinetic inhibition of methane hydrate formation in the CNT
Fig. 4 shows the methane–methane RDFs for the blank (without inhibitor) system at the initial state and after 25 ns of simulation. According to this figure, the maximum of the first RDF peak is shifted a bit to a greater distance as the simulation time increases. This is due to the tendency of the system to form methane clathrate since the methane–methane distance is longer in the clathrate structure. Although a similar result has been obtained in the formed methane clathrates in bulk systems,13 the shift in the nanotube is much smaller because of the confinement. We also present the methane–methane RDFs for the systems containing different inhibitors at the final state after 25 ns of simulation time in Fig. 4. In comparison with the blank system, the maxima are less shifted to larger distances. This result indicates the kinetic inhibition behavior of the inhibitors, which postpones clathrate formation.13 As Fig. 4 shows, at smaller inhibitor concentration, the THF is better. At higher concentration, the IL and benzene systems represent better performances, and are better kinetic inhibitors for clathrate formation in the CNT. The IL, benzene, and THF were also better thermodynamic inhibitors in the previous section. Our results are in good agreement with the simulation results of Choudhary et al.,10 which reported that a low concentration of methanol and NaCl enhances gas hydrate growth kinetics.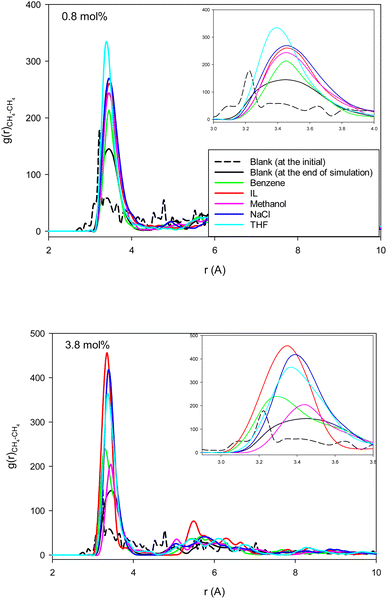 | ||
| Fig. 4 The methane–methane RDFs for the different systems containing one (0.8 mol%) and five (3.8 mol%) inhibitors in the CNT. | ||
3.4 Effects of CNT chirality, size, and flexibility
To examine the effect of CNT chirality, we simulated 108 water molecules and 18 methane molecules in (9,9) CNT with a length and diameter similar to that of the (15,0) CNT. To study the effect of the CNT size, we simulated 144 water molecules and 18 methane molecules in (9,9) CNT with a length similar to that of the (15,0) CNT (according to the work of Zhao et al.1). Finally, to investigate the effect of CNT flexibility, we simulated 108 water molecules and 18 methane molecules in (15,0) CNT with the length of 50 Å using the DREIDING force field.21 According to the previous sections, the IL was a better thermodynamic and kinetic inhibitor for clathrate formation in the CNT. Therefore, to investigate the effect of the inhibitor in these systems, we used just five (3.8 mol%) ILs in the different CNTs.As we discussed before, the thermodynamic inhibitor leads to disorder in the structure of confined water molecules (water–water RDFs) in the CNT. The more intense RDF peaks at shorter distances represent more disorder relative to the blank system. The water–water (O–O) RDFs for the confined water molecules in the different systems are presented in Fig. 5. As this figure shows, IL leads to more intense RDF peaks at shorter distances relative to the blank systems. Therefore, IL has the thermodynamic inhibition effect in all systems. It is found that the amount of RDF shift to the shorter distance is more for the armchair (9,9) CNT (0.15 Å) than the other systems (0.1 Å).
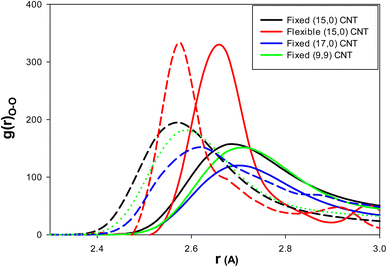 | ||
| Fig. 5 The water–water (O–O) RDFs for the different effects: the solid lines are for the blank CNTs and the dashed lines are for the (3.8 mol%) IL content CNTs. | ||
We present the methane–methane RDFs for the different blank systems at the initial state and after 25 ns of simulation time in Fig. S2 in the ESI.† According to this figure, such as the fixed (15,0) CNT in Fig. 4, the maximum of the first RDF peak is shifted to a larger distance as the simulation time increases (because of the clathrate formation). We also added the methane–methane RDFs for these systems containing 3.8 mol% IL at the final state after 25 ns of simulation time in Fig. S2.† It is shown in all systems that the maxima are less shifted to larger distances relative the blank systems (because of the kinetic inhibition behavior of IL). We also compared the methane–methane RDFs of the blank and IL-content CNTs at the end of the simulation times for the different systems in Fig. 6. As this figure shows, IL has better kinetic inhibition effect in the flexible CNT because the difference between the blank and IL-content CNTs is greater. Therefore, it postpones the clathrate formation more in the flexible CNT than the other rigid (and fixed) CNTs.
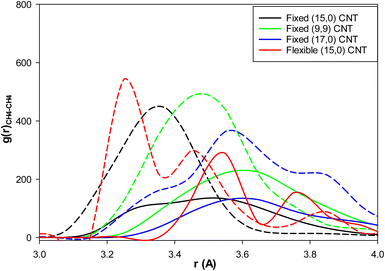 | ||
| Fig. 6 The methane–methane RDFs for the different effects: the solid lines are for the blank CNTs and the dashed lines are for the (3.8 mol%) IL content CNTs at the end of the simulations. | ||
3.5 Configuration of cyclic inhibitors in the CNT
To investigate the configuration of the inhibitor molecules with cyclic structure, we have computed the angle distribution function (ADF) for the confined inhibitors in the fixed (15,0) CNT (Fig. 7). The ADF shows the probability of finding the cyclic molecules at a specific orientation angle. The ADF is a histogram over a development of a certain angle in the system, such as the RDF, which is the distance development. The ADF for the confined cyclic molecules has been calculated using the following equation using the TRAVIS software:40
 | (2) |
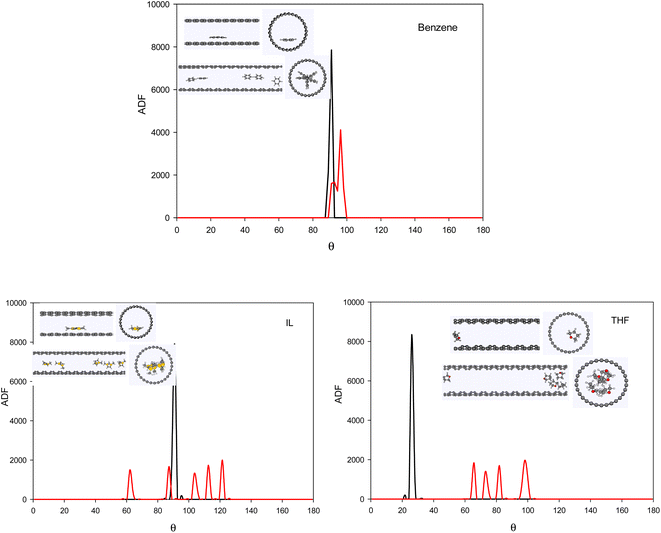 | ||
| Fig. 7 The ADF of the systems with cyclic inhibitors containing one (0.8 mol%) and five (3.8 mol%) inhibitor in the CNT. | ||
4. Concluding remarks
In this work, we have simulated 108 water molecules in fixed and rigid (15,0) CNTs, and the confined water molecules formed a hexagonal ice nanotube in the CNT. After the addition of 18 methane molecules in the nanotube, the hexagonal structure of the confined water molecules disappeared. The water molecules in the hexagonal structure are replaced by almost all of the guest methane molecules. The replaced molecules formed a row of water molecules in the middle of the hollow space of the CNT.After the addition of one inhibitor molecule in the confined methane clathrate, the absorbed methane molecules in the ice nanotube are replaced by the added inhibitor. Therefore, the number of methane molecules in the middle space of the CNT increases. In this case, the number of water molecules in the middle space is greater than that the blank system. However, by addition of more inhibitor molecules, some of them are placed in the middle space.
The more the inhibitor affects the structure of the water molecules, the better thermodynamic inhibitor is the inhibitor material. In fact, the water–water (O–O) RDF peaks with intense maxima at shorter distances represent more disorder in the water phase relative to the blank system. Our results showed that IL leads to the greatest change in the RDF of the blank system. It is also shown that the effect of THF and benzene is more than that of NaCl and methanol. The change in the water–water RDF also increases by increasing the number of inhibitor molecules. Our 〈HB〉 results were also in good agreement with the O–O RDFs. The 〈HB〉 between water molecules decreases by the addition of methane to pure water because of the methane hydrate formation. It is also shown that the 〈HB〉 increases by increasing the inhibitor concentration. The better inhibitor leads to more 〈HB〉 between the water molecules.
In comparison with the blank system, the maxima in the methane–methane RDFs are less shifted to larger distances. This result indicates the kinetic inhibition behavior of the inhibitors, which postpones clathrate formation. Our results showed that the THF is better at smaller inhibitor concentration. At higher concentration, the IL and benzene systems exhibit better performances and are better kinetic inhibitors for clathrate formation in the CNT. Our results also showed that the THF inhibitors tend to aggregate in the CNT, but the benzene and IL molecules were distributed along the CNT, which can be a reason why the effect of more THF molecules is not as high as we expect for the dependence of inhibitor to the concentration.
We have also examined the effect of CNT chirality using the armchair (9,9) CNT, the effect of CNT size using the (17,0) CNT, and the effect of CNT flexibility using the (15,0) CNT by DREIDING force field. Our results showed that IL has the thermodynamic inhibition effect in all systems. It is also found that IL has the stronger thermodynamic inhibition effect on the armchair (9,9) CNT than the other systems. Our results indicated that the IL has also the kinetic inhibition effect in all systems. The IL has also better kinetic inhibition effect in the flexible CNT than the other systems.
Conflicts of interest
There are no conflicts to declare.References
- W. Zhao, L. Wang, J. Bai, J. S. Francisco and X. C. Zeng, Spontaneous formation of one-dimensional hydrogen gas hydrate in carbon nanotubes, J. Am. Chem. Soc., 2014, 136(30), 10661–10668 CrossRef CAS PubMed.
- E. D. Sloan Jr and C. A. Koh, Clathrate hydrates of natural gases, CRC Press, FL, 2007 Search PubMed.
- A. K. Sum, C. A. Koh and E. D. Sloan, Clathrate hydrates: from laboratory science to engineering practice, Ind. Eng. Chem. Res., 2009, 48(16), 7457–7465 CrossRef CAS.
- D. P. Luis, J. López-Lemus, M. L. Maspoch, E. A. Franco-Urquiza and H. Saint-Martin, Methane hydrate: shifting the coexistence temperature to higher temperatures with an external electric field, Mol. Simul., 2016, 42(12), 1014–1023 CrossRef CAS.
- Y. F. Makogon, Hydrates of hydrocarbons, PennWell Books, Tulsa, OK, 1997 Search PubMed.
- E. G. Hammerschmidt, Formation of gas hydrates in natural gas transmission lines, Ind. Eng. Chem., 1934, 26(8), 851–855 CrossRef CAS.
- B. J. Anderson, J. W. Tester, G. P. Borghi and B. L. Trout, Properties of inhibitors of methane hydrate formation via molecular dynamics simulations, J. Am. Chem. Soc., 2005, 127(50), 17852–17862 CrossRef CAS PubMed.
- D. Bai, Z. Wu, C. Lin and D. Zhou, The effect of aqueous NaCl solution on methane hydrate nucleation and growth, Fluid Phase Equilib., 2019, 487, 76–82 CrossRef CAS.
- G. Bhattacharjee, N. Choudhary, A. Kumar, S. Chakrabarty and R. Kumar, Effect of the amino acid l-histidine on methane hydrate growth kinetics, J. Nat. Gas Sci. Eng., 2016, 35, 1453–1462 CrossRef CAS.
- N. Choudhary, O. S. Kushwaha, G. Bhattacharjee, S. Chakrabarty and R. Kumar, Molecular dynamics simulation and experimental study on the growth of methane hydrate in presence of methanol and sodium chloride, Energy Procedia, 2017, 105, 5026–5033 CrossRef CAS.
- M. Zi, D. Chen and G. Wu, Molecular dynamics simulation of methane hydrate formation on metal surface with oil, Chem. Eng. Sci., 2018, 191, 253–261 CrossRef CAS.
- M. Tariq, D. Rooney, E. Othman, S. Aparicio, M. Atilhan and M. Khraisheh, Gas hydrate inhibition: a review of the role of ionic liquids, Ind. Eng. Chem. Res., 2014, 53(46), 17855–17868 CrossRef CAS.
- M. E. H. Nasrollahebrahim, B. Abareshi, C. Ghotbi, V. Taghikhani and H. Amir, Investigation of six imidazolium-based ionic liquids as thermo-kinetic inhibitors for methane hydrate by molecular dynamics simulation, arXiv, 2017, preprint, arXiv:1707.06229 [physics.chem-ph], DOI:10.48550/arXiv.1707.06229.
- C. K. Chu, S. T. Lin, Y. P. Chen, P. C. Chen and L. J. Chen, Chain length effect of ionic liquid 1-alkyl-3-methylimidazolium chloride on the phase equilibrium of methane hydrate, Fluid Phase Equilib., 2016, 413, 57–64 CrossRef CAS.
- M. Shahbabaei and D. Kim, Assessment of Hydrate Formation, Storage Capacity, and Transport Properties of Methane and Carbon Dioxide through Functionalized Carbon Nanotube Membranes, J. Phys. Chem. C, 2021, 125(18), 10011–10026 CrossRef CAS.
- P. D. Gamson, B. B. Beamish and D. P. Johnson, Coal microstructure and micropermeability and their effects on natural gas recovery, Fuel, 1993, 72(1), 87–99 CrossRef CAS.
- S. Joseph and N. R. Aluru, Why are carbon nanotubes fast transporters of water?, Nano Lett., 2008, 8(2), 452–458 CrossRef CAS PubMed.
- S. S. Han, J. K. Kang, H. M. Lee, A. C. Van Duin and W. A. Goddard III, Liquefaction of H2 molecules upon exterior surfaces of carbon nanotube bundles, Appl. Phys. Lett., 2005, 86(20), 203108 CrossRef.
- H. Akbarzadeh, M. Abbaspour, S. Salemi and A. Nazarian, Formation of methane clathrates in carbon nanotubes: a molecular dynamics study, New J. Chem., 2018, 42(9), 7083–7095 RSC.
- M. Abbaspour, H. Akbarzadeh, S. Salemi and L. Bahmanipour, Structure, dynamics, and morphology of nanostructured water confined between parallel graphene surfaces and in carbon nanotubes by applying magnetic and electric fields, Soft Matter, 2021, 17(11), 3085–3095 RSC.
- W. Smith, T. R. Forester and I. T. Todorov, The DL_POLY molecular simulation package, CCLRC, Daresbury Laboratory, Daresbury, Warrington, England, 1999 Search PubMed.
- H. J. C. Berendsen, J. R. Grigera and T. P. Straatsma, The missing term in effective pair potentials, J. Phys. Chem., 1987, 91(24), 6269–6271 CrossRef CAS.
- A. K. Giri, F. Teixeira and M. N. D. Cordeiro, Structure and kinetics of water in highly confined conditions: A molecular dynamics simulation study, J. Mol. Liq., 2018, 268, 625–636 CrossRef CAS.
- S. Chakraborty, H. Kumar, C. Dasgupta and P. K. Maiti, Confined water: structure, dynamics, and thermodynamics, Acc. Chem. Res., 2017, 50, 2139–2146 CrossRef CAS PubMed.
- V. Marcon and G. Raos, Free energies of molecular crystal surfaces by computer simulation: Application to tetrathiophene, J. Am. Chem. Soc., 2006, 128(5), 1408–1409 CrossRef CAS PubMed.
- M. Chiu, T. W. Kee and D. M. Huang, Coarse-grained simulations of the effects of chain length, solvent quality, and chemical defects on the solution-phase morphology of MEH-PPV conjugated polymers, Aust. J. Chem., 2012, 65(5), 463–471 CrossRef CAS.
- C. F. Fu and S. X. Tian, A comparative study for molecular dynamics simulations of liquid benzene, J. Chem. Theory Comput., 2011, 7(7), 2240–2252 CrossRef CAS PubMed.
- W. L. Jorgensen, D. S. Maxwell and J. Tirado-Rives, Development and testing of the OPLS all-atom force field on conformational energetics and properties of organic liquids, J. Am. Chem. Soc., 1996, 118(45), 11225–11236 CrossRef CAS.
- M. Abbaspour, H. Akbarzadeh, P. Yousefi and M. Razmkhah, Investigation of solvation of iron nanoclusters in ionic liquid 1-butyl-1, 1, 1-trimethylammonium methane sulfonate using molecular dynamics simulations: Effect of cluster size at different temperatures, J. Colloid Interface Sci., 2017, 504, 171–177 CrossRef CAS PubMed.
- M. N. Jorabchi, M. Abbaspour, E. K. Goharshadi and S. Wohlrab, Ag, Au, Pt, and Au-Pt nanoclusters in [N1114][C1SO3] ionic liquid: A molecular dynamics study, J. Mol. Liq., 2022, 360, 119447 CrossRef CAS.
- J. Bai, C. A. Angell and X. C. Zeng, Guest-free monolayer clathrate and its coexistence with two-dimensional high-density ice, Proc. Natl. Acad. Sci. U. S. A., 2010, 107(13), 5718–5722 CrossRef PubMed.
- D. E. Smith and L. X. Dang, Computer simulations of NaCl association in polarizable water, J. Chem. Phys., 1994, 100(5), 3757–3766 CrossRef CAS.
- H. Mosaddeghi, S. Alavi, M. H. Kowsari and B. Najafi, Simulations of structural and dynamic anisotropy in nano-confined water between parallel graphite plates, J. Chem. Phys., 2012, 137(18), 184703 CrossRef PubMed.
- M. Abbaspour, H. Akbarzadeh, S. Salemi and S. F. Tahami, Formation of methane clathrates into fullerene: A molecular dynamics study, J. Mol. Liq., 2022, 367, 120587 CrossRef CAS.
- H. Tanaka and K. Koga, Formation of ice nanotube with hydrophobic guests inside carbon nanotube, J. Chem. Phys., 2005, 123(9), 094706 CrossRef PubMed.
- R. F. Cracknell, Molecular simulation of hydrogen adsorption in graphitic nanofibres, Phys. Chem. Chem. Phys., 2001, 3(11), 2091–2097 RSC.
- F. Taherkhani and B. Minofar, Effect of nitrogen doping on glass transition and electrical conductivity of [EMIM][PF6] ionic liquid encapsulated in a zigzag carbon nanotube, J. Phys. Chem. C, 2017, 121(29), 15493–15508 CrossRef CAS.
- M. Abbaspour, H. Akbarzadeh, M. N. Jorabchi, S. Salemi and N. Ahmadi, Investigation of doped carbon nanotubes on desalination process using molecular dynamics simulations, J. Mol. Liq., 2022, 348, 118040 CrossRef CAS.
- W. Humphrey, A. Dalke and K. Schulten, VMD: visual molecular dynamics, J. Mol. Graphics, 1996, 14(1), 33–38 CrossRef CAS PubMed.
- M. Brehm and B. Kirchner, TRAVIS-a free analyzer and visualizer for Monte Carlo and molecular dynamics trajectories, J. Chem. Inf. Model., 2011, 51, 2007–2023 CrossRef CAS PubMed.
Footnote |
| † Electronic supplementary information (ESI) available. See DOI: https://doi.org/10.1039/d2ra06518e |
| This journal is © The Royal Society of Chemistry 2023 |

