 Open Access Article
Crystal defect induced zero thermal quenching β-NaYF4: Eu3+, Sm3+ red-emitting phosphor
Shaokun Lingb,
Xiaoyan Qinc,
Yifeng Yanb,
Chang Chenb,
Kai Mengb,
Junyun Mingb,
Sen Liao *ab,
Yingheng Huang*b and
Lei Hou*d
aSchool of Chemistry and Chemical Engineering, Guangxi University, Nanning, Guangxi 530004, China. E-mail: liaosen@gxu.edu.cn
bSchool of Resources, Environment and Materials, Guangxi University, Nanning, Guangxi 530004, China. E-mail: huangyingheng@163.com
cSchool of Intelligent Equipment Engineering, Guangxi Agricultural Vocational and Technical University, 530009, China
dPublicity Department and United Front Work Department, Guangxi University of Information Engineering, 530200, China
First published on 22nd December 2022
Abstract
Red phosphors with brilliant performance are crucial for the application of white LEDs as their red-light component. However, the thermal quenching phenomenon is an inevitable obstacle in the practical application of various types of red-light phosphors. In this study, we report the preparation of a novel type of phosphor, NaYF4: 0.065Eu3+, 0.002Sm3+, possessing not only an energy transfer effect from Sm3+ to Eu3+ but also superior negative thermal quenching (NTQ) performance. The phosphor was synthesized via a one-step hydrothermal method, resulting in a prominent improvement in its luminous thermal stability supported by NTQ. The NTQ originated from the thermal stimulation excitement of the captured electrons in electronic traps, which is attributed to the non-equivalence between the different types of ions. The shape of the emission spectrum measured at high temperature was identical to that measured at room temperature, which not only showed the remarkable thermal stability of this novel type of phosphor but also the promising prospect of its practical application. This finding will contribute to improving the thermal stability of phosphor materials doped with lanthanide elements.
1. Introduction
Light-emitting diodes (LEDs) provide a light source with the characteristics of low energy consumption and high luminous efficiency for various fields,1 such as indoor illumination systems,2 agricultural lighting for plants,3 bedroom light in hospitals for comforting individuals,4 and backlight source of mini-LED and micro-LED display systems.5,6However, current commercial WLEDs still exhibit some problems that need to be solved, as follows: (a) they have a low color rendering index and high correlated color temperature caused by the traditional method for the combination of YAG: Ce3+ and InGaN chips with blue emission color7,8 and (b) their emissions lack red-emitting phosphors.9 Thus, to overcome these problems, researchers have devoted their attention to developing novel types of phosphors for application in WLEDs in recent years.10–13 Remarkably, the thermal quenching effect of the YAG: Ce3+ phosphor,14 which imposes deleterious influence on the luminous performance and lifetime, inevitably limits the performances of the current commercial WLEDs. Thus, red phosphors with outstanding thermal and chemical stability and luminous performance are urgently needed2,15 to cooperate with the YAG: Ce3+ yellow phosphor.
Red-emitting phosphors of Eu2+-doped nitride-based substrates have a broad red emission band and deep red color, such as Sr[LiAl3N4]: Eu2+,16 SrAlSi4N7: Eu2+,17 and Ca5Si2Al2N8: Eu2+.9 Noteworthily, Sr[LiAl3N4]: Eu2+ and Ca5Si2Al2N8: Eu2+ phosphors not only show deep red-light emission mainly centered at 650 nm, but also exhibit superior luminous thermal stability. In recent years, yellow and green emission nitride-based phosphors with zero thermal quenching property have been explored, for instance Li2CaSi2N4: Ce3+ 18 and SiAlON: Eu2+.19 Researches proved that Eu2+-doped nitride-based matrix phosphors with brilliant luminous thermal stability have good compatibility with different colors and great potential to be employed on a large scale. Unfortunately, despite their excellent luminous thermal stability and red-light emission performance, the rigorous conditions and high cost of their synthesis, which demand the maintenance of a high purity N2 atmosphere for a long period at high temperature, restrain the practical production and application of nitride-based red-light emission phosphors.
Accordingly, due to the low phonon energy, narrow linewidth of emission band and brilliant chemical stability of fluoride-based phosphors, they have attracted significant attention from researchers and studied in distinct fields, such as LaF3: RE3+ (RE3+ = Eu3+ and Tb3+) layer in solar cells,20 NaErF4-based phosphor for anticounterfeiting,21 NaYF4-based nanoparticle for biological application,22 and Cs2SiF6: Mn4+ in WLEDs.23 Possessing the abundant merits of fluorides, NaYF4 is an outstanding matrix and exhibits high compatibility with lanthanides, for instance Eu, Yb, Er, Tm, Ho and Nd.22,24 Furthermore, flexible routes can be employed for the synthesis of NaYF4-based phosphors, such as thermal decomposition, hydrothermal method, electrospinning process, and microwave synthesis.25–28 Among them, the hydrothermal method is the safest the most cost-effective for the synthesis of NaYF4-based phosphors due to its convenient operation process and moderate synthesis environment, exhibiting high safety.29
The trivalent europium ion is an ideal red-light source due to its red photoluminescence.30 This means that Eu3+ can be incorporated in the matrix as a fantastic activator of phosphors. Furthermore, to enhance the luminous intensity of Eu3+, sensitizers must be considered. Owing to the existence of energy transfer from the 4G5/2 of Sm3+ to 5D0 of Eu3+,31 the Sm3+ ion is an excellent sensitizer and can be co-doped in the matrix together with the Eu3+ ion.
In this study, utilizing NaYF4 as the substrate and Eu3+ and Sm3+ as the activator and sensitizer, respectively, the hydrothermal method was employed to synthesize a novel type of β-NaYF4: Eu3+, Sm3+ red-light emission phosphor, which exhibited a outstanding red-light emitting performance and brilliant luminous stability at high temperature. This novel phosphor may not only provide a red-light source with excellent property for white-light emission diodes but also for the patterned color conversion layer32 of mini-LED display technology.
2. Experiment
2.1 Experiment processes
In this work, a one-step hydrothermal method was utilized to synthesize a series of NaYF4: 0.065Eu3+, xSm3+ phosphors (x = 0, 0.001, 0.002, 0.003, 0.004, and 0.005). In this study, NaNO3, Y(NO3)3·6H2O, Eu(NO3)3·6H2O, and Sm(NO3)3·6H2O were used as the raw materials. The synthesis process was as follows: (i) four types of solutions: NaNO3 (2 mol L−1), Y(NO3)3 (1 mol L−1), Eu(NO3)3 (1 mol L−1), and Sm(NO3)3 (1 mol L−1) were blended according to the stoichiometric ratio of 1![[thin space (1/6-em)]](https://www.rsc.org/images/entities/char_2009.gif) :
:![[thin space (1/6-em)]](https://www.rsc.org/images/entities/char_2009.gif) 1−(0.065 + x)
1−(0.065 + x)![[thin space (1/6-em)]](https://www.rsc.org/images/entities/char_2009.gif) :
:![[thin space (1/6-em)]](https://www.rsc.org/images/entities/char_2009.gif) 0.065
0.065![[thin space (1/6-em)]](https://www.rsc.org/images/entities/char_2009.gif) :
:![[thin space (1/6-em)]](https://www.rsc.org/images/entities/char_2009.gif) x, named as solution A, and transferred to Teflon-lined containers. To achieve the homogeneous mixing of the solution, solution A was stirred for 20 min. (ii) Subsequently, 10 mL NH4F (6 mol L−1) solution was added to solution A and continually stirred for 30 min. (iii) The Teflon-lined stain-steel autoclaves containing the white precipitate were heated to 230 °C and kept for 72 h. (iii) The final products were washed several times using deionized water and anhydrous ethanol. (v) The products were washed and dried at the temperature of 120 °C for 3 h.
x, named as solution A, and transferred to Teflon-lined containers. To achieve the homogeneous mixing of the solution, solution A was stirred for 20 min. (ii) Subsequently, 10 mL NH4F (6 mol L−1) solution was added to solution A and continually stirred for 30 min. (iii) The Teflon-lined stain-steel autoclaves containing the white precipitate were heated to 230 °C and kept for 72 h. (iii) The final products were washed several times using deionized water and anhydrous ethanol. (v) The products were washed and dried at the temperature of 120 °C for 3 h.
2.2 Characterization
The phase of the all samples was determined using a Bruke-D8 X-ray diffractometer with Cu target. Morphology observation and detection of the energy dispersive spectra of the samples were performed using a high-resolution scanning electron microscope (Hitachi SU8020, Japan). XPS spectra were measured using an ESCALAB 25XI. A JEM-2100F was employed to obtain the high-resolution transmission electron microscopy (HRTEM) and selected area electron diffraction (SAED) images. A HORIBO FluoroMax4 spectrophotometer was employed to measure the fluorescence spectra and lifetime of the phosphors at room and high temperature. Finally, electron paramagnetic resonance (EPR) on a Bruker model was utilized to characterize the crystal defects.3. Result and discussion
3.1 Crystal structure and element characterization
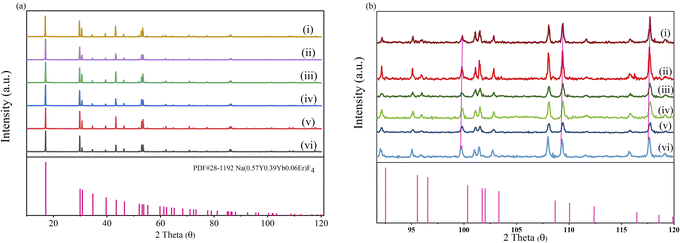
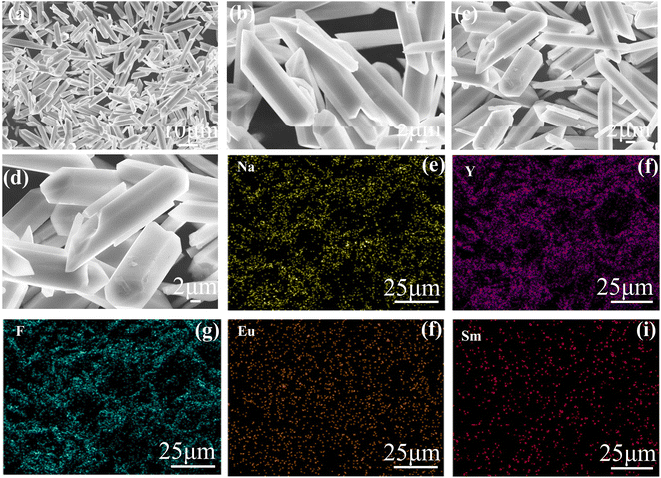
As illustrated in Fig. 1a, the positions of the diffraction peaks of all the samples are consistent with that of the standard card, PDF#-281179, Na(0.57Y0.39Yb0.04Er)F4, in the 2θ range of 10° to 90°. Compared with the standard PDF card, the diffraction peak positions slightly shifted to a lower degree in the range of 92° to 120°, as shown in Fig. 1b. This result is caused by the larger ion radius of Y3+, which is larger than that of Yb3+ and Er3+. This result led to an enlargement in the crystal face distance. Besides, compared with the XRD pattern of NaYF4: 0.065Eu3+, the 2θ value of NaYF4: 0.065Eu3+, xSm3+ also present a minor shift from high to low angle with an increase of the concentration of Sm3+, which was caused by the decrease of the crystal face distance induced by the increasing concentration of incorporated Sm3+ ion. Notably, impurity phases were absent in all the XRD patterns of the samples.The crystalline grain morphology, as shown in Fig. 2a–d, was observed by scanning electron microscopy at the magnification of 1.0 K, 3.0 K, 4.0 K, and 5.0 K, respectively. According to the depictions, the crystal grain of NaYF4: 0.065Eu3+, 0.002Sm3+ belongs to a dendritic crystal with a thin and long shape. The length and diameter of the dendritic crystal is approximately 10 μm and 4 μm, respectively. Meanwhile, energy dispersive spectroscopy (EDS) was implemented simultaneously to confirm the elements present in the samples. The EDS mapping result is shown in Fig. 2e–i. The element mapping patterns clearly demonstrate that the Na, Y, F, Eu, and Sm elements were uniformly distributed in the crystal grain.
Fig. 3a shows the full survey XPS spectra and refined element spectra of NaYF4: 0.065Eu3+, 0.002Sm3+. Fig. 3a further certifies that Eu3+ and Sm3+ ions were successfully incorporated in the NaFY4 matrix. Notably, Sm 4s shows an evident peak in the full survey XPS spectrum. Besides, KL1, KL2, and KL3 of Na and KL1 and KL2 of F are attributed to the Auger kinetic energy of the elements. Fig. 3b–d will be further analyzed in Section 3.3. Fig. 3e exhibits the XPS spectra of Eu. In the binding energy range of 1148.35 eV to 1162.20 eV, other satellites33 peaks were detected. Besides, the shake-down satellite33 was measured in the range of 1125.63 eV to 1137.55 eV. Double separation of 3d5/2 existed in the binding energy range of 1165.72 eV to 1168.69 eV. As shown in Fig. 3f, the XPS spectrum of Sm illustrates that a series of separation peaks located at 1096.99 eV can be attributed to Sm 3d3/2. At the binding energies of 1090.25 eV, 1086.50 eV and 1083.05 eV, the separation peaks are ascribed to the Sm 3d5/2 energy level.
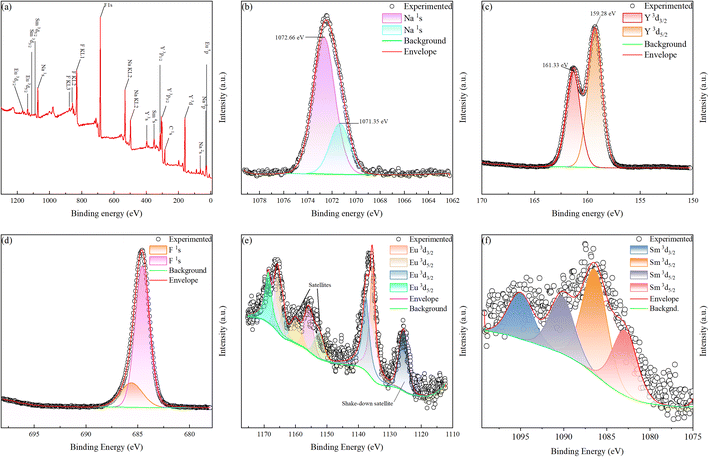 | ||
| Fig. 3 XPS spectra of NaYF4: 0.065Eu3+, 0.002Sm3+ composite (a) survey of sample. High-resolution spectra of (b) Na 1s, (c) Y 3d, (d) F 1s, (e)Eu 3d, and (f) Sm 3d. | ||
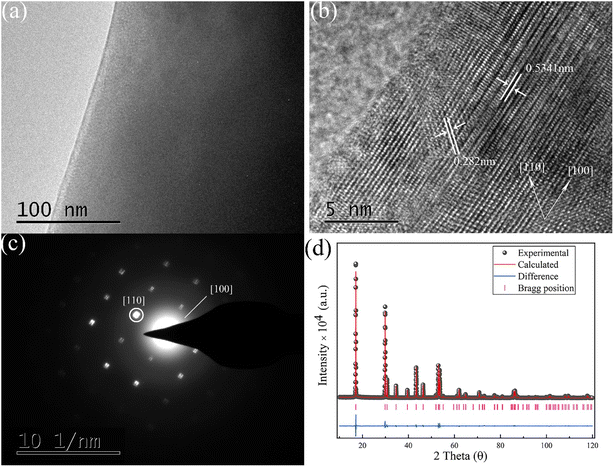
The morphology of the crystal grain was investigated by transmission electron microscopy, as presented in Fig. 4a. The high-resolution transmission electron microscopy image is presented in Fig. 4b, showing the crystal face distance of [100] and [110] corresponding to 0.5341 nm and 0.282 nm, respectively. The selected area electron diffraction image is illustrated in Fig. 4c. As presented, the central diffraction spot represents the [100] face. Besides, the other marked diffraction spot corresponds to the [110] face. According to Fig. 4c, a redundant spot referring to an impurity phase was not detected. This result is well consistent with the XRD patterns depicted in Fig. 1a and b. To accurately acquire the crystal cell volume and crystal structure information, refinement of X-ray diffraction was implemented through the GSAS program. The refinement result of the X-ray diffraction data is illustrated in Fig. 4d. The Rwp, Rp and χ2 of the refined data are 8.47%, 6.49% and 2.144, respectively, which indicate the high quality and reliable result of the fit. The Sm3+ ion was not considered in the refinement due to its low content, barely contributing to the X-ray diffraction. The crystal structure information is listed in Table 1, indicating that the space group of NaYF4: 0.065Eu3+, 0.002Sm3+ with the cell volume of 109.212 Å belongs to P63/m (176).
| Formula sum | β-NaYF4: 0.065Eu3+ | |||
|---|---|---|---|---|
| Formula weight | 197.7661 | |||
| Crystal system | Hexagonal | |||
| Space group | P63/m | |||
| Cell parameters | a = 5.984911 (28)Å | b = 5.984911 Å | c = 3.5206(5) Å | |
| Cell volume | 109.212(20) | |||
| Z | 6 | |||
| Atom | x/a | y/b1 | z/c | Occupation |
| Na1 | 0.0 | 0.0 | 0.11747 (22) | 0.71 |
| Na2 | 0.6667 | 0.3333 | 0.25 | 0.18 |
| Y1 | 0.6667 | 0.3333 | 0.25 | 0.755 |
| Y2 | 0.0 | 0.0 | 0.11747 (22) | 0.29 |
| Eu1 | 0.6667 | 0.3333 | 0.25 | 0.065 |
| F1 | 0.2933(5) | 0.3165 (4) | 0.25 | 1.0 |
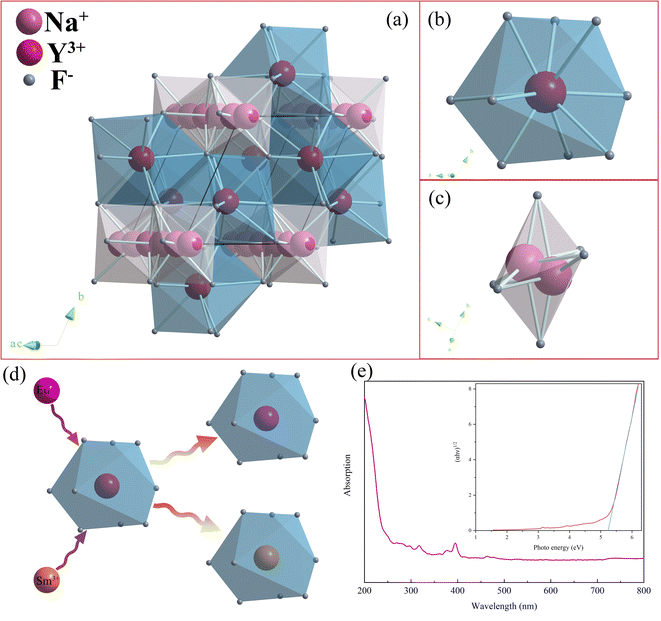
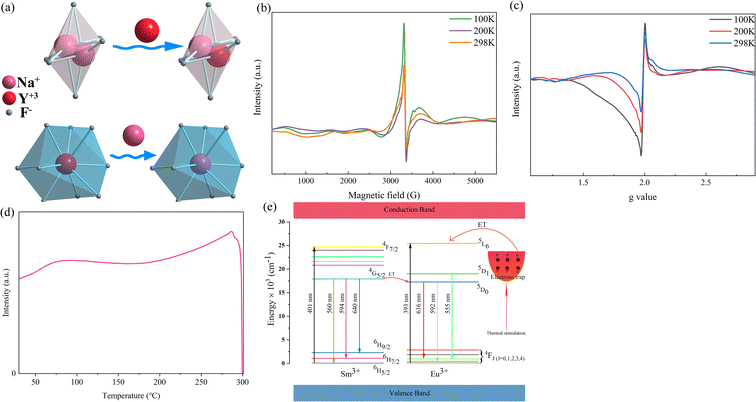
Base on the refined result, the crystal structure graph, as presented in Fig. 5, was drawn using the diamond 3 program. According to Fig. 5a, the structure can be observed from the parallel perspective to the connection of the vertex of the a and c axes, where Y–F decahedron and Na–F octahedron constitute an integrated crystal cell. Fig. 5b and c display the Y–F decahedron observed along the a-axis direction and Na–F octahedron along the c-axis, respectively. Notably, the Na–F octahedron, named as [Na2F6], is composed of two central Na atoms and six ligand F atoms. In the cell edge parallel to the connection of the vertex of a and c axis direction, three [Na2F6] octahedrons are connected with each other through F atoms. There is one Y atom and nine F atoms, as the central atom and ligand atoms, respectively, constituting the Y–F decahedron, named as the [YF9] decahedron. Based on the XPS and EDS results, Eu3+ and Sm3+ ions were incorporated in the [YF9] decahedron. The incorporation mechanism is presented in Fig. 5d.
The energy gap of NaYF4: 0.065Eu3+, 0.002Sm3+ was calculated according to the ultraviolet visible absorption spectra and shown in Fig. 5e using following equation:34
| (αhν)n = A(hν − Eg) | (1) |
3.2 Luminescence property of β-NaYF4: 0.065Eu3+, xSm3+ (x = 0, 0.001, 0.002, 0.003, 0.004, and 0.005)
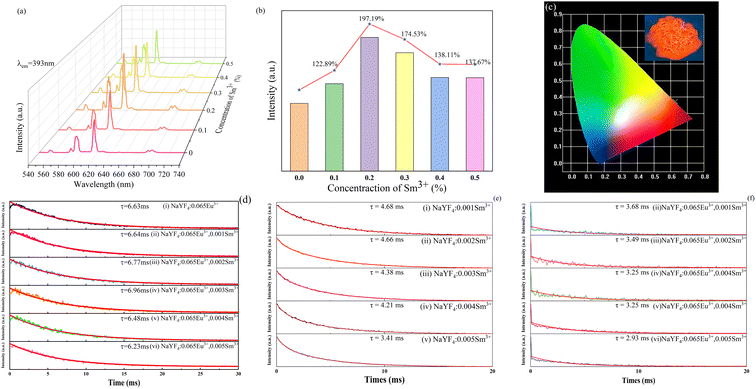
The emission spectra of the series NaYF4: 0.065Eu3+, xSm3+ phosphors were measured at room temperature (RT). Under the emission of 393 nm, Fig. 6a illustrates the emission spectra of all the samples doped with different concentrations of Sm3+ in the range of 0 to 0.005 mol. The main emission peaks are located at 616 nm for all the samples. Based on the Judd–Ofelt theory,35,36 the transition intensity ratio of 5D0 → 7F2 to 5D0 → 7F1 (R = I2/I1) of Eu3+ is a critical criterion to determine the emission mode dominated by the magnetic dipole (MD) transition (5D0 → 7F1) or the electric dipole (ED) transition (5D0 → 7F2). If R > 1, it means that the emission is dominated by the ED transition and corresponds to a red light. On the contrary, when R < 1, it is results from an emission dominated by the MD transition and corresponds to a reddish-orange light. Upon excitation at 393 nm, the value of R was calculated to be 1.68, which suggests that the emission of NaYF4: 0.065Eu3+, 0.002Sm3+ is determined by the ED transition. The orange-red light of the samples originate from the increasing emission intensity of 5D0 → 7F2, which is induced by the Eu3+ ion in the inversion symmetry center.37 It can be seen from Fig. 6b that the luminous intensities of the samples co-doped with Sm3+ ion are much higher than that of the sample without co-doped Sm3+ ion. The luminous intensity of NaYF4: 0,065Eu3+, 0.002Sm3+ is 128.89%, 197.19%, 174.53%, 138.11%, and 139.69% that of NaYF4: 0.065Eu3+, which suggests the existence of an enhancement effect induced by Sm3+. However, when the concentration of Sm3+ was greater than 0.002, the luminescence intensity gradually decreased, which refers to concentration quenching (CQ) phenomenon. To elucidate the mechanism of CQ, the following equation38 was applied:
 | (2) |
As demonstrated in Fig. 6d, the decay lifetime of Sm3+ with a concentration in the range of 0 to 0.005 was measured at room temperature (RT). The decay lifetime was calculated using eqn (3).39
 | (3) |
 | (4) |
The calculated and fitted results show that the decay lifetime was prolonged from 6.63 ms to 6.96 ms when the concentration of Sm3+ was increased from 0 to 0.003, which suggests the occurrence of energy transfer from the Sm3+ to Eu3+ ion.40,41 A reduction in the decay lifetime from 6.48 ms to 6.23 ms was detected when the concentration of Sm3+ is higher than 0.004. To further confirm that the energy transfer occurred from the Sm3+ to Eu3+ ion, the decay of Sm3+ without and with Eu3+ was measured, as shown in Fig. 6e and f, respectively. The decay lifetime of the Sm3+ of NaYF4: xSm3+ samples decreased by 1.0 ms, 1.17 ms, 1.13 ms, 0.96 ms, and 0.48 ms compared with that of Sm3+ of the NaYF4: 0.065Eu3+, xSm3+ samples, also indicating existence of energy transfer from Sm3+ to Eu3+. Although a relatively longer decay time was observed for NaYF4: 0.065Eu3+, 0.003Sm3+ than NaYF4: 0.065Eu3+, 0.002Sm3+, the changes in the luminous intensity and decay lifetime indicate that concentration quenching is the predominant factor when the concentration of Sm3+ is over 0.003. The energy transfer efficiency was calculated according to the following equation:38
 | (5) |
To elucidate the enhancement mechanism of Sm3+ to Eu3+, the following relationship equation is employed to make a clear expression:42
| I/x = k [1 + β(x)θ/3]−1 | (6) |
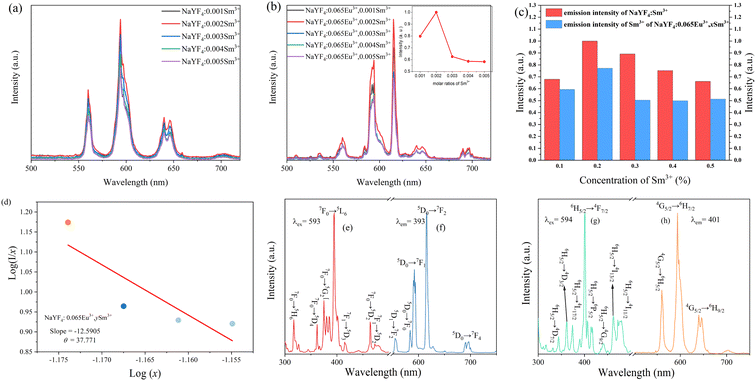
In this equation, I represents the fluorescence intensity of Eu3+. x is equal to the total concentration of Eu3+ and Sm3+ ions, where the concentration of Sm3+ is in the range of 0.002 to 0.005. The value of β can be 6,8, and 10, which represent the dipole–dipole, the dipole–quadrupole and the quadrupole–quadrupole interactions, respectively. k and β are constants for the same excitation condition. To obtain the luminous intensity, the emission spectra of Sm3+ of the NaYF4: xSm3+ (spectra I) and NaYF4: 0.065Eu3+, xSm3+ (spectra II) samples were measured under excitation at 401 nm, as shown in Fig. 7a and b, respectively. The intensities of the major emission peak for spectra I and II are presented in Fig. 7c for convenient observation and further discussion of the energy transfer mechanism. Notably, the emission peaks present at 616 nm and 675 nm to 700 nm can be ascribed to the emission of the Eu3+ ion, as illustrated in Fig. 7b. As shown in Fig. 7d, according to the linear fitness, the slope of the line is −12.5909. The value of θ was calculated to be 37.771, which is larger than 10. This result indicates that the energy transfer mechanism from Sm3+ to Eu3+ is the quadrupole–quadrupole interaction. To clearly describe the transition of electrons and energy transfer process, the emission and excitation spectra of Eu3+ in NaYF4: 0.065Eu3+, 0.002Sm3+ and NaYF4: 0.002Sm3+ were measured, as shown in Fig. 7e–h.
To elucidate the energy transfer from Sm3+ to Eu3+, the excitation spectrum of NaYF4: 0.065Eu3+ and emission spectrum of NaYF4: 0.002Sm3+ are shown in Fig. 8a and b, respectively. Combining Fig. 7e–h with Fig. 8a and b, a schematic diagram of the energy transfer from Sm3+ to Eu3+ is shown in Fig. 8c. Under the emission of 393 nm, there are five major emission peaks, emerging at the positions of 616 nm, 592 nm, and 555 nm, which can be attributed to the transitions of 5D0 → 7F2, 5D0 → 7F1, and 5D1 → 7F2 of Eu3+, respectively. Comparing 393 nm with 401 nm, due to the higher energy of 393 nm, it allows Sm3+ to be excited from the ground state to the excited state. Under excitation of 393 nm, there are three main peaks in the emission spectrum, appearing at the positions of 560 nm, 594 nm, and 640 nm, which are attributed to the transitions of the 4G5/2 → 6H5/2, 4G5/2 → 6H7/2, and 4G5/2 → 6H9/2 energy level of Sm3+, respectively. Notably, energy transfer occurs from 4G5/2 to 5D0, which results from the luminous enhancement of Eu3+, while the transition of 4G5/2 → 6HK/2 (K = 5, 7, 9) occurs.
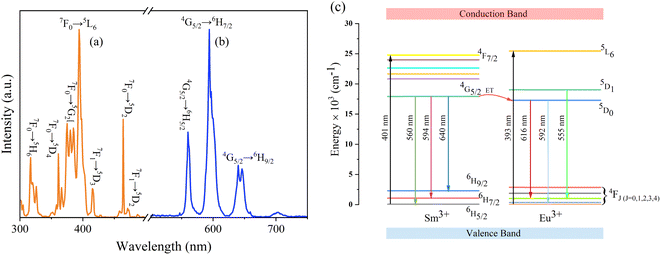 | ||
| Fig. 8 (a) Excitation spectra of NaYF4: 0.065Eu3+. (b) Emission spectra of NaYF4: 0.002Sm3+. (c) Energy level and electric transition schematic diagram of Sm3+ and Eu3+. | ||
3.3 Thermal luminescence property
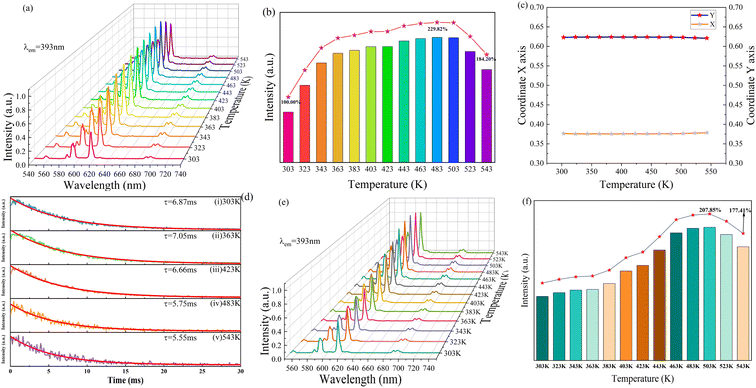
The thermal luminous property of NaYF4: 0.065Eu3+, 0.002Sm3+ was characterized by emission spectra measured in the temperature range of 303 K to 543 K, under emission of 393 nm, as portrayed at Fig. 9a. Notably, no new emission peak emerged in all the emission spectra. The emission spectra measured at high temperature are consistent with the emission spectra at room temperature. The integrated luminous intensity of NaYF4: 0.065Eu3+, 0.002Sm3+ at different temperatures is depicted in Fig. 9b. It can be seen that the intensity gradually enhanced with an increase in temperature in the range of 303 K to 483 K, showing that the luminous intensity at 483 K is 229.82% of that at 303 K. After 483 K, the luminescence intensity started to decline steadily from 483 K to 543 K. Although a lower luminous intensity was detected at 543 K than that at 483 K, the luminous intensity of the sample at 543 K was still 184.20% of that at 303 K. This result evidently displays that NaYF4: 0.065Eu3+, 0.002Sm3+ possesses brilliant thermal luminescence stability with an increase in temperature, which is known as negative thermal quenching (NTQ), causing it to exhibit brilliant thermal luminous stability. Fig. 9c demonstrates the CIE color coordinates of NaYF4: 0.065Eu3+, 0.002Sm3+. Fig. 9c shows a negligible shift in the red light region with an increase in temperature, suggesting that the sample has superior red emitting stability at high temperature. Fig. 9d illustrates the decay curves of NaYF4: 0.065Eu3+, 0.002Sm3+ in the temperature range of 303 K to 543 K. Remarkably, the fitted results manifest that the decay lifetime increased from 6.87 ms at 303 K to 7.05 ms at 363 K. Due to the energy transfer effect, the electrons captured in the traps would be excited to the excited state with the help of the increasing thermal energy with the increase in temperature, prolonging the decay of the phosphor.38 Other reports43,44 also showed that this crystal exhibited abnormal thermal quenching. The effect of energy transfer from the traps to electrons is superior to the non-radiative transition in this stage. Meanwhile, the decay showed a continuous decline from 6.66 ms at 423 K to 5.55 ms at 543 K, which is attributed to the boosted probability of non-radiative transition induced by the increase in thermal energy.45,46 Alternatively, the non-radiative transition probability gradually increased from 423 K and became the predominant effect rather the energy transfer effect after heating to 543 K. This process corresponds to the reduction of the number of electrons in the traps in temperature range from 423 K to 543 K compared with a temperature lower than 423 K. The emissions spectra of NaYF40.065Eu3+ and the major peak value in the temperature range of 303 K to 543 K are illustrated in Fig. 9e and f, respectively. The NaYF40.065Eu3+ sample showed an outstanding thermal luminous performance. This result shows that the incorporation of Sm3+ had no influence on the thermal property of NaYF4: 0.065Eu3+, 0.002Sm3+, it only acted as a sensitizer to enhance the luminous property of Eu3+.3.4 Mechanism of negative thermal quenching
To elucidate the mechanism of NTQ, the crystal defect formed from the inequivalence replacement of the ions should be considered. According to the information in Table 1, the Y3+ ion was incorporated in the position of Na1 (x = 0.0, y = 0.0, z = 0.11747), which is defined as the Y2 site. Similarly, the Y3+ ion in the site x, y, and z of 0.6667, 0.3333, 0.25, respectively, is defined as Y1. The Na+ ion that occupies this position is named Na2. This result suggests the replacement of Na+ (CN = 6, R = 1.02 Å) with the Y3+ (CN = 9, R = 1.075 Å) ion. The process of inequivalence replacement can be inferred and expressed using the following expression:
 | (7) |
 | (8) |
Eqn (7) indicates that the incorporation of Y3+ in the Na1 site produces two anionic vacancies  and cation defect
  to balance the electroneutrality. Analogously, in eqn (7), when an Na+ ion is incorporated in the Y1 site, there are two vacancies with positive charge
  and two defects with negative charge
  to maintain the balance of electroneutrality induced by nonequivalent replacement. These crystal defects act as electronic traps to store and release electrons.38,47,48 As confirmed by the XPS refined spectra of Y3+ and Na+, the chemical bonds changed during the nonequivalent replacement. The high-resolution spectra of Na+, as illustrated in Fig. 3b, indicate two types of binding energies of 1071.35 eV and 1072.66 eV, which are close to the Na–F binding energies of 1071.30 eV49 and 1072.70 eV.50 This result indicates the existence of two types of Na–F bonds, resulting from the nonequivalent replacement. Some of the [Na2F6] octahedrons would shift to [NaYF6] octahedrons. Similarly, according to the high-resolution spectra of Y3+ presented in Fig. 3c, there are two types of peaks located at the binding energies of 159.28 eV and 161.33 eV, which are close to 159.10 eV51 and 161.20 eV.52 This binging energy also demonstrates the existence of two different bonds of Y–F induced by the replacement between Y3+ and Na+. Some of the [YF9] decahedrons would transfer to [NaF9] decahedrons. As shown in Fig. 3d, the XPS spectra of F indicate two types of binding energies, which demonstrate the existence of Na–F and Y–F bonds.
As is well known, electron paramagnetic resonance (EPR) is a suitable method to characterize solid defects. In this study, EPR was employed to provide powerful proof of the existence of defects. The EPR results are depicted in Fig. 10b, which show an asymmetric EPR signal. The EPR signal was detected in the magnetic field range of 2790 G to 4136 G and presented an evident attenuation with an increase in the measurement temperature. This signal indicates the existence of crystal defects. Based on the EPR result, the g value, a critical parameter for crystal defects, was calculated using the following equation:53
 | (9) |
| E = Tm/500 |
| N0 = ω × Im/β × [2.52 + 10.2(μg−0.42)] | (10) |
The replacement between Na+ and a lanthanide ion was reported,47 where Eu2+ occupies the chemical position of Na+. Thus, combining the single-type signal of EPR, eqn (7) and (8) can be modified to the following expression:
 | (11) |
Noticeably, the Eu element possesses two g values, which are equal to 0.6134 and 1.3887.57 Similarly, the typical g values of the Sm element are −0.232 and 0.1908.57 As shown in Fig. 10c, evident peaks were absent at the g value positions of 0.1908, 0.6134, and 1.3887, indicating that there were no unpaired electrons of Eu3+ and Sm3+ existing in the sample. Combining this result with Fig. 10b and c, the detected signal and calculated g value were confirmed to be crystal defects. This verified that the  and
and  vacancies lead to NTQ for the NaYF4: 0.065Eu3+, 0.002Sm3+ phosphor.
The NTQ mechanism diagram is presented in Fig. 10d. With an increase of temperature, the thermal active energy would be boosted simultaneously. Under the activity of mounting thermal active energy, the electrons stored inside the electronic traps would be released and excited to the 5L6 energy level. Besides the interior electrons of Eu3+, the electrons from the traps will be excited to the excited state and transit to the ground state as a counterpart to offset the decrease of luminous intensity induced by the non-radiative transition. In the temperature range of 303 K to 483 K, the luminous intensity increased, corresponding to the augmented number of excited electrons with an increase in the thermal energy. The NTQ performance can be concluded as the process of energy transfer from the thermal energy to electrons in traps. After heating to 483 K, the integrated luminous intensity showed a decline from 483 K to 543 K, which is attributed to the decrease in the number of released and excited electrons, as well as the normal thermal quenching. Besides, due to the decrease in the number of electrons inside the traps, the non-radiative transition effect will overpower the NTQ effect produced by the excited electrons stored in the traps, leading to a decrease in luminous intensity.
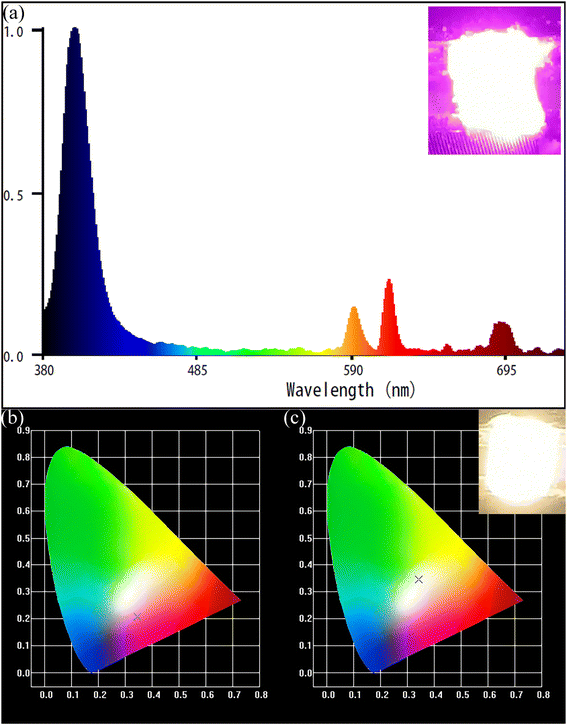
3.5 Fabrication of prototype red LEDs
The luminescent property of prototype red LED and luminous graph are illustrated in Fig. 11a. The prototype LED (LED (i)) was fabricated by coating the NaYF4: 0.065Eu3+, 0.002Sm3+ sample on the surface of a 395 nm UV chip. The red-light portion could reach 34.2% under the driving current of 10 mA. Fig. 11b depicts the CIE chromaticity diagram of LED(i), indicating it is close to the white light region. This result proves that the novel β-NaYF4: 0.065Eu3+, 0.002Sm3+ has enormous potential as the red-light component of WLEDs. The prototype white light LED (LED (ii)) was fabricated by coating a mixture of NaYF4: 0.065Eu3+, 0.002Sm3+ and YAG: Ce3+ on the surface of a 395 nm UV chip. Fig. 11c shows the CIE chromaticity diagram of LED (ii), indicating that it emits white light. The quantum efficiency and absorption efficiency of the sample reached 74.43% and 86.99%, respectively. The color temperature and color rendering index of LED (ii) were 5074 K and 81.6, respectively. Besides, the CIE coordinates of the prototype red LED is (x, y) = (0.3461, 0.3387).4. Conclusion
A series of NaYF4: 0.065Eu3+, xSm3+ (x = 0–0.005) with dendritic crystal of high crystallinity was successfully synthesized via a one-step hydrothermal method. The effect of the luminous enhancement induced by energy transfer from Sm3+ to Eu3+ was observed. The energy transfer mechanism was explained to be the quadrupole–quadrupole interactions. When the concentration of Sm3+ was 0.001–0.005 mol%, the luminous intensities of NaYF4: 0.065Eu3+, xSm3+ (x = 0, 0.001, 0.002, 0.003, 0.004, and 0.005 mol) were enhanced to 128.89%, 197.19%, 174.53%, 138.11%, and 139.69%, respectively, compared with the sample without co-doped Sm3+ ion. The energy transfer mechanism was explained by quadrupole–quadrupole interactions. Noteworthily, remarkable luminous thermal stability was found in the emission spectrum of NaYF4: 0.065Eu3+, 0.002Sm3+. With an increase in temperature from 303 K to 483 K, the luminous intensity increased to 229.82% of that at 303 K. This is known as negative thermal quenching, and this outstanding thermal performance is attributed to the crystal point defects originating from the non-equivalence between Na+ and Y3+ ions, which will lead to thermal stimulation excitement of the electrons captured in electronic traps.Conflicts of interest
The authors declare that they have no known competing financial interests or personal relationships that could have appeared to influence the work reported in this paper.Acknowledgements
This research is supported by the National Natural Science Foundation of China (Grant No. 21661006 and No. 21965004), the Natural Science Foundation of Guangxi Zhuang Autonomous Region, China (Grant No. 2019GXNSFDA245022, No. 2020GXNSFAA159036), the Scientific Research Foundation of Guangxi University (Grant No. XDZ140116), the innovation Project of Guangxi Graduate Education (Grant No. YCSW2020015), the Students Experimental Skills and Innovation Ability Training Fund Project of Guangxi University (No. 202010593186).References
- P. M. Pattison, J. Y. Tsao, G. C. Brainard and B. Bugbee, Nature, 2018, 563, 493–500 CrossRef CAS PubMed.
- P. Pust, P. J. Schmidt and W. Schnick, Nat. Mater., 2015, 14, 454–458 CrossRef CAS PubMed.
- S. D. Carvalho and K. M. Folta, Crit. Rev. Plant Sci., 2014, 33, 486–508 CrossRef CAS.
- S. A. Rahman, M. A. St Hilaire and S. W. Lockley, Physiol. Behav., 2017, 177, 221–229 CrossRef CAS PubMed.
- T. Wu, C.-W. Sher, Y. Lin, C.-F. Lee, S. Liang, Y. Lu, S.-W. Huang Chen, W. Guo, H.-C. Kuo and Z. Chen, Appl. Sci., 2018, 8, 1557 CrossRef.
- L. Xu, C. C. Ming, Y. Li, K. Fan, M. Zhang, H. Sun and Z. Guo, IEEE Access, 2021, 9, 74713–74718 Search PubMed.
- D. Chen, Y. Zhou, W. Xu, J. Zhong, Z. Ji and W. Xiang, J. Mater. Chem. C, 2016, 4, 1704–1712 RSC.
- X. Huang, H. Guo and B. Li, J. Alloys Compd., 2017, 720, 29–38 CrossRef CAS.
- J. Ding, Q. Wu, Y. Li, Q. Long, Y. Wang and Y. Wang, Chem. Eng. J., 2016, 302, 466–474 CrossRef CAS.
- Z. Li, X. Zhang, J. Wu, R. Guo, L. Luo, Y. Xiong, L. Wang and W. Chen, J. Mater. Chem. C, 2021, 9, 13236–13246 RSC.
- M. L. Meretska, G. Vissenberg, A. Lagendijk, W. L. Ijzerman and W. L. Vos, ACS Photonics, 2019, 6, 3070–3075 CrossRef CAS.
- D. Zhang, X. Zhang, Z. An, R. Dong, Z. Shi, Y. Song and H. Zou, Inorg. Chem., 2020, 59, 14193–14206 CrossRef CAS PubMed.
- M. Zhao, H. Liao, M. S. Molokeev, Y. Zhou, Q. Zhang, Q. Liu and Z. Xia, Light: Sci. Appl., 2019, 8, 38 CrossRef PubMed.
- J. Ueda, P. Dorenbos, A. J. J. Bos, A. Meijerink and S. Tanabe, J. Phys. Chem. C, 2015, 119, 25003–25008 CrossRef CAS.
- H. Daicho, T. Iwasaki, K. Enomoto, Y. Sasaki, Y. Maeno, Y. Shinomiya, S. Aoyagi, E. Nishibori, M. Sakata, H. Sawa, S. Matsuishi and H. Hosono, Nat. Commun., 2012, 3, 1132 CrossRef PubMed.
- P. Pust, V. Weiler, C. Hecht, A. Tucks, A. S. Wochnik, A. K. Henss, D. Wiechert, C. Scheu, P. J. Schmidt and W. Schnick, Nat. Mater., 2014, 13, 891–896 CrossRef CAS PubMed.
- J. A. Kechele, C. Hecht, O. Oeckler, J. Schmedt auf der Günne, P. J. Schmidt and W. Schnick, Chem. Mater., 2009, 21, 1288–1295 CrossRef CAS.
- Q. Wei, J. Ding and Y. Wang, Chem. Eng. J., 2020, 386, 124004 CrossRef CAS.
- S. Yamada, H. Emoto, M. Ibukiyama and N. Hirosaki, J. Eur. Ceram. Soc., 2012, 32, 1355–1358 CrossRef CAS.
- S. Li, X. Zhang, Z. Hou, Z. Cheng, P. Ma and J. Lin, Nanoscale, 2012, 4, 5619–5626 RSC.
- R. Joshi, R. S. Perala, S. B. Shelar, A. Ballal, B. P. Singh and R. S. Ningthoujam, ACS Appl. Mater. Interfaces, 2021, 13, 3481–3490 CrossRef CAS PubMed.
- M. F. Torresan and A. Wolosiuk, ACS Appl. Bio Mater., 2021, 4, 1191–1210 CrossRef CAS PubMed.
- E. Song, Y. Zhou, X.-B. Yang, Z. Liao, W. Zhao, T. Deng, L. Wang, Y. Ma, S. Ye and Q. Zhang, ACS Photonics, 2017, 4, 2556–2565 CrossRef CAS.
- M. Calil Júnior, Á. Melo, E. Rodrigues, F. Sigoli and M. Rodrigues, J. Braz. Chem. Soc., 2017, 28, 1816–1821 Search PubMed.
- H. X. Mai, Y. W. Zhang, R. Si, Z. G. Yan, L. D. Sun, L. P. You and C. H. Yan, J. Am. Chem. Soc., 2006, 128, 6426–6436 CrossRef CAS PubMed.
- H. T. Phuong, T. T. Huong, L. T. Vinh, H. T. Khuyen, D. T. Thao, N. T. Huong, P. T. Lien and L. Q. Minh, J. Rare Earths, 2019, 37, 1183–1187 CrossRef CAS.
- B. Dong, H. W. Song, H. Q. Yu, H. Zhang, R. F. Qin, X. Bai, G. H. Pan, S. Z. Lu, F. Wang, L. B. Fan and Q. L. Dai, J. Phys. Chem. C, 2008, 112, 1435–1440 CrossRef CAS.
- J. Zhang and H. Riesen, Chem. Phys. Lett., 2015, 641, 1–4 CrossRef CAS.
- Y. Luo, R. Yang, X. Zhang, B. Hu, S. Hu, L. Zhou and J. Yang, CrystEngComm, 2015, 17, 7762–7771 RSC.
- K. Binnemans, Coord. Chem. Rev., 2015, 295, 1–45 CrossRef CAS.
- H.-Y. Lin, Y.-C. Fang and S.-Y. Chu, J. Am. Ceram. Soc., 2010, 93, 3850–3856 CrossRef CAS.
- Y. Huang, E. L. Hsiang, M. Y. Deng and S. T. Wu, Light Sci. Appl., 2020, 9, 105 CrossRef CAS PubMed.
- F. Mercier, C. Alliot, L. Bion, N. Thromat and P. Toulhoat, J. Electron Spectrosc. Relat. Phenom., 2006, 150, 21–26 CrossRef CAS.
- M. G. Brik, A. M. Srivastava and A. I. Popov, Opt. Mater., 2022, 127, 112276 CrossRef CAS.
- B. R. Judd, Phys. Rev., 1962, 127, 750–761 CrossRef CAS.
- G. S. Ofelt, J. Phys. Chem., 1962, 37, 511–520 CrossRef CAS.
- J. Zhang, G. Cai, W. Wang, L. Ma, X. Wang and Z. Jin, Inorg. Chem., 2020, 59, 2241–2247 CrossRef CAS PubMed.
- S. Fang, T. Lang, T. Han, J. Wang, J. Yang, S. Cao, L. Peng, B. Liu, A. N. Yakovlev and V. I. Korepanov, Chem. Eng. J., 2020, 389, 124297 CrossRef CAS.
- K. Li, J. Fan, M. Shang, H. Lian and J. Lin, J. Mater. Chem. C, 2015, 3, 9989–9998 RSC.
- C. Cao, H. K. Yang, J. W. Chung, B. K. Moon, B. C. Choi, J. H. Jeong and K. H. Kim, J. Mater. Chem., 2011, 21, 10342–10347 RSC.
- B. Su, H. Xie, Y. Tan, Y. Zhao, Q. Yang and S. Zhang, J. Lumin., 2018, 204, 457–463 CrossRef CAS.
- Y. Liu, Y. Li, J. Meng, W. Liang, W. Huang, S. Liao, Y. Huang and H. Zhang, J. Lumin., 2020, 217, 116770 CrossRef CAS.
- Y. Liu, G. Zhang, J. Huang, X. Tao, G. Li and G. Cai, Inorg. Chem., 2021, 60, 2279–2293 CrossRef CAS PubMed.
- Y. Liu, R. Wang, Q. Yang, G. Li, J. Huang and G. Cai, J. Am. Ceram. Soc., 2022, 105, 6184–6195 CrossRef CAS.
- H. Ming, Y. Zhao, Y. Zhou, S. Zhang, Y. Wang, E. Song, Z. Xia and Q. Zhang, ACS Appl. Electron. Mater., 2020, 2, 4134–4145 CrossRef CAS.
- R. Shi, L. Ning, Z. Wang, J. Chen, T. K. Sham, Y. Huang, Z. Qi, C. Li, Q. Tang and H. Liang, Adv. Opt. Mater., 2019, 7, 1901187 CrossRef CAS.
- X. Wang, Z. Zhao, Q. Wu, C. Wang, Q. Wang, L. Yanyan and Y. Wang, J. Mater. Chem. C, 2016, 4, 8795–8801 RSC.
- G. Zhu, Z. Li, C. Wang, X. Wang, F. Zhou, M. Gao, S. Xin and Y. Wang, Dalton Trans., 2019, 48, 1624–1632 RSC.
- V. I. Nefedov, Y. V. Salyn, G. Leonhardt and R. Scheibe, J. Electron Spectrosc. Relat. Phenom., 1977, 10, 121–124 CrossRef CAS.
- H. Seyama, J. Chem. Soc., Faraday Trans. 1, 1985, 81, 485–495 RSC.
- R. P. Vasquez, M. C. Foote and B. D. Hunt, J. Appl. Phys., 1989, 66, 4866–4877 CrossRef CAS.
- U. Yoshinori, T. Akira, I. Toshio and Y. Hideo, Bull. Chem. Soc. Jpn., 1986, 59, 2263–2267 CrossRef.
- K. Ye, K. Li, Y. Lu, Z. Guo, N. Ni, H. Liu, Y. Huang, H. Ji and P. Wang, TrAC, Trends Anal. Chem., 2019, 116, 102–108 CrossRef CAS.
- F. Tang, Z. Su, H. Ye, W. Gao, X. Pan and S. Xu, ACS Omega, 2018, 3, 13704–13710 CrossRef CAS PubMed.
- L. Yang, S. Peng, M. Zhao and L. Yu, Appl. Surf. Sci., 2019, 473, 885–892 CrossRef CAS.
- K. Van den Eeckhout, P. F. Smet and D. Poelman, Materials, 2010, 3, 2536–2566 CrossRef CAS.
- J. R. B and J. A. Weil, Electron Paramagnetic Resonance: Elementary Theory Electron and Practical applications, 2nd, John Wiley & Sons, Hoboken, 2007 Search PubMed.
| This journal is © The Royal Society of Chemistry 2023 |

