 Open Access Article
Crystal structures, phase transitions, and nuclear magnetic resonance of organic–inorganic hybrid [NH2(CH3)2]2ZnBr4 crystals†
Ae Ran Lim *ab
*ab
aGraduate School of Carbon Convergence Engineering, Jeonju University, Jeonju 55069, Korea
bDepartment of Science Education, Jeonju University, Jeonju 55069, Korea. E-mail: aeranlim@hanmail.net; arlim@jj.ac.kr
First published on 4th January 2023
Abstract
Organic–inorganic hybrid [NH2(CH3)2]2ZnBr4 crystals were grown via slow evaporation, and their monoclinic structure was determined using single-crystal X-ray diffraction (XRD). The two phase transition temperatures at 401 K (TC1) and 436 K (TC2) were defined using differential scanning calorimetry and powder XRD. In the nuclear magnetic resonance spectra, a small change was observed in the 1H chemical shifts for NH2, 13C chemical shifts for CH3, and 14N resonance frequency for NH2 near TC1. 1H spin-lattice relaxation times T1ρ and 13C T1ρ for NH2 and CH3, respectively, rapidly decreased near TC1, suggesting that energy was easily transferred. NH2 in the [NH2(CH3)2]+ cation was significantly influenced by the surrounding environments of 1H and 14N, indicating a change in the N–H⋯Br hydrogen bond with the coordination geometry of the ZnBr4 anion. These fundamental properties open efficient avenues for the development of organic–inorganic hybrids, thus qualifying them for practical applications.
1. Introduction
Interest in organic–inorganic hybrid compounds has been primarily associated with their various applications, such as in sensors, fuel and solar cells, light-emitting diodes, and light-emitting transistors.1–4 Furthermore, the important applications for materials with organic–inorganic hybrid perovskite are also as ferroelectrics, dielectric switches, and optical switches.5–12 CH3NH3PbX3 (X = Cl−, Br−, I−) thin-film photovoltaic devices have been used as solar cells,13–18 but these materials readily decompose in humid air and are toxic because of the presence of Pb. Thus, it is necessary to develop lead-free hybrid perovskite solar cells. Two-dimensional compounds of [NH3(CH2)nNH3]MX4 (n = 1, 2, 3, …; M = Mn2+, Co2+, Cu2+, Zn2+, Cd2+, Pb2+, X = Cl−, Br−, I−) and [(CnH2n+1NH3)]2MX4 are examples of organic–inorganic hybrids that have recently attracted considerable attention.19–26 In addition, the dimethylammonium tetrabromozincate(II), [NH2(CH3)2]2ZnBr4, crystal is a member of the [NH2(CH3)2]2MX4 family, which belongs to a group of A2MX4 types, where A+ is a univalent cation, M2+ is a divalent transition metal, and X is a halogen.27–36 These crystals undergo several structural phase transitions, often associated with the ordering of hydrogen bonds and related changes in the molecular dynamics of the [NH2(CH3)2]+ ions. The individual MX4 tetrahedral anions in these materials are completely isolated and surrounded by organic [NH2(CH3)2]+ cations. These substances are expected to act as potential proton conductors via hydrogen bonds. The structure of [NH2(CH3)2]2ZnBr4, at 291 K is monoclinic with space group P21/c, and its lattice parameters are a = 8.706 Å, b = 11.956 Å, c = 16.289 Å, β = 121.84°, and Z = 4.37 At 150 K, the structure is monoclinic, similar to that at 300 K; however, the space group and lattice constants are P21/n and a = 8.5512 Å, b = 11.825 Å, c = 13.499 Å, β = 90.358°, and Z = 4.38 In the molecular unit, the ZnBr4 anions are connected to the organic [NH2(CH3)2]+ cations through N–H⋯Br hydrogen bonds.With reference to previous reports on [NH2(CH3)2]2ZnBr4, Ishihara et al.37 investigated 81Br nuclear quadrupole resonance (NQR) frequencies with varying temperature. Four NQR resonance signals to the four Br atoms in the ZnBr4 tetrahedron were obtained; their NQR peaks disappeared at temperatures above 355 K, and no evidence of a phase transition was observed between 77 and 350 K. In addition, the phase transition temperatures measured using differential scanning calorimetry (DSC) were 401 and 435 K, and the melting temperature was reported to be 459 K by Horiuchi et al.39 Mahfoudh et al.38 reported considerably small endothermic peaks at 281, 340, and 377 K and a large endothermic peak at 408 K between 250 and 420 K. Their conductive and dielectric properties were reported to be functions of temperature. Subsequently, Mahfoudh et al.40 investigated the optical and dielectric properties of [NH2(CH3)2]2ZnBr4. Although the structure, NQR spectrum, and phase transition temperatures have been reported, the thermodynamic stability and molecular dynamics based on varying temperature have not been widely evaluated.
In this study, we aimed to grow [NH2(CH3)2]2ZnBr4, which is possibly a proton conductor owing to the availability of hydrogen bonds. The crystal structures and phase transition temperatures of [NH2(CH3)2]2ZnBr4 were determined using single-crystal X-ray diffraction (XRD), powder XRD, DSC, and differential thermal analysis (DTA). Thermogravimetry analysis (TGA) was performed to better understand the thermal properties of the samples. In addition, nuclear magnetic resonance (NMR) chemical shifts for 1H, 13C, and 14N were investigated to understand the coordination geometry and molecular dynamics of the organic [NH2(CH3)2]+ cation near the phase transition temperature TC. In addition, to elucidate the molecular motion and energy transfer, the spin-lattice relaxation time, T1ρ, for 1H and 13C were measured and investigated according to the temperature change. Herein, changes in the coordination geometry according to changes in temperature are explained by the changes in the N–H⋯Br hydrogen bonds between the [NH2(CH3)2]+ cations and ZnBr4 anions. Investigating the physicochemical properties of the phase transition mechanism can help expand the application scope of [NH2(CH3)2]2ZnBr4 crystals.
2. Experimental
[NH2(CH3)2]2ZnBr4 single crystals were grown via slow evaporation in a thermostat at 300 K using an aqueous solution containing NH(CH3)2·HBr (Aldrich, USA) and ZnBr2 (99.99%, Aldrich, USA) of 2![[thin space (1/6-em)]](https://www.rsc.org/images/entities/char_2009.gif) :
:![[thin space (1/6-em)]](https://www.rsc.org/images/entities/char_2009.gif) 1. To obtain a homogeneous solution, the solution was stirred and heated and then filtered through a filter. Thereafter, colourless single crystals grew after a few weeks.
1. To obtain a homogeneous solution, the solution was stirred and heated and then filtered through a filter. Thereafter, colourless single crystals grew after a few weeks.
The lattice parameters of the [NH2(CH3)2]2ZnBr4 crystal at 150 and 300 K were determined by single-crystal XRD at the Korea Basic Science Institute (KBSI) Seoul Western Center. A colourless crystal was mounted on a Bruker D8 Venture PHOTON III M14 diffractometer with a Mo-Kα radiation source and a nitrogen cold stream (223 K). Data was collected and integrated using SMART APEX3 (Bruker, 2016) and SAINT (Bruker, 2016). The absorption was corrected using the multiscan method implemented in SADABS. The structure was solved using direct methods and refined by full-matrix least-squares on F2 using SHELXTL.41 All non-hydrogen atoms were refined anisotropically and hydrogen atoms were added to their geometrically ideal positions. The powder XRD patterns were measured at several temperatures using an XRD system with a Mo-Kα radiation source.
DSC measurements were performed on the powder using a DSC 25 apparatus (TA Instruments, USA) at a heating rate of 10 K min−1 under a nitrogen gas atmosphere. A sample weighing 4.5 mg was used for temperature measurements between 200 and 570 K.
TGA and DTA experiments were conducted using a thermo-gravimetric analyser (TA Instruments, USA) at the same heating rate as that used for DSC from 300 to 873 K under nitrogen gas. Optical observations were performed using a Carl Zeiss microscope equipped with a Linkam THM-600 heating stage.
Magic-angle spinning (MAS) NMR chemical shifts and spin-lattice relaxation time T1ρ of the [NH2(CH3)2]2ZnBr4 crystal were measured using a Bruker 400 MHz Avance II+ NMR spectrometer (Bruker, Germany) at KBSI. The Larmor frequency for the 1H MAS NMR experiment was ωo/2π = 400.13 MHz, and that for 13C MAS NMR was ωo/2π = 100.61 MHz. To minimise spinning sidebands, the MAS speeds for 1H and 13C were measured at 10 kHz. Tetramethylsilane (TMS) and NH4NO3 were used as standard materials for accurate NMR chemical shift measurements. T1ρ values were obtained using a π/2−τ pulse, followed by a spin-lock pulse of duration τ, and the π/2 pulse widths for 1H and 13C were measured using a previously published method.38 NMR experiments were not feasible at higher temperatures because of the limitations of the instrument.
3. Results and discussion
3.1. Crystal structure and phase transition
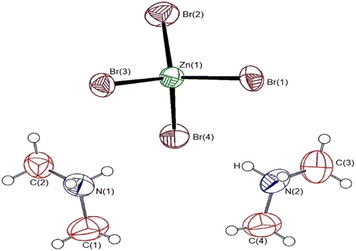
Single-crystal XRD results for the [NH2(CH3)2]2ZnBr4 crystals were obtained at 150 and 300 K. The crystal structure at the two temperatures were grown to a monoclinic structure with space group P21/n. The lattice constants at 150 K are a = 8.6262 Å, b = 11.9760 Å, c = 13.6877 Å, β = 90.3690°, and Z = 4, and those at 300 K are a = 8.7140 Å, b = 11.9709 Å, c = 13.8563 Å, β = 90.513°, and Z = 4. At both temperatures, the structures, space groups, and lattice constants are almost identical. The results at 150 and 300 K in our study are consistent with those obtained at 150 K by Mahfoudh et al.,40 but slightly different from those obtained at 300 K by Ishihara et al.37 Table 1 shows the XRD data of the [NH2(CH3)2]2ZnBr4 crystal at 150 and 300 K; the atomic numbering and thermal ellipsoids for each atom are shown in Fig. 1. The Zn atom is coordinated by four Br atoms, forming a nearly regular tetrahedron of ZnBr4. The hydrogen atoms of each formula unit form N–H⋯Br hydrogen bonds. Here, the length of N–H is 0.89 Å, and that of H⋯Br is in the range of 2.5–3.1 Å, which is consistent with previously reported results.37,38 The detailed crystallographic parameters at 150 and 300 K are presented in the ESI.†| Chemical formula | C4H16N2ZnBr4 | C4H16N2ZnBr4 |
| Weight | 477.20 | 477.20 |
| Crystal system | Monoclinic | Monoclinic |
| Space group | P21/n | P21/n |
| T (K) | 150 | 300 |
| a (Å) | 8.6262 (3) | 8.7140 (11) |
| b (Å) | 11.9760 (4) | 11.9709 (12) |
| c (Å) | 13.6877 (5) | 13.8563 (16) |
| β (°) | 90.3690 (10) | 90.513 (4) |
| Z | 4 | 4 |
| V (Å3) | 1414.01 | 1445.4 |
| Radiation type | Mo-Kα | Mo-Kα |
| Wavelength (Å) | 0.71073 | 0.71073 |
| Reflections collected | 26![[thin space (1/6-em)]](https://www.rsc.org/images/entities/char_2009.gif) 223 223 |
31![[thin space (1/6-em)]](https://www.rsc.org/images/entities/char_2009.gif) 613 613 |
| Independent reflections | 3503 (Rint = 0.0559) | 3610 (Rint = 0.0576) |
| Goodness-of-fit on F2 | 1.048 | 1.025 |
| Final R indices [I > 2sigma(I)] | R1 = 0.0214, wR2 = 0.0455 | R1 = 0.0312, wR2 = 0.0685 |
| R indices (all data) | R1 = 0.0268, wR2 = 0.0471 | R1 = 0.0444, wR2 = 0.0738 |
DSC curves were obtained for the [NH2(CH3)2]2ZnBr4 crystals at heating and cooling rates of 10 K min−1. In terms of heating, three strong endothermic peaks are observed at 401, 436, and 459 K (Fig. 2). This result is consistent with the DSC data reported by Horiuchi et al.39 The transition enthalpies (ΔH) obtained from the peak area for 401 and 436 K are 9.79 and 6.64 kJ mol−1, respectively, whereas that for 459 K is 13.79 kJ mol−1, which is determined using the same method. Furthermore, exothermic peaks attributed to cooling are observed at 313, 361, 386, and 421 K, and the resulting entropies are 0.74, 3.56, 2.21, and 13.07 kJ mol−1, respectively. The phase transition during heating and cooling is irreversible.
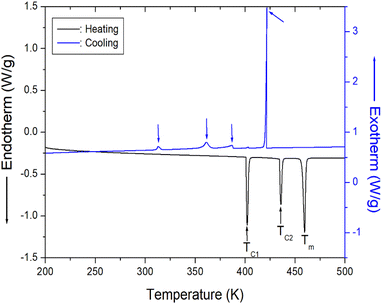 | ||
| Fig. 2 Differential scanning calorimetry curve of [NH2(CH3)2]2ZnBr4 crystal measured at heating and cooling speed of 10 K min−1. | ||
To further interpret the three endothermic peaks, the powder XRD patterns of [NH2(CH3)2]2ZnBr4 were measured at increasing temperatures. The results in the measuring range (2θ) of 5–60° are depicted in Fig. 3. The XRD powder patterns below 390 K (green) are slightly different from that recorded at 420 K (red); this difference is ascribed to TC1 (401 K), exhibiting a clear change in structure.
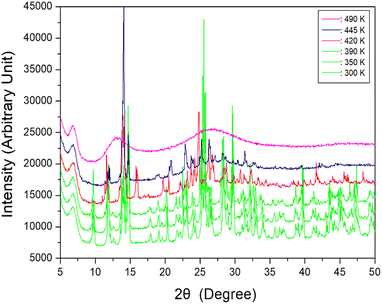 | ||
| Fig. 3 Powder X-ray diffraction patterns of [NH2(CH3)2]2ZnBr4 at 300, 350, 390, 420, 445, and 490 K. | ||
Furthermore, the XRD pattern recorded at 420 K is different from that recorded at 445 K, which is attributed to TC2 (436 K). Finally, when the temperature is increased to 490 K, the powder pattern exhibits a completely different appearance, specifically, a non-crystalline form. The appearance of a single crystal is observed as a final check using an optical polarizing microscope. The crystal exhibits colourless transparency without significant change until the temperature is increased from 300 to 450 K. Finally, the surface of the single crystal begins to melt at approximately 460 K. The phase transition and melting temperatures shown in the powder XRD results are in reasonable agreement with the endothermic peaks in the DSC curves. From the DSC, XRD, and polarising microscopy experiments, the phase transition and melting temperatures are defined as TC1 = 401 K, TC2 = 436 K, and Tm = 459 K, respectively. Based on the results of DSC, single-crystal XRD, and powder XRD experiments, the structure does not change at 281, 340, and 377 K. Therefore, phase transitions apparently do not occur at the three previously reported temperatures. More comprehensively, the difference in this result is presumably attributed to measurements performed under heating rate of 5 and 10 K min−1 during the DSC experiment. Moreover, a slight difference is considered to have occurred owing to the different basic reagents required for crystal growth.
3.2. Thermal properties
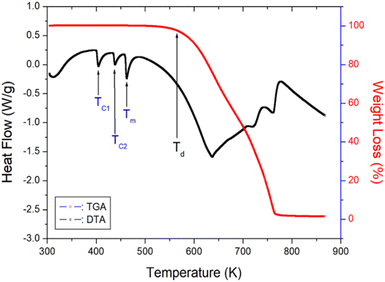
The TGA and DTA results obtained at a heating rate of 10 K min−1 are shown in Fig. 4. As the temperature is increased, the molecular weight of the [NH2(CH3)2]2ZnBr4 crystals remains almost constant up to 550 K. The initial molecular weight loss is 2% at 560 K, and this temperature is defined as the partial thermal decomposition temperature, Td. The molecular weight decreases sharply in the temperature range from 600 to 750 K, with a corresponding weight loss of 80% near 750 K, which is attributed to organic decomposition. Approximately 98% of the residual molecular weight is lost. Furthermore, the three endothermic peaks at 401, 436, and 459 K, shown in the DSC curve, are confirmed in the DTA curve.3.3. 1H and 13C NMR chemical shifts and spin-lattice relaxation times
The 1H NMR chemical shifts according to temperature change are shown in Fig. 5, and the two 1H signals attributed to NH2 and CH3 in the cation structure are expressed in different colours. At 300 K, the 1H chemical shift for NH2 was recorded at 7.84 ppm, and that for CH3 was obtained at 2.93 ppm. The 1H chemical shifts for CH3 are nearly independent of temperature, whereas those for NH2 move in a slightly negative direction with increasing temperature. The surrounding environment of 1H in NH2 continuously changes with temperature, without an abrupt change near the phase transition temperature TC1.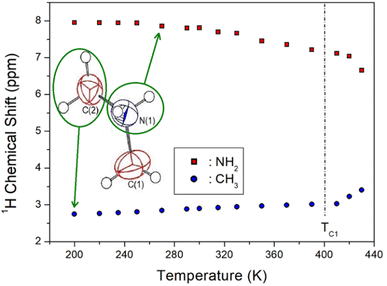 | ||
| Fig. 5 1H nuclear magnetic resonance chemical shifts of NH2 and CH3 in [NH2(CH3)2]2ZnBr4 based on the temperature change. | ||
The 13C chemical shifts in the MAS NMR spectra of [NH2(CH3)2]2ZnBr4 with increasing temperature are shown in Fig. 6. The 13C chemical shift for TMS as the standard reference at 300 K is recorded at 38.3 ppm, and this value is set to 0 ppm. Only the 13C resonance line is recorded as one type of 13C for the methyl carbons in the cation (inset of Fig. 6). The 13C chemical shifts change more rapidly with temperature that those of 1H. At 300 K, the 13C chemical shift is recorded at 37.14 ppm, whereas that at 410 K above TC1 is discontinuously shifted to 39.12 ppm. In addition, at 430 K, which is close to TC2, the NMR spectrum is separated into two resonance lines, showing chemical shifts of 39.36 and 38.28 ppm. The spectra below and above the phase transition temperature TC1 are depicted in blue and red, respectively. The chemical shifts of 13C close to 14N considerably change near TC1, which implies that the environments surrounding 13C change. The full-width at half-maximum for 13C NMR spectra with respect to the temperature is shown in the inset of Fig. 6. The width of the resonance line is approximately 0.61 ppm at 300 K. As the temperature increases, the line width decreases rapidly, and that above TC1 is broadened again. The line width decreases with increasing temperature owing to internal molecular motion.
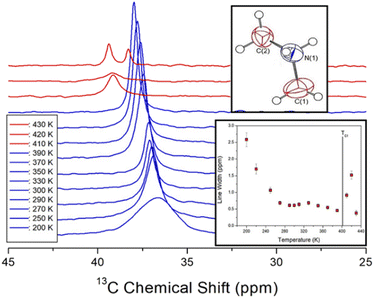 | ||
| Fig. 6 In situ 13C NMR spectra in [NH2(CH3)2]2ZnBr4 for different temperatures (inset: change in line width for 13C in [NH2(CH3)2]2ZnBr4 with changing temperature). | ||
The 1H and 13C MAS NMR spectra were measured by changing the delay time at each temperature, and the plots of changes in intensity versus delay time were expressed as single-exponential functions. As shown in eqn (1), the reciprocal of the slope of the graph can be characterised as the spin-lattice relaxation time T1ρ.42–44
I(τ) = I(0)![[thin space (1/6-em)]](https://www.rsc.org/images/entities/char_2009.gif) exp(−τ/T1ρ) exp(−τ/T1ρ)
| (1) |
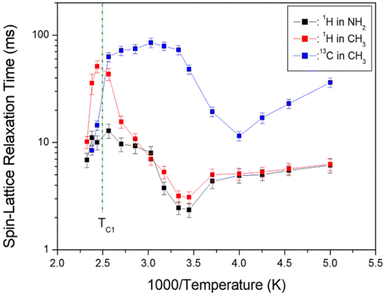 | ||
| Fig. 7 1H and 13C NMR spin-lattice relaxation times T1ρ in [NH2(CH3)2]2ZnBr4 as functions of inverse temperature. | ||
The 1H T1ρ values are strongly dependent on the temperature change; 1H T1ρ of CH3 above TC1 exhibits longer values than that of NH2. An abruptly short value is observed above TC1, and energy transfer is facilitated with abruptly short T1ρ values. 1H T1ρ values for NH2 and CH3 decrease slightly with increasing temperature and increase again above 290 K. Below TC1, the 1H T1ρ values for CH3 demonstrate a similar trend to that of the 1H values for NH2. In addition, the 13C T1ρ values decrease with increasing temperature, similar to 1H T1ρ, and again increase above 250 K. At temperatures below TC1, 13C T1ρ values are approximately 10 times longer than 1H T1ρ. At temperatures below TC1, the T1ρ values of 1H and 13C are minimum at 290 and 250 K, respectively, indicating molecular motion according to the Bloembergen–Purcell–Pound (BPP) theory. The T1ρ minimum is related to the re-orientational motion of NH2 and CH3 ions. The experimental value of T1ρ is expressed as the correlation time τC by the BPP theory, according to which T1ρ for molecular motion is given by:34,35
| (1/T1ρ) = C (γH2γC2ħ2/r6){4τC/[1 + ω12τC2] + τC/[1 + (ωC − ωH)2τC2] + 3τC/[1 + ωC2τC2] + 6τC/[1 + (ωC + ωH)2τC2] + 6τC/[1 + ωH2τC2]} | (2) |
 , where
  is the pre-correlation time, Ea is the activation energy of the molecular motions, and kB is the Boltzmann constant.36 The activation energy Ea depends on the molecular dynamics. To determine the molecular dynamics, τC is plotted against 1000/T on a logarithmic scale as shown in Fig. 8. The obtained values of Ea are 37.19 ± 1.66 kJ mol−1 for 1H in NH2, 31.87 ± 1.50 kJ mol−1 for 1H in CH3, and 21.67 ± 3.82 kJ mol−1 for 13C in CH3.
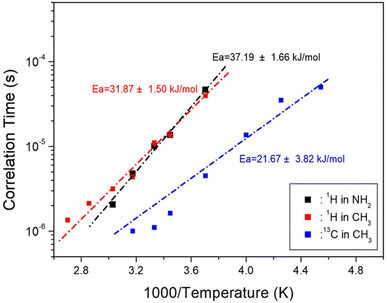 | ||
| Fig. 8 Activation energies with correlation times for 1H and 13C in [NH2(CH3)2]2ZnBr4 as functions of inverse temperature. | ||
3.4. Static 14N resonance frequency
The static NMR spectra of 14N at the centre of the cation in the [NH2(CH3)2]2ZnBr4 single crystal are shown in Fig. 9. Spectra in the temperature range of 200–420 K are obtained, and the direction of the applied magnetic field is measured with reference to the arbitrary direction of the single crystal. 14N has a spin number of 1,44 and two resonance signals are expected from the quadrupole interaction. The 14N resonance frequency is extremely low at 28.90 MHz, and a resonance signal is not easily obtained by wiggling the baseline (inset of Fig. 9). Owing to the low intensity and the relatively broad line width, the signals are not easily distinguished. The resonance frequencies of the 14N NMR spectra are shown in Fig. 9 at several temperatures. Pairs for 14N are indicated by symbols of the same colour.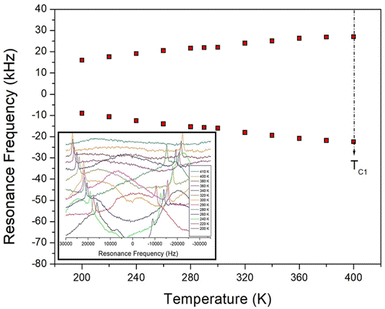 | ||
| Fig. 9 Temperature dependence of 14N resonance frequency in the [NH2(CH3)2]2ZnBr4 crystal (inset: in situ 14N NMR spectra of [NH2(CH3)2]2ZnBr4 as a function of temperature). | ||
The separation of two resonance lines increase slightly with increasing temperature. However, the 14N NMR spectra disappear at temperatures near TC1 because of the re-orientational motion of ZnBr4 tetrahedra and/or the thermal motion of the [NH2(CH3)2]+ cations. The continuous variation in the 14N resonance frequency with changing temperature indicates a change in the coordination geometry of the environment around N.45
4. Conclusions
The crystal structure, phase transition, thermal stability, and molecular dynamics of [NH2(CH3)2]2ZnBr4 crystals were investigated using XRD, DSC, TGA, and NMR. TC values obtained from the DSC and XRD results were only 401 and 436 K, respectively, and single-crystal XRD results indicated that no phase transition occurred between 150 and 300 K. The peak at 459 K, as observed in the DSC experiment, was confirmed to be the melting temperature. The thermal stability was considerably high, with a thermal decomposition temperature of ∼560 K. In the NMR spectra, changes were observed in the 1H and 14N chemical shifts for NH2 and in the 13C chemical shifts near TC1, indicating changing structural environments. The environments of 1H, 13C, and 14N located near NH2 in the [NH2(CH3)2]+ cation significantly influenced it, thus indicating a change in the N–H⋯Br hydrogen bond with the coordination geometry of the ZnBr4 anion. The 1H T1ρ and 13C T1ρ values decreased rapidly near TC1, suggesting that energy transfer was facilitated. The increased variations in the 1H NMR chemical shift and T1ρ of NH2 in the cation with changes in temperature relative to those of CH3 caused the significant change in the N–H⋯Br hydrogen bonding between the Br around Zn and H of NH2. These fundamental properties open efficient avenues for the development of organic–inorganic hybrids, thus qualifying them for practical applications.Author contributions
A. R. Lim performed NMR and X-ray experiments, and wrote the manuscript.Conflicts of interest
There are no conflicts to declare.Acknowledgements
This research was supported by the Basic Science Research Program of the National Research Foundation of Korea (NRF), funded by the Ministry of Education, Science, and Technology (2018R1D1A1B07041593 and 2016R1A6A1A03012069).References
- Y.-F. Gao, T. Zhang, W.-Y. Zhang, Q. Ye and F. Da-Wei, J. Mater. Chem. C, 2019, 7, 9840 RSC.
- Z.-X. Yu, P.-P. Zhang, W.-Y. Shi, Q. Y. Zhang and D.-W. Fu, J. Phys. Chem. C, 2019, 123, 28385 CrossRef.
- M. Mathlouthi, A. Valkonen, M. Rzaigui and W. Smirani, Phase Transitions, 2017, 90, 399 CrossRef CAS.
- X.-N. Hua, J.-X. Gao, T. Zhang, X.-G. Chen, D.-S. Sun, Y.-Z. Zhang and W.-Q. Liao, J. Phys. Chem. C, 2019, 123, 21161 CrossRef CAS.
- Z.-X. Wang, Y. Zhang, Y.-Y. Tang, P.-F. Li and R.-G. Xiong, J. Am. Chem. Soc., 2019, 141, 4372 CrossRef CAS PubMed.
- Z.-X. Wang, H. Zhang, F. Wang, H. Cheng, W.-H. He, Y.-H. Liu, X.-Q. Huang and P.-F. Li, J. Am. Chem. Soc., 2020, 142, 12857 CrossRef CAS PubMed.
- Y.-L. Zeng, X.-Q. Huang, C.-R. Huang, H. Zhang, F. Wang and Z.-X. Wang, Angew. Chem., Int. Ed., 2021, 60, 10730 CrossRef CAS PubMed.
- X.-G. Chen, X.-J. Song, Z.-X. Zhang, P.-F. Li, J.-Z. Ge, Y.-Y. Tang, J.-X. Gao, W.-Y. Zhang, D.-W. Fu, Y.-M. You and R.-G. Xiong, J. Am. Chem. Soc., 2020, 142, 1077 CrossRef CAS PubMed.
- M. Maczka, J. K. Zareba, A. Gagor, D. Stefanska, M. Ptak, K. Roleder, D. Kajewski, A. Soszynski, K. Fedoruk and A. Sieradzki, Chem. Mater., 2021, 33, 2331 CrossRef CAS.
- M. Maczka, M. Ptak, A. Gagor, D. Stefanska, J. K. Zareba and A. Sieradzki, Chem. Mater., 2020, 32, 1667 CrossRef CAS.
- K. Han, X. Ye, B. Li, Z. Wei, J. Wei, P. Wang and H. Cai, Inorg. Chem., 2022, 61, 11859 CrossRef CAS PubMed.
- H. Zhang, Y.-H. Tan, Y.-Z. Tang, X.-W. Fan, X.-L. Peng, R.-R. Han, Y.-K. Li and F.-X. Wang, Inorg. Chem., 2022, 61, 10454 CrossRef CAS PubMed.
- O. Knop, R. E. Wasylishen, M. A. White, T. S. Cameron and M. J. M. Van Oort, Can. J. Chem., 1990, 68, 412 CrossRef CAS.
- Q. Chen, N. D. Marco, Y. Yang, T.-B. Song, C.-C. Chen, H. Zhao, Z. Hong, H. Zhou and Y. Yang, Nano Today, 2015, 10, 5 CrossRef.
- I. M. Hermes, S. A. Bretschneider, V. W. Bergmann, D. Klasen, J. Mars, W. Tremel, F. Laquai, H.-J. Butt, M. Mezger, R. Berger, B. J. Rodriguez and S. A. L. Weber, J. Phys. Chem., 2016, 120, 5724 CrossRef CAS PubMed.
- E. Strelcov, Q. Dong, T. Li, J. Chae, Y. Shao, Y. Deng, A. Gruverman and J. Huang, Sci. Adv., 2017, 3, e1602165 CrossRef PubMed.
- S. K. Abdel-Aal, A. S. Abdel-Rahman, G. G. Kocher-Oberlehner, A. Ionov and R. Mozhchil, Acta Crystallogr., Sect. A: Found. Adv., 2017, 70, C1116 Search PubMed.
- Y. Liu, L. Collins, R. Proksch, S. Kim, B. R. Watson, B. Doughty, T. R. Calhoun, M. Ahmadi, A. V. Ievlev, S. Jesse, S. T. Retterer, A. Belianinov, K. Xiao, J. Huang, B. G. Sumpter, V. Kalinin, B. Hu and O. S. Ovchinnikova, Nat. Mater., 2018, 17, 1013 CrossRef CAS PubMed.
- S. Gonzalez-Carrero, R. E. Galian and J. Perez-Prieto, Part. Part. Syst. Charact., 2015, 32, 709 CrossRef CAS.
- B. Staskiewicz, O. Czupinski and Z. Czapla, J. Mol. Struct., 2014, 1074, 723 CrossRef CAS.
- B. Staskiewicz, I. Turowska-Tyrk, J. Baran, C. Gorecki and Z. Czapla, J. Phys. Chem. Solids, 2014, 75, 1305 CrossRef CAS.
- Z. Czapla, J. Przesławski, M. Crofton, J. Janczak, O. Czupinski, A. Ingram and M. Kostrzewa, Phase Transitions, 2017, 90, 637 CrossRef CAS.
- S. K. Abdel-Aal, G. Kocher-Oberlehner, A. Ionov and R. N. Mozhchil, Appl. Phys. A, 2017, 123, 531 CrossRef.
- Y. Wei, P. Audebert, L. Galmiche, J. S. Lauret and E. Deleporte, Materials, 2014, 7, 4789 CrossRef PubMed.
- S. Ahmad, C. Hanmandlu, P. K. Kanaujia and G. V. Prakash, Opt. Mater. Express, 2014, 4, 1313 CrossRef CAS.
- S. K. Abdel-Aal and A. S. Abdel-Rahman, J. Cryst. Growth, 2017, 457, 282 CrossRef CAS.
- G. Vlokh, V. B. Kapustyanyk, I. I. Polovinko, S. A. Sveleba, V. M. Varikash and Z. A. Bobrova, Appl. Spectrosc., 1990, 52, 527 CrossRef.
- V. I. Torgashev, Yu. I. Yuzyuk, L. M. Rabkin, Yu. I. Durnev and Z. A. Bobrova, Phys. Status Solidi B, 1991, 168, 317 CrossRef CAS.
- I. I. Polovinko, S. A. Sveleba, V. Kapustianyk and V. S. Zhmurko, Phys. Status Solidi A, 1992, 131, 13 CrossRef.
- V. B. Kapustianik, I. I. Polovinko, S. A. Sveleba, O. G. Vlokh, Z. A. Bobrova and V. M. Varikash, Phys. Status Solidi A, 1992, 133, 45 CrossRef.
- V. Dzhala, V. Kapustianik, I. Kityk, I. Polovinko and S. Sveleba, Ferroelectrics, 1994, 152, 273 CrossRef.
- V. B. Kapustianik, H. Kabelka, H. Warhanek and A. Fuith, Phys. Status Solidi A, 1996, 155, 95 CrossRef CAS.
- V. B. Kapustyanyk, Appl. Spectrosc., 1998, 65, 427 CrossRef CAS.
- N. H. Kim, J. H. Choi and A. R. Lim, Solid State Sci., 2014, 38, 103 CrossRef CAS.
- A. R. Lim and Y. Paik, Solid State Sci., 2017, 65, 61 CrossRef CAS.
- N. Mahfoudh, K. Karoui, M. Gargouri and A. BenRhaiem, Appl. Organomet. Chem., 2020, 34, e5404 CAS.
- H. Ishihara, S.-q. Dou, K. Horiuchi, V. G. Krishnan, H. Paulus, H. Fuess and A. Weiss, Z. Naurforsch. A, 1996, 51, 1027 CrossRef CAS.
- N. Mahfoudh, K. Karoui, F. Jomni and A. B. Rhaiem, Appl. Organomet. Chem., 2020, 34, e5656 CAS.
- K. Horiuchi, H. Ishihara and H. Terao, J. Phys.: Condens. Matter, 2000, 12, 4799 CrossRef CAS.
- N. Mahfoudh, K. Karoui and K. BenRhaiem, RSC Adv., 2021, 11, 24526 RSC.
- M. Y. Choi, S. J. Lee, H. Ju and A. R. Lim, RSC Adv., 2022, 12, 20679 RSC.
- A. R. Lim, Sci. Rep., 2020, 10, 20853 CrossRef CAS PubMed.
- A. Abragam, The Principles of Nuclear Magnetism, Oxford Univ. Press, 1961 Search PubMed.
- J. L. Koenig, Spectroscopy of Polymers, Elsevier, New York, 1999 Search PubMed.
- S. H. Kim and A. R. Lim, Solid State Sci., 2022, 131, 106927 CrossRef CAS.
Footnote |
| † Electronic supplementary information (ESI) available. See DOI: https://doi.org/10.1039/d2ra06697a |
| This journal is © The Royal Society of Chemistry 2023 |

