 Open Access Article
Study on the definition, mechanism and controllability of secondary bubbles based on the bubble nucleation model in injection foaming polypropylene†
Jinfu Xinga,
Bujin Liu a,
Tuanhui Jiangab,
Yujing Youa,
Xiangbu Zengab,
Jinkui Yangab,
Chun Zhangb,
Wei Gong*ac and
Li He
 *ab
*ab
aCollege of Materials and Metallurgy, Guizhou University, Guiyang 550025, China Web: gw20030501@163.com
bNational Engineering Research Center for Compounding and Modification of Polymeric Materials, Guiyang 550014, China
cSchool of Materials and Architectural Engineering, Guizhou Normal University, Guiyang 550025, China
First published on 19th January 2023
Abstract
The process of nucleation and growth of polypropylene foam was observed by using visualizations of the mold-opening foam injection molding (MOFIM) and free foaming (FREEF). The fitting of the mathematical model formula was used to supplement the judgment conditions of the secondary bubbles to explore the generation process and formation conditions of the secondary bubbles. The results of changes in blowing agent content and melt temperature proved the rationality of the judgment basis and the appearance of secondary bubbles started from the late stage of balanced-foaming. Then, the combined action of several nucleation mechanisms led to the emergence of secondary bubbles, which was observed utilizing glass fibers as nucleating agents and tracers. The data for the two foaming modes indicated that the formation of secondary bubbles is closely related to temperature and pressure drop. The bubble nucleation model was amended and validated by regulating the temperature variation in the mold cavity to control the number of secondary bubbles, which enabled the nucleation process of secondary bubbles to be fitted to an “S-shaped” curve. Finally, a controllable number of secondary bubbles was obtained from the bimodal bubble structure. Herein, this study enriches our understanding of the formation process of secondary bubbles, and provides theoretical guidance for fabricating high density, small size foam materials.
1. Introduction
Polymer foam is a material that takes polymer resin as the matrix and introduces gas into the matrix to obtain a large number of cells in the structure.1–3 Due to the advantages of lightweight, minimal material use, broadband absorption properties,4 heat insulation and electromagnetic shielding,5,6 polymer foam plastics have been widely utilized in construction, buffer packaging, automotive aerospace, furniture and other industries. The properties of the polymer foam are largely determined by the basic properties of the polymer matrix, and the cell size, morphology and distribution of the final foamed materials.7–9 Nevertheless, the process of bubble nucleation and growth determines the structure of the cells, and secondary nucleation in bubble nucleation also affects the foaming quality of the foamed material. Therefore, in order to obtain high-quality microcellular foamed materials with a uniform cell size and cell distribution, it is necessary to investigate the nucleation and growth laws of secondary bubbles during the foaming process.Many researchers have systematically studied the nucleation and growth process of bubbles during different foaming processes, and multiple rules and conclusions have made dramatic contributions to people's understanding of bubble nucleation and growth in different foaming processes. For example, Albalak et al.10 obtained extruded plastics of LDPE/hexane by instant and rapid cooling at different processing times, and observed their cell morphology using SEM. They proposed that cell expansion could create tensile stress in the surrounding molten plastic, resulting in a localized system pressure reduction, which further induces the nucleation of secondary bubbles around the cell. Yarin et al.11 suggested that elastic energy was stored in the vicinity of the initial bubble, and secondary bubbles were formed in the vicinity of the initial bubble as the elastic energy was released. Additionally, Chen et al.12 established a bubble stretching model to explain the effect of shear stress on bubble nucleation. The results show that the conversion of mechanical shear energy to surface energy was the key to the bubble nucleation induced by shear stress. To obtain a deeper understanding of the secondary bubble nucleation process, many researchers developed experimental foaming visualization techniques and numerical models to observe and predict bubble nucleation and growth processes. Wong et al.13 investigated the effect of tensile stress/strain on polystyrene/CO2 foaming behavior under different process conditions. It was found that as the tensile strain increased, the expansion of already-nucleated bubbles caused the generation of secondary bubbles around them. Secondary bubble expansion subsequently supported the formation of tertiary bubbles around them. Peng et al.14 adopted a visual system for observing the nucleation and growth of bubbles during extrusion foaming. They found that the previously already-nucleated bubbles would break into small bubbles under the action of a sufficient stress gradient. Shaayegan et al.15,16 observed the formation of “satellite bubbles” around the already-nucleated bubbles, and the formation of circular “contraction-induced” bubbles due to the cavity pressure drop during melt contraction. Nucleation of the “satellite bubbles” does not indicate a stage of secondary bubble formation. Instead, the “contraction-induced” bubbles indicate that the secondary bubbles are formed after the melt is no longer flowing and contracting. The above results show that the current research on secondary bubbles is mainly focused on the mechanism of secondary bubble formation. However, they only indicate that the bubbles close to already-nucleated bubbles are secondary bubbles, and also they do not give a clear judgment on the appearance of the secondary bubbles (i.e., whether the secondary bubbles exist in the entire foaming process or appear from a certain moment). Therefore, it is necessary to further understand the nucleation law of the secondary bubbles to control their emergence, which has a crucial impact on obtaining foamed structural materials with the coexistence of large and small bubbles.
Polymeric foams containing large and small cells are referred to as bimodal cellular structural foams. Compared with the traditional unimodal cell structure foam, the bimodal cell structure foam has better sound absorption properties,17 thermal insulation properties18 and mechanical properties. Li et al.19 investigated the formation mechanism of bimodal cellular materials prepared by a two-step decompression method via in situ visualization. Xu et al.20 used the synergistic combination of temperature rise and pressure drop to prepare bimodal polystyrene foam. They believed that large cells were formed during the heating stage and grew during the subsequent pressure drop, and small cells were also created at this time. However, batch foaming has limited the production of bimodal foams due to its inefficiency and small product size. Microcellular injection molding (MIM) is a method used to efficiently produce microcellular products of various shapes. Ameli et al.21,22 obtained PLA foam with a bimodal structure using a MIM technique equipped with gas backpressure equipment. Zhao et al.23 designed a specific mold with thin cavities to achieve fast cooling MIM, which prepared lightweight bimodal micro- and nanoporous PP foams with high toughness. At present, the foaming technology used for preparing bimodal foam materials by injection foaming is relatively difficult, and there are few reports on obtaining bimodal foam materials by regulating the injection molding process. Therefore, for the sake of further obtaining bimodal structural foams via injection foaming, it is very important to study the influence of process parameters in obtaining bimodal foams to guide the subsequent research.
Hence, this work took chemical foaming as the main line, and coupled it with the numerical fitting of two foaming processes to discuss the emergence process and formation conditions of secondary bubbles by designing a dynamic foaming visualization system. In addition, glass fiber was utilized as a nucleating agent and tracer for the study of the formation mechanism of secondary bubbles. Subsequently, the bubble nucleation model was amended and validated by regulating the temperature variation in the mold cavity to control the number of secondary bubbles. Finally, the bimodal structure was obtained as a result of the controllable preparation of the secondary bubbles.
2. Theoretical basis
According to the classical nucleation theory,24,25 whether an already produced bubble embryo or a newly produced bubble embryo, as long as the radius of the bubble embryo is larger than the critical radius of the bubble (Rcr), bubbles will spontaneously grow, while bubbles smaller than it will collapse. Assuming that the polymer-gas system is a weak solution, the pressure in the bubble can be expressed using the Henry's Law,26 and Rcr can be expressed as follows:
 | (1) |
 | (2) |
In addition, according to the mathematical model formula established by a research group in the early stage, the process of bubble nucleation was well simulated.27 The model formula was modified as follows:
 | (3) |
3. Experimental
3.1 Materials
Polypropylene (PP, T30S) with a density of 0.192 g cm−3 and a melting index of 2.94 g/10 min from Xinjiang Dushanzi Petrochemical Company was used as the polymer matrix. The chemical blowing agent was azodicarbonamide (AC) with a gas production of 220 mL g−1, which was provided by Wuhan Hanhong Chemical Plant. Low density polyethylene (LDPE, 2426H) with a density of 0.968 g cm−3 and a melting index of 1.6 g/10 min from Lanzhou Petrochemical Company was used as the matrix material of the foaming masterbatch. β-Cyclodextrin (BC) with a density of 1.23 g cm−3 was purchased from Tianjin Kemiou Chemical Reagents Co., LTD. Foaming masterbatch, foaming supplementary masterbatch and nucleating agent masterbatch were self-prepared.28,293.2 Visualization and dynamic observation of the foaming process
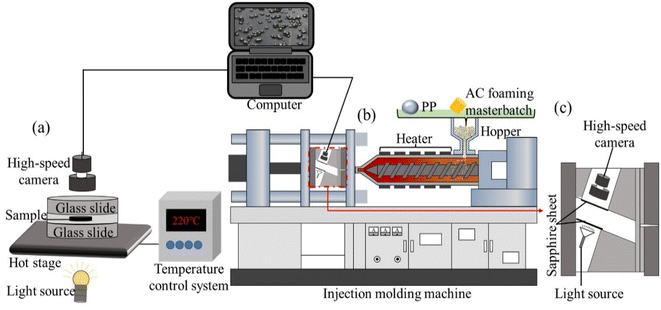
Processing parameters used in the FREEF and MOFIM experiments, which we used for visual observation, are summarized in Table 1. If no special instructions are given, the AC content, mold temperature, experimental temperature, and cooling time have default values of 0.3 wt%, 40 °C, 220 °C, and 30 s, respectively.
| Processing parameter | FREEF | MOFIM |
|---|---|---|
| AC content (wt%) | 0.3, 0.5 | 0.3, 0.5 |
| Melt temperature (°C) | 200, 220 | 200, 220 |
| Mold temperature (°C) | — | 25, 40, 55 |
| Delay mold opening time (“det”) (s) | — | 0, 0.3, 0.5, 0.7,25 |
| Mold opening distance (mm) | — | 0.5 |
| Injection speed (mm s−1) | — | 30 |
| Injection pressure (bar) | — | 40 |
| Injection volume (mm) | — | 22 |
4. Results and discussion
4.1 Judgment conditions for secondary bubbles
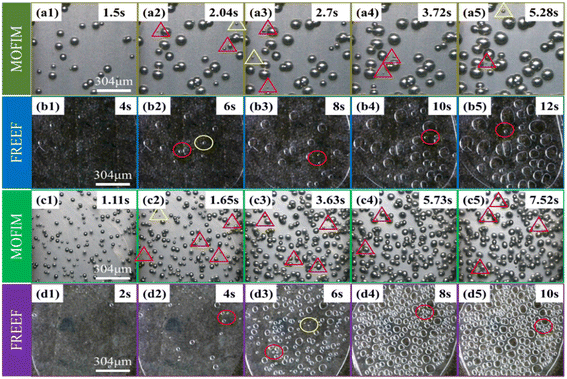
Visualizing foaming experiments and the fitted curves of the bubble nucleation model were used to explore the effect of the AC content and foaming environment on secondary bubble nucleation in the PP/AC system. The foaming process of PP during MOFIM and FREEF with AC contents of 0.3 wt% and 0.5 wt% is displayed in Fig. 2. The time included in each image represents the length of time from the appearance of the first bubble. The statistical results of the number of bubbles in the process of bubble nucleation at different blowing agent contents and in different foaming environments are shown in Fig. 3, where the points are the experimental values. The number of bubbles increased with the increase of blowing agent content, and MOFIM obtained more bubbles than FREEF at the same blowing agent content. Additionally, as the amount of blowing agent increases, the time it takes for bubbles to begin nucleating gets shorter.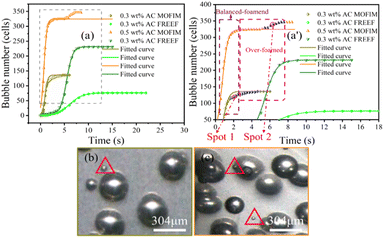 | ||
| Fig. 3 (a and a′) N–t curves of experimental and fitted values, (b) the visual observation images of spot 1, and (c) the visual observation images of spot 2. | ||
The curves in Fig. 3 represent the fitted curves of bubble number with time based on the bubble nucleation model. According to Fig. 3(a), the experimental values and model values of the two foaming methods have different degrees of fit. From the initial stage of bubble nucleation to the bubble number stabilization, the fitted curves show good agreement with the experimental values obtained by FREEF. However, the fitted curves obtained by MOFIM deviate significantly from the experimental values at the middle and late stages of the experimental foaming process. This deviation shows two characteristics: (1) deviation of the model curves from the experimental values before the bubble number is stabilized, and (2) serious deviation of the model curves from the experimental values after the bubble number has largely stabilized. These deviations are shown as blue points in Fig. 3(a′).
Interestingly, as shown in Fig. 3(b) and (c), new small bubbles (red triangle) appear around the stable bubble at the blue deviation point in Fig. 3(a′). According to the literature,15,30 these new bubbles can be referred to as secondary bubbles or satellite bubbles. They suggest that the growth of the stable bubble had a stressing effect on the surrounding resin, causing secondary bubbles to appear at higher energy positions. Accordingly, the nucleation tendency of the original bubble is altered as a result of secondary bubbles forming around the stable bubble, which leads to a poor fit between experimental values and model curves. However, this is not reason enough to judge the secondary bubbles depending on the presence of new small bubbles around the stable bubbles. Because new bubbles are present around the stable bubble in Fig. 2(a1) and (c1), and the FREEF visualization results also show the appearance of new small bubbles around the stable bubbles in Fig. 2 (red circles), it is uncertain whether these are secondary bubbles. Consequently, for investigation of the formation process of the secondary bubbles, the following assumptions are put forward: (1) in the second half of the experimental foaming process, before the number of bubbles stabilizes, and (2) after the number of bubbles has substantially stabilized, new tiny bubbles appear within the range where the experimental values deviate from the fitted curve during these two time periods. We assume that the bubbles that satisfy these two conditions simultaneously during the foaming process are secondary bubbles. Although the appearance of secondary bubbles can be clearly observed by visualization equipment, it is not well known whether secondary bubbles accompany the whole foaming process. Our previous studies showed that the nucleation and growth process of bubbles can be divided into three stages: less-foaming, balanced-foaming and over-foaming.31,32 It can be seen from Fig. 3(a′) that the model curves obtained by MOFIM show good agreement with the experimental values before the late stage of balanced-foaming. However, after the bubbles are in the late stage of the balanced-foaming stage (blue point), the appearance of secondary bubbles leads to deviation between the model curves and the experimental values. The experimental results obtained at different melt temperatures are consistent with this phenomenon (Fig. S1 and S2†). Therefore, secondary bubbles do not exist in the whole foaming process, but start to appear from the middle and late stage of balanced-foaming until the number of bubbles is stabilized, but the formation mechanism is not completely clear.
4.2 How do secondary bubbles form?
According to classical nucleation theory, bubble nuclei smaller than the critical nucleation radius will be annihilated and dissipate, while the bubble nuclei larger than the critical radius will grow to form bubbles. Therefore, the essence of secondary bubble generation is that the critical nucleation radius is further reduced during the polymer foaming process (i.e., the nucleation of secondary bubble caused by the unstable thermodynamic state in the foaming process). This unstable state is strongly linked to the addition of nucleating agent, the residual gas remaining in the resin, and the variation in the foaming system's temperature and pressure environment. Leung et al.30 revealed that the expansion of already-nucleated bubbles in the presence of nucleating agents leads to the formation of secondary bubbles. They believed that bubble growth created a tangential stretching effect on the surface of the nucleating agent and a flow field in the surrounding polymer-gas solution, which reduced the critical nucleation radius and promoted the nucleation of new bubbles. The phenomenon is well demonstrated in Fig. 4 (red box), wherein the images obtained by MOFIM show many small secondary bubbles present around the grown stable bubbles. Many small bubbles with non-uniform diameters also appeared around the stable bubbles in the FREEF visualization images. However, according to Fig. S3(a)–(a′),† the fitting degree of the N–t curves are better and there is no complete deviation under the FREEF condition. At this time, although there are small bubbles in the system around the stable bubbles, these bubbles cannot be regarded as secondary bubbles according to the previous hypothesis. On the contrary, the fitted curves obtained by the MOFIM technology show deviation from the experimental values from the late stage of balanced-foaming, and small secondary bubbles appeared in the foaming system, as shown in Fig. S3(b) and (c).† Therefore, the addition of nucleating agents is not the main factor leading to the formation of secondary bubbles.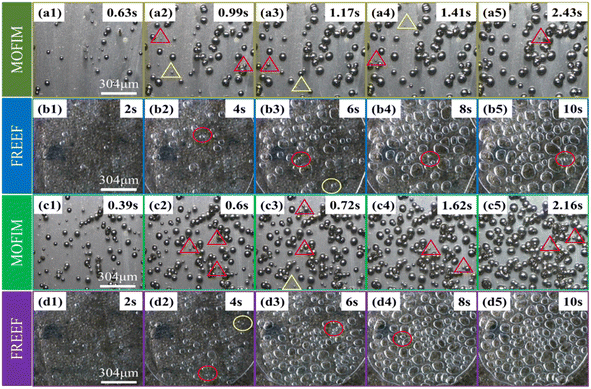 | ||
| Fig. 4 Visual observation images of secondary bubble growth process of PP/β-CD system: (a) MOFIM + 0.15 wt%β-CD, (b) FREEF + 0.15 wt%β-CD, (c) MOFIM + 0.45 wt%β-CD, and (d) FREEF + 0.45 wt%β-CD. | ||
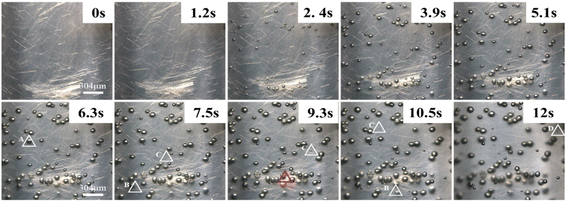
In addition, Fig. 5 shows the results of visualization at different times upon using glass fibers as a nucleating agent and tracer. As shown in Fig. 5, there are four types of secondary bubbles: (1) bubble A appears around the stable bubbles without glass fibers; (2) bubble B appears around the stable bubbles with glass fibers; (3) bubble C appears around the glass fibers; (4) the pressure drop caused by the cooling shrinkage of the melt induces the appearance of bubble D. Meanwhile, there is no obvious appearance of secondary bubbles at the position of glass fiber agglomeration (red triangle). Wang et al.33 found by numerically simulation that the tensile stress caused by bubble growth is very significant near the nucleating agent particles, which is beneficial to the growth of bubble nuclei around the nucleating agent, and this mechanism manifested in the formation of bubbles A and B. However, the presence of bubble C indicates that the bubbles far away from the nucleating agent particles can also induce the generation of new bubbles, which may not be caused by the tensile stress of the bubbles. Gong et al.34 established a radial response area model of bubble growth and showed that the growth of bubbles affects the radial migration and circumferential stretching of the surrounding resin within a certain range. Liu et al.35 proposed that in the presence of residual gas in the foaming system, slow pressure unloading and pressure fluctuations in the mold cavity would generate a gradient of critical nucleation radius, which induced the generation of secondary bubbles. This mechanism is reflected in the formation of bubble C. After the mold opening is completed, the cooling and shrinkage of the polymer melt is accompanied by a small pressure drop. Such external field changes lead to a lower energy barrier in the region of higher residual gas density within the resin, which induces secondary bubbles. This mechanism occurs in the formation of bubble D. Therefore, here, we further confirmed the formation mechanism of secondary bubbles through visualization equipment, i.e., the formation of secondary bubbles during foaming is accompanied by the coupling action of multiple mechanisms.
Combined with the experimental data in Section 4.1, the appearance of secondary bubbles can be regarded as the interaction between the stable bubbles and resin, and the influence of temperature and pressure fields in the mold cavity. MOFIM is a foaming process involving mold opening and pressure release, polymer melt cooling and shrinking. In contrast, the foaming process of FREEF is carried out under atmospheric pressure and constant temperature heating. The biggest difference between the two methods is the difference in temperature and pressure in the foaming environment. Hence, in follow-up experiments with the same mold opening distance, the effect of temperature variation in the mold cavity on the secondary bubbles was examined.
4.3 Mathematical model for the nucleation of secondary bubbles
To achieve controllability of the number of secondary bubbles, a series of visual MOFIM experiments was carried out. Both mold temperature and mold open time affect the secondary bubble nucleation and final bubble size. The secondary bubble morphology of the MOFIM experiments is shown in Fig. 6(a)–(e).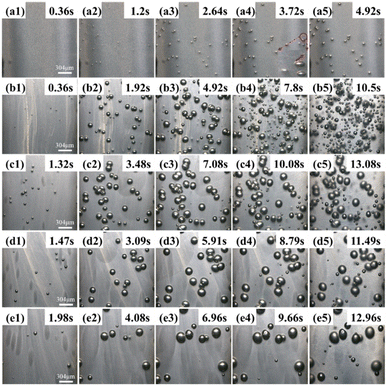 | ||
| Fig. 6 Secondary bubble morphology under different conditions: (a) 25 °C mold temperature, (b) 55 °C mold temperature, (c) det = 0.3 s, (d) det = 0.5 s, and (e) det = 0.3 s. | ||
Based on the results in Fig. 6 and 7(a) shows the fitted curve at 25 °C mold temperature. It can be seen that there is only a small deviation between the experimental values and fitted curve, which indicates that the formation of secondary bubbles is hindered at low mold temperature. Fig. 7(b) shows the effect of a higher mold temperature on the fitted curve of the secondary bubbles. It is clear that by increasing the mold temperature, the fitted curve obtained using eqn (3) deviates aggressively from the experimental values, in which the bubbles appear in two-stage nucleation. Therefore, eqn (3) is no longer a good expression of secondary bubble formation when the number of secondary bubbles is significantly increased. Eqn (3) was amended as follows:
 | (4) |
| B = b × N1 | (5) |
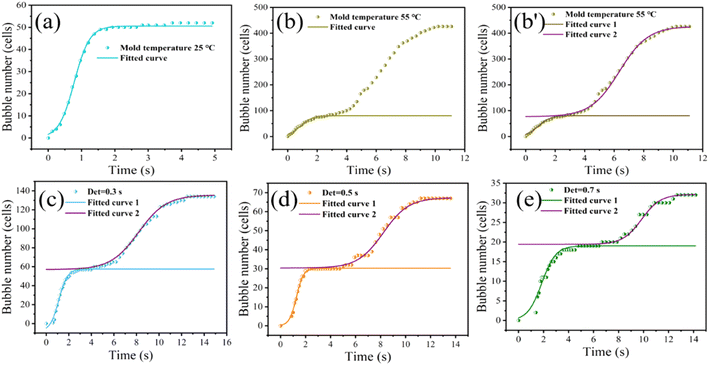 | ||
| Fig. 7 Fitting curve of the relationship between bubble number and time under different foaming conditions: (a) 25 °C, (b and b') 55 °C, (c) det = 0.3 s, (d) det = 0.5 s, and (e) det = 0.7 s. | ||
The parameters of the bubble nucleation simulation of PP at different mold temperatures are listed in Table 2. It shows that increasing the mold temperature is beneficial to reducing the Gibbs free energy ΔG2 of the secondary bubbles, resulting in an increasing number of secondary bubbles. A smaller value of “b” indicates that the number of secondary bubbles increased, as shown in Fig. 6. The results evidence that the synergistic effect of mold temperature and pressure drop can well control the formation of secondary bubbles.
| Mold temperature | Fitted curve | ΔG (kJ) | n | τ | b |
|---|---|---|---|---|---|
| 25 °C | — | 40.686 | 4.334 | 0.782 | 0 |
| 55 °C | 1 | 37.531 | 2.419 | 0.84 | 0.001 |
| 2 | 27.531 | 1.031 | 6.351 | −0.038 |
To further demonstrate the validity of the model, the nucleation curves of bubbles at different mold opening times were simulated and then compared with the measured data. The choice of mold opening time will affect the temperature of the polymer melt in the mold cavity and thus further affect the nucleation of the bubbles. Fig. 6(c)–(e) show the secondary bubble morphology for different mold opening times at 55 °C mold temperature. Based on the results shown in Fig. 6(c)–(e), the nucleation process of the secondary bubbles was simulated by using eqn (4), as illustrated in Fig. 7(c)–(e). It can be seen that the fitted curve 1 gradually changes from “semi-S-shaped” to “S-shaped”, and the fitted curve 2 of the secondary bubble nucleation is “S-shaped”. The deviation of a few points in curve 2 indicates that secondary bubbles also induce tertiary bubble formation.
The parameters of the bubble nucleation simulation of PP at different mold opening times are listed in Table 3. It can be seen that ΔG1 is always smaller than ΔG2 before the mold opening time of 0.5 s, which indicates that the ΔG overcome by the secondary bubble nucleation is still lower than that of the first batch of bubbles at this time. The small and large values of “b” indicate that the number of secondary bubbles formed is more and less, which is consistent with the results shown in Fig. 6. The above experimental results further demonstrate the reasonableness of the correction to the model formulation.
| Det (s) | Fitted curve | ΔG (kJ) | n | τ | b |
|---|---|---|---|---|---|
| 0.3 | 1 | 38.928 | 2.613 | 1.118 | 0.004 |
| 2 | 37.686 | 0.913 | 8.186 | −0.028 | |
| 0.5 | 1 | 44.176 | 3.531 | 1.27 | 0 |
| 2 | 43.018 | 0.982 | 8.213 | −0.015 | |
| 0.7 | 1 | 47.334 | 1.78 | 1.858 | 0 |
| 2 | 50.064 | 1.328 | 9.848 | −0.009 |
4.4 Controllable preparation of bimodal bubbles
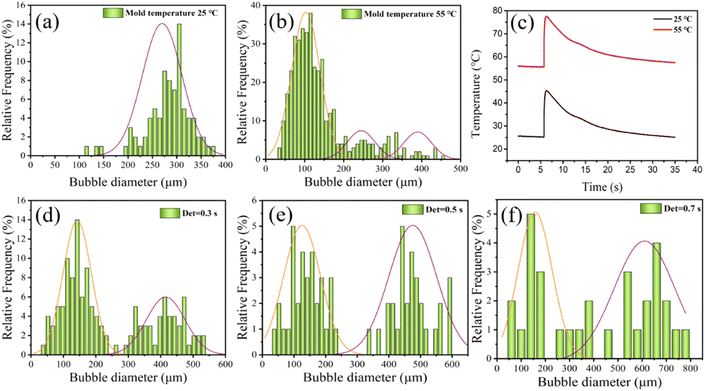
In an effort to control the formation of secondary bubbles by adjusting the foaming process, the mold temperature and mold opening time were used to regulate the temperature field of MOFIM. According to the data analysis in Section 4.3, bimodal bubbles can be obtained by changing the mode temperature of MOFIM to control the distribution and quantity of secondary bubbles. Fig. 8(a), (b), (d)–(f) show the diameter distribution of bubbles located at a5, b5, c5, d5 and e5 in Fig. 6 under different mold temperature and mold opening time conditions, respectively. It can be seen from Fig. 8(a) and (b) that the phenomenon of a multi-peak bubble structure is more obvious with the increase of mold temperature. The large bubble size distribution hardly changes and the number of bubbles decreases, while the small bubble size distribution gradually changes from a “narrow-less” type to a “wide-more” type. Meanwhile, Fig. 8(b) shows a three-peaked bubble structure, which is due to the expansion of the already-nucleated bubbles triggering the formation of secondary bubbles around them. Subsequently, the expansion of the secondary bubbles also induces the formation of tertiary bubbles around them.30 As shown in Fig. 8(c), the melt in the cavity cools more quickly because of the lower mold temperature, which also increases bubble nucleation resistance. Furthermore, the pressure drop caused by shrinkage during cooling is too small to induce the growth of bubble nuclei.36 In contrast, the cooling rate of the melt in the mold cavity becomes slower with the increase of mold temperature, which reduces the resistance of bubble nucleation. At this moment, there is just enough residual gas in the polymer melt, and the pressure drop caused by the cooling and shrinkage of the melt is just large enough, which induces the secondary growth of the bubble nuclei to form the bimodal bubble structure. Consequently, through the synergistic effect of mold temperature and pressure drop, a route can be provided for obtaining bimodal bubble structure foams by injection foaming.Additionally, it can be seen in Fig. 8(d)–(f) that the increase of PP foaming mold opening time makes the phenomenon of bimodal bubble structure formation not significant, which is consistent with Fig. 6. The large bubble size distribution gradually becomes wider, while the size distribution of small bubbles changes from “narrow-many” to “broad-few” and “narrow-few”. As a consequence, a delay within a specific time window prevents the formation of secondary bubbles and decreases the number of secondary bubbles. If the mold opening time is long enough, the viscosity of the polymer system will gradually increase, and bubble nucleation will become more difficult, so a completely non-foaming sample can be obtained (Fig. S4†).
5 Conclusions
In summary, the nucleation and growth of bubbles were observed based on open-mold injection foaming and free-foaming polypropylene foam systems with visualization equipment. The effects of blowing agent, melt temperature, nucleating agent and mold cavity temperature fields on secondary bubble nucleation were investigated. The results show that the bubble nucleation model applied as a judgment for the appearance of secondary bubbles indicates that there are no secondary bubbles in FREEF, and the secondary bubbles in MOFIM were generated from the late stage of equilibrium foaming until the bubble number stabilized. Moreover, the appearance of secondary bubbles was shown to arise due to a combination of multiple mechanisms by using glass fibers as a nucleating agent and tracer. Furthermore, the number of secondary bubbles increased with the increase of mold temperature and a modified prediction model of secondary bubbles was accordingly established. At this time, the nucleation curves of the secondary bubbles were fitted to an “S type”. Finally, the synergistic effect of mold temperature and pressure drop was proposed to obtain a bimodal bubble structure in the open mold injection foam. This work has enriched our understanding of the secondary bubble formation process, and provides a basis for acquiring structural materials with a more uniform cell size via process control.Author contributions
Jinfu Xing: conceptualization, investigation, formal analysis, writing—original draft. Bujin Liu: funding acquisition, investigation, validation. Tuanhui Jiang: conceptualization, investigation, formal analysis. Xiangbu Zeng: conceptualization, formal analysis. Jingkui Yang: investigation, validation, formal analysis. Yujing You: validation, formal analysis. Chun Zhang: investigation, validation. Wei Gong: funding acquisition, project administration, investigation, validation. Li He: funding acquisition, formal analysis, supervision, methodology, conceptualization.Conflicts of interest
There are no conflicts to declare.Acknowledgements
The authors are grateful to the Thousand Level Innovative Talents Project of Guizhou Province (No. GCC [2022]045), National Natural Science Foundation of China (No. 51863003, No. 52063008), Natural Science Foundation Funding Projects of Guizhou Province (No. ZK [2021]050), Research Institute Service Enterprise Action Plan Project of Guizhou Province (No. [2018]4010) and the Hundred Talents Project of Guizhou Province (No. [2016]5673) for their financial support of this work.Notes and references
- D. Feng, L. Li and Q. Wang, RSC Adv., 2019, 9, 4072–4081 RSC.
- M. Li, S. Li, B. Liu, T. Jiang, D. Zhang, L. Cao, L. He and W. Gong, RSC Adv., 2021, 11, 32799–32809 RSC.
- Z. Li, Y. Jia and S. Bai, RSC Adv., 2018, 8, 2880–2886 RSC.
- F. Wu, Y. Li, X. Lan, P. Huang, Y. Chong, H. Luo, B. Shen and W. Zheng, Compos. Commun., 2020, 20, 100358 CrossRef.
- G. Wang, J. Zhao, C. Ge, G. Zhao and C. B. Park, J. Mater. Chem. C, 2021, 9, 1245–1258 RSC.
- V. Bernardo, J. Martin-de Leon, J. Pinto, R. Verdejo and M. A. Rodriguez-Perez, Polymer, 2019, 160, 126–137 CrossRef CAS.
- M. Wu, F. Wu, Q. Ren, Z. Weng, H. Luo, L. Wang and W. Zheng, J. Appl. Polym. Sci., 2021, 138, 51370 CrossRef CAS.
- E. Ernault, J. Diani, S. Hallais and C. Cocquet, Polym. Eng. Sci., 2021, 61, 1971–1981 CrossRef CAS.
- A. Ameli, Y. Kazemi, S. Wang, C. B. Park and P. Pötschke, Composites, Part A, 2017, 96, 28–36 CrossRef CAS.
- R. J. Albalak, Z. Tadmor and Y. Talmon, AIChE J., 1990, 36, 1313–1320 CrossRef CAS.
- A. L. Yarin, D. Lastochkin, Y. Talmon and Z. Tadmor, AIChE J., 1999, 45, 2590–2605 CrossRef CAS.
- L. Chen and X. Wang, Rich Straff,Kent Blizard, Polym. Eng. Sci., 2002, 42, 1151–1158 CrossRef CAS.
- A. Wong, R. K. M. Chu, S. N. Leung, C. B. Park and J. H. Zong, Chem. Eng. Sci., 2011, 66, 55–63 CrossRef CAS.
- X.-F. Peng, L.-Y. Liu, B.-Y. Chen, H.-Y. Mi and X. Jing, Polym. Test., 2016, 52, 225–233 CrossRef CAS.
- V. Shaayegan, G. Wang and C. B. Park, Chem. Eng. Sci., 2016, 155, 27–37 CrossRef CAS.
- V. Shaayegan, G. Wang and C. B. Park, Eur. Polym. J., 2016, 76, 2–13 CrossRef CAS.
- S. G. Mosanenzadeh, H. E. Naguib and C. B. Park, et al., J. Appl. Polym. Sci., 2014, 131(7) DOI:10.1002/app.39518.
- P. Gong, G. Wang, M.-P. Tran, P. Buahom, S. Zhai, G. Li and C. B. Park, Carbon, 2017, 120, 1–10 CrossRef CAS.
- C. Li, L. F. Feng and X. P. Gu, et al., J. Supercrit. Fluids, 2018, 135, 8–16 CrossRef CAS.
- L.-Q. Xu and H.-X. Huang, J. Supercrit. Fluids, 2016, 109, 177–185 CrossRef CAS.
- A. Ameli, D. Jahani, M. Nofar, P. U. Jung and C. B. Park, Compos. Sci. Technol., 2014, 90, 88–95 CrossRef CAS.
- A. Ameli, M. Nofar, D. Jahani, G. Rizvi and C. B. Park, Chem. Eng. J., 2015, 262, 78–87 CrossRef CAS.
- J. Zhao, Y. Qiao, G. Wang, C. Wang and C. B. Park, Mater. Des., 2020, 195, 109051 CrossRef CAS.
- S. N. Leung, A. Wong, Q. Guo, C. B. Park and J. H. Zong, Chem. Eng. Sci., 2009, 64, 4899–4907 CrossRef CAS.
- C. B. P. Anson Wong, ASME Int. Mech. Eng. Congr. Expo., 2015, 57588, V015T019A026 Search PubMed.
- W. Ding, D. Jahani, E. Chang, A. Alemdar, C. B. Park and M. Sain, Composites, Part A, 2016, 83, 130–139 CrossRef CAS.
- J. Yang, T. Jiang, B. Liu, C. Zhang, X. Zeng, L. He and W. Gong, Mater. Des., 2021, 203, 109577 CrossRef CAS.
- W. Gong, L. He, J. Gao, J. Yu and Y. He, J. Chongqing Univ., 2009, 32, 181–186 CAS.
- B. Liu, T. Jiang, X. Zeng, R. Deng, J. Gu, W. Gong and L. He, Polym. Adv. Technol., 2021, 32, 2102–2117 CrossRef CAS.
- S. N. Leung, A. Wong, L. C. Wang and C. B. Park, J. Supercrit. Fluids, 2012, 63, 187–198 CrossRef CAS.
- S. Wu, L. He, C. Zhang, W. Gong, Y. He and Y. Luo, Polym. Test., 2017, 63, 367–374 CrossRef CAS.
- S. Wu, L. He, C. Zhang, W. Gong, T. Jiang and X. Zhang, Mater. Res. Express., 2018, 6, 025309 CrossRef.
- S. N. L. C. Wang, M. Bussmann*, W. T. Zhai and C. B. Park, Ind. Eng. Chem. Res., 2010, 49, 12783–12792 CrossRef.
- W. Gong, D. Wang, T. Jiang, X. Zeng, C. Zhang and L. He, J. Mater. Res. Technol., 2021, 13, 2260–2271 CrossRef CAS.
- B. Liu, T. Jiang, X. Zeng, J. Yang, D. Zhang, L. Cao, M. Li, C. Zhang, W. Gong and L. He, Polymer, 2022, 256, 125198 CrossRef CAS.
- G. Wang, G. Zhao, G. Dong, L. Song and C. B. Park, J. Mater. Chem. C, 2018, 6, 12294–12305 RSC.
Footnote |
| † Electronic supplementary information (ESI) available. See DOI: https://doi.org/10.1039/d2ra06702a |
| This journal is © The Royal Society of Chemistry 2023 |

