 Open Access Article
Creative Commons Attribution 3.0 Unported Licence
Stability of mesoporous silica using ricinoleic methyl ester as a template with the addition of HCl and application of Cd2+ adsorption optimized by Box–Behnken design
Andriayani *a,
Marpongahtuna,
Yugia Muisa,
Jessica Pakpahanb and
Amru Daulay
 c
c
aDepartment of Chemistry, Faculty of Mathematics and Natural Sciences, Universitas Sumatera Utara, Jl. Bioteknologi No. 1, Medan, 20155, Indonesia. E-mail: andriayani@usu.ac.id
bGraduate School, Department of Chemistry, Faculty of Mathematics and Natural Sciences, Universitas Sumatera Utara, Jl. Bioteknologi No. 1, Medan, 20155, Indonesia
cPostgraduate School, Department of Chemistry, Faculty of Mathematics and Natural Sciences, Universitas Sumatera Utara, Jl. Bioteknologi No. 1, Medan, 20155, Indonesia
First published on 6th March 2023
Abstract
Mesoporous silica is restricted to organic solvents or other acidic media. The application of mesoporous silica depends on the medium's chemical stability and mechanical properties. It is necessary to stabilize the mesoporous silica material under acidic conditions. The results of the nitrogen adsorption characterization show that MS-50 has a large surface area and porosity, resulting in good mesoporous silica. Using variance analysis (ANOVA) to compare the collected data, the best conditions were found at a pH of 6.32, a Cd2+ concentration of 25.30 ppm, an adsorbent dose of 0.06 g, and a time of 70.44 min. The Cd2+ adsorption experiment data best fit the Langmuir isotherm model with the maximum amount of Cd2+ that MS-50 could absorb being 103.10 mg g−1.
1. Introduction
Mesoporous silica is used in many applications, such as catalysis,1 drug delivery,2 sensing,3 and optics.4 It is also used in ion separation,5 environmental applications,6 metallurgy,7 and nuclear applications.8 The studied mesopores are ligands that extract heavy metals from waste fluxes.9Mesoporous silica synthesis can be used in two pathways: forming the cooperative self-assembly and liquid-crystal template processes.10 This synthesis process is based on the interaction between organic templates (surfactants in the liquid crystal structure and inorganic precursors) such as silica, which forms stable mesoporous silica.11 Applying high temperatures and chemicals to the template produces mesoporous silica with a small, well-organized pore structure. The obtained mesoporous silica has a high surface area, which is excellent for various applications. However, mesoporous silica has fragile pores that are not durable.12
Heavy metal pollution has become a major environmental problem threatening the environment and public health. The heavy metals pollute the soil, water, and air. It also can quickly get into the food chain and cause long-term, toxic effects on living organisms. One of the adsorption method that have been used to remove Cd2+ effectively is because it is simple, effective, and cheap.13 Cd2+ in water can be removed with adsorption materials, such as activated carbon14 and clays.15 However, these materials are not good at removing Cd2+ because they have low pore volume and a poor pore structure.
The porosity of a material affects its physical qualities, such as density, the conductivity of heat, and strength, due to its regular pore structure, high surface area, and consistent pore size distribution.16 Hybrid materials are formed when mesoporous silica materials are combined with organosilane due to its broad applicability in various disciplines. Inorganic and organic building components are dispersed on the nanoscale in hybrid materials, and serve as an adsorbent.17
Response surface methodology (RSM) is a method that looks at the relationship between some independent factors and some dependent responses.18 The most common designs in RSM are the Central-Composite Design (CCD) and the Box–Behnken design (BBD).19 In RSM, BBD is thought to be an efficient option. In different studies, BBD has been used to find the best conditions for the desired results.20 BBD was used to study the simultaneous effects of the independent variables on the removal of Cd2+ (as the dependent variable) to find the optimum conditions for Cd2+ removal from aqueous solutions.
Mesoporous silica is restricted to organic solvents or other acidic media. However, synthesis of mesoporous silica in ion separation (in environmental or hydrometallurgical ore separation processes), the treats are often acidic or even very acidic. The application of mesoporous silica in this field highly depends on the medium's chemical stability and mechanical properties.21 In previous studies, mesoporous silica was synthesized using ricinoleic methyl ester as a template. This study synthesized mesoporous silica with variation methanol to obtain the best mesoporous silica. This study showed that methanol at 18 g and HCl at 45 mL were able to obtain mesoporous silica with a BET surface area of 163.71 m2 g−1, a pore size of 12 nm, and was also able to adsorb Cu2+ with a removal percentage of 82.36%.22 In this study, synthesized mesoporous silica using an organic solvent, ricinoleic methyl ester, as a template was carried out by adding 18 g of methanol and varying HCl volumes of 20 mL, 30 mL, 40 mL, and 50 mL to increase the mesoporous silica's stability and application with adsorption of Cd2+ optimized by the Box–Behnken design.
2. Experimental section
2.1. Materials
Hydrochloric acid (HCl 37 wt%), 3-aminopropyltrimethoxysilane (APMS), methanol (CH3OH 98 wt%), and tetraethylorthosilicate (TEOS, 98%) were purchased from Sigma-Aldrich, and deionized water (DI) was obtained from PT Sumber Aneka Karya Abadi. Methyl ester ricinoleic acid (C19H36O3) was obtained from Ricinus communis.2.2. Synthesis mesoporous silica
In two neck flasks, 0.0145 mol of methyl ester ricinoleic acid was added to 100 mL of DI water, stirring for 30 min (mixture A). Then, a mixture of 0.0058 mol APMS, 0.028 mL of TEOS, 18 g of methanol, and x mL HCl (x = 20 mL, 30 mL, 40 mL, and 50 mL), was stirred for 10 min (mixture B). Then, mixture A and mixture B were stirred for 2 h. Then, the mixtures were heated in an oven at 80 °C for 72 h to form a porous solid. The product was separated and dried at 50 °C. The resulting solid was calcined at 550 °C for 6 h to remove the organic impurity. Five samples were named MS-20, MS-30, MS-40, and MS-50, where the numbers 20, 30, 40, and 50 refer to the volume of HCl.2.3. Characterization
Functional groups were characterized using Fourier-transform infrared spectroscopy (FTIR) (Shimadzu) with a KBr pellet technique. The porous material was characterized by adsorption–desorption at a temperature of 77 K using a Quantachrome instrument. Prior to characterization, samples were evacuated at 350 °C for 4 h. Nitrogen adsorption was used to measure: (i) the specific surface area using the Brunauer–Emmet–Teller (BET) method; (ii) the surface area was calculated using the t-plot method by subtracting the surface area of BET with the surface area, and the outer surface could be identified; and (iii) the pore size using the Barret–Joyner and Halenda (BJH) method was accurate with a cylindrical structure and cubic structure. Phase analysis of the material by X-ray diffraction (XRD) was recorded with Cu Kα (λ = 0.15406 nm) using a 2θ range of 10°–90°. The morphology was investigated by scanning electron microscope (SEM) using SEM JED-2300, Jeol.2.4. Optimization of the adsorption process
The current work is focused on a four-level Box–Behnken design (BBD) in response surface methodology (RSM) to optimize the % removal of Cd2+, solution pH, adsorbent dose, concentration, and times. Statistical analysis software [Design expert software version 13] was used to determine how important every single factor, interaction, and quadratic term was in the optimization process. Table 1 shows the factorial design.| Factor | Levels | Description | ||
|---|---|---|---|---|
| High (+1) | Central (0) | Low (−1) | ||
| A | 2 | 5.5 | 9 | A: pH |
| B | 0.05 | 0.1 | 0.15 | B: dose (g) |
| C | 20 | 50 | 80 | C: concentration (ppm) |
| D | 30 | 60 | 90 | D: time (min) |
In this study, 27 experiments were conducted to determine how the four main independent factors affected the efficiency and effectiveness of the removal. A non-linear regression method was used to fit the second-order polynomial to the experimental data and determine the important model terms.
The design included 27 experiments to find the best independent factors levels. This study investigated four factors in the laboratory. Each was chosen as an independent variable with three levels: pH (A, 2–9), adsorbent dose (B, 0.05–0.15 g), Cd2+ ions concentration (C, 20–80 ppm), and contact time (D, 30–90 min). The parameter in the regression equation was studied, and variance analysis (ANOVA) was used to find most important parameters in the model. Mesoporous silica was used for the adsorption experiments under different process conditions, such as pH, adsorbent dose, process time, and concentration of Cd2+. The concentrations of Cd2+ were determined before and after adsorption using atomic absorption spectroscopy (AAS, iCE 3300). Once the Cd2+ concentration was known, eqn (1) was used to estimate the equilibrium amount adsorbed (mg g−1), and eqn (2) was used to estimate the removal percentage (%) calculated as,
 | (1) |
 | (2) |
In the above equations, C0 (ppm) is the initial concentration of Cd2+, and Ce (ppm) is the final concentration of Cd2+. The adsorption capacity (qe) is the amount of Cd2+ adsorbed per unit mass of the mesoporous silica (mg g−1). V is the volume of the solution (L), and M is the mass of the mesoporous silica (g). The schematic illustration of mesoporous silica and Cd2+ adsorption can be seen in Fig. 1. The actual BBD experimental design matrix is shown in Table 2.
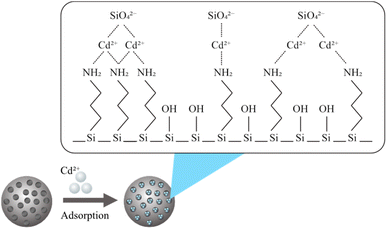 | ||
| Fig. 1 Illustration of Cd2+ adsorption by mesoporous silica.22 | ||
| Run | pH | Dose (g) | Concentration (ppm) | Time (min) | Removal predicted (%) | Removal actual (%) |
|---|---|---|---|---|---|---|
| 1 | 10 | 0.15 | 50 | 60 | 83.61 | 82.42 |
| 2 | 5.5 | 0.15 | 50 | 30 | 75.02 | 75.17 |
| 3 | 10 | 0.05 | 50 | 60 | 81.00 | 79.82 |
| 4 | 5.5 | 0.1 | 50 | 60 | 83.26 | 82.91 |
| 5 | 5.5 | 0.15 | 50 | 90 | 87.37 | 88.25 |
| 6 | 5.5 | 0.1 | 50 | 60 | 83.26 | 84.92 |
| 7 | 5.5 | 0.1 | 20 | 90 | 90.09 | 89.82 |
| 8 | 5.5 | 0.1 | 50 | 60 | 83.26 | 81.96 |
| 9 | 5.5 | 0.15 | 20 | 60 | 76.81 | 76.85 |
| 10 | 5.5 | 0.1 | 20 | 30 | 76.94 | 76.82 |
| 11 | 5.5 | 0.05 | 80 | 60 | 85.91 | 85.73 |
| 12 | 5.5 | 0.1 | 80 | 90 | 94.79 | 93.91 |
| 13 | 1 | 0.1 | 20 | 60 | 78.83 | 78.89 |
| 14 | 1 | 0.1 | 50 | 30 | 80.10 | 79.82 |
| 15 | 10 | 0.1 | 20 | 60 | 85.21 | 85.64 |
| 16 | 1 | 0.15 | 50 | 60 | 75.78 | 75.96 |
| 17 | 5.5 | 0.15 | 80 | 60 | 84.48 | 84.45 |
| 18 | 5.5 | 0.05 | 50 | 30 | 78.63 | 78.92 |
| 19 | 10 | 0.1 | 50 | 30 | 77.23 | 77.95 |
| 20 | 5.5 | 0.05 | 20 | 60 | 83.55 | 83.44 |
| 21 | 1 | 0.05 | 50 | 60 | 86.56 | 86.75 |
| 22 | 1 | 0.1 | 50 | 90 | 88.93 | 88.08 |
| 23 | 5.5 | 0.1 | 80 | 30 | 82.28 | 81.55 |
| 24 | 10 | 0.1 | 80 | 60 | 84.97 | 86.08 |
| 25 | 10 | 0.1 | 50 | 90 | 94.06 | 94.21 |
| 26 | 1 | 0.1 | 80 | 60 | 89.10 | 89.84 |
| 27 | 5.5 | 0.05 | 50 | 90 | 91.93 | 92.95 |
3. Results and discussions
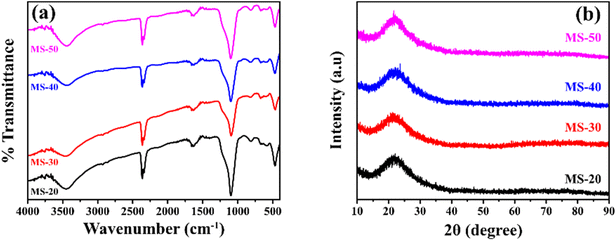
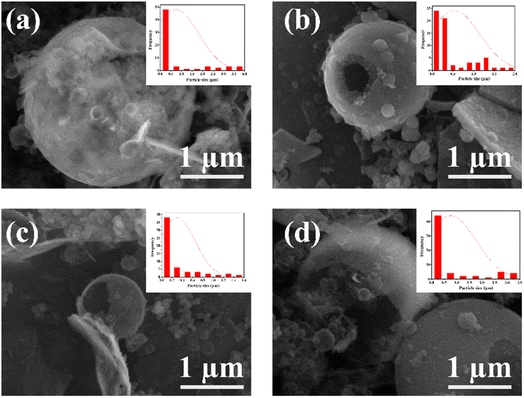
Mesoporous silica was synthesized using ricinoleic methyl ester as a template with the addition of varying amounts of HCl. Ricinoleic methyl was used as a template based on the literature.16,22 The seed Ricinus communis extracts castor oil.23 Castor oil is unusual among vegetable oils because it is the sole source of hydroxylated fatty acids.24 Castor oil is extracted from the castor plant by pressing or solvent extraction, forming methyl ester when vegetable oils or animal fats combine with alcohol in a chemical reaction.25 Methanol and ethanol are the most used alcohols. Ricinoleic methyl ester in its carbon chain has a double bond, a hydroxyl group, and a carboxylate group that can affect the formation of micellar aggregates. It can affect the porous properties of the obtained mesoporous silica material. Some conditions that can affect the regularity of the pores include pH, the ratio of the components of the reaction mixture, solvent, and temperature. The degree of surfactant ionization, which is the ratio of the molar charge to the total surfactant, can change with the addition of acid because the pH value will affect the charge density of micelles and can result in different template arrangements.26 The addition of acid can also affect the hydrolysis and condensation reactions of the silicate material because the addition of acid causes the oxygen atom of the silanol group and the siloxy group to be protonated rapidly, and release alcohol and water.27 Other reaction conditions, such as timing the addition of silicate components (for example, by delaying the addition of TEOS), will also be carried out. By timing the addition, it will give time for interaction between the amine group of APMS and the charge of the head group of the template, which can affect the formation of pores. Nikolic et al. researched silica synthesis's effect and the silicate's mixing time with TEOS. The results show that the right time can produce the best silica. In this study, the time obtained was around 7 min.28 Likewise, Alfawaz et al. studied the right time to add alcohol to the synthesis of mesoporous silica. The correct time was around 20 min.29 Another factor that can affect the formation of mesostructured pores is the addition of alcohol since alcohol can function as a co-solvent, increasing the reaction mixture's polarity.30 The synthesis of mesoporous silica with the addition of HCl can change the density of the template ricinoleic methyl ester and APMS. Adding HCl can release methyl ions from ricinoleic methyl ester to COO−, while protonating the amine group from APMS to NH3+. There is then an effective interaction between COO− with NH3+, which will determine the nature of the pores in the silica material.The FTIR spectra can be seen in Fig. 2a. All products of mesoporous silica showed an absorption peak between 3433 cm−1 to 3447 cm−1 that was widened due to OH (Si–OH).31 The other absorption peaks at 1089 cm−1 to 1118 cm−1 are strong due to the asymmetric stretching of Si–O–Si (υas Si–O–Si),32 and the features at 808 cm−1 to 836 cm−1 are due to the presence of symmetrical groups Si–O–Si (υis Si–O–Si).33 The features in the wavenumber range of 456–471 cm−1 is due to Si–O. In addition to the characteristic H–OH water twisting band at 1600 cm−1 and 2400 cm−1.34 The functional group has no significantly different FTIR spectral features from MS-20 to MS-50. The frequency of the characteristic peak of Si–O changed when Cd was added. The covalent radius of Si is 116 pm and the covalent radius of cadmium is 148 pm. If Cd ions were to enter the Si–O tetrahedron, the vibration would be harder because the covalent radius of Cd is larger than that of Si. It showed that Cd2+ could bind with Si–O, and proved that silicic acid or polysilicic acid and Cd could form a water–soluble complex.35 The XRD diffractogram can be seen in Fig. 2b at an angle of 2θ between 10° to 30°, showing that all shapes are equal to the broad peak (broad), and the diffractogram peak is at 24.0°, which indicates that the mesoporous silica is amorphous.36,37 There is no significant difference in the XRD diffractograms of MS-20 to MS-50. SEM images of MS-20 (Fig. 3a), MS-30 (Fig. 3b), and MS-40 (Fig. 3c) showed a particle shape in the form of a mixture consisting of dispersed round plate particles (such as coins) of small size, and some formed agglomerations. Other particles in the form of spherical spheres,38,39 which are dispersed with a larger size, have thin skin so that they are easily broken. MS-20 also has plate particles in thicker and irregular shapes. MS-30 and MS-40, with a larger spherical shape, has a better shape. Some particles have damage to their skin, resulting in a hole pore. This condition shows that spherical particles with a larger size have a thicker plate. The skin thickness of the spherical particles is thicker than the size of the skin in the particles of MS-20. MS-40 has a spherical particle shape with a larger size, and has a thin skin so that it is easily damaged, and there are particles in the form of a thicker plate with a large size. MS-50 (Fig. 3d) has particles that are dominated by small round plate particles, some of which are dispersed and some forming agglomerations. Other particles are in the form of spherical shapes with a larger size and have thin skin that is easily damaged. Particle sizes for MS-20, MS-30, MS-40, and MS-50 were dominated by 0.77 μm, 0.65 μm, 0.51 μm, and 0.49 μm, respectively. It shows the size of the particles in the form of micropores. Furthermore, it shows that upon the increasing addition of HCl, smaller particle sizes were obtained. Based on the amorphous XRD diffractogram and spherical SEM images, the resulting mesoporous silica is similar to SBA 15, as it is known that the SBA 15 diffractogram is amorphous40 and the SEM images are spherical.41
N2 adsorption characterization using t-plot, BET surface area and BJH pore volume can be seen in Fig. 4. The t-plot from BET in Fig. 4a shows the R2 of MS-20, MS-30, MS-40, and MS-50 at up to 0.99. The BET surface area in Fig. 4b shows hysteresis at high relative pressure values with large pores. The BET surface area of MS-20 was 46.23 m2 g−1, whereas that of MS-30 was 24.30 m2 g−1, MS-40 was 16.55 m2 g−1, and MS-50 was 250.78 m2 g−1. The BJH pore volume is presented in Fig. 4c. The results of the pore sizes of MS-40 and MS-50 are 14.32 nm and 6.01 nm, respectively, and can be called mesoporous silica. Ijaz et al. also conducted experiments regarding the synthesis of mesoporous silica with varying amounts of HCl. If HCl is given in small amounts, it produces few pores and forms a large surface area. However, if HCl is given in large quantities, it will give a large pore, but a small surface area. The appropriate addition of HCl will provide a large surface area coupled with a large position, making it very suitable to form mesoporous silica.42 Oo et al. performed experiments on synthesizing mesoporous silica with the addition of HCl with the optimization of the RSM method. It was found that the administration of HCl impacted the resulting surface area and pore size. Applying HCl in the right amount can produce mesoporous silica material with optimal surface area and pore size.43 Zhang et al. investigated the stability of mesoporous silica with varying amounts of lauric acid. It was found that producing mesoporous silica with high porosity and large surface area requires the right amount of lauric acid. The addition of too little lauric acid will result in small pores. If too much is added, it will result in large pores.44 In the end, this research focused on variations in pH, especially the addition of HCl in the synthesis of mesoporous silica. The addition of the right pH conditions will produce mesoporous silica with high porosity and a large surface area. However, solvent, temperature, and cooling time variations were not carried out. Zhou et al. performed the synthesis of mesoporous silica with temperature variations. The result is that the higher the temperature, the higher the pore will be obtained.45 Lee et al. synthesized mesoporous silica with various solvents. It was found that an acidic solvent will increase the pore and surface area, but a slightly alkaline solvent will shrink the surface area.46 Kang et al. performed the synthesis of mesoporous silica with cooling time. It was shown that the longer the cooling time, the larger the surface area and the larger the pores (Table 3).47
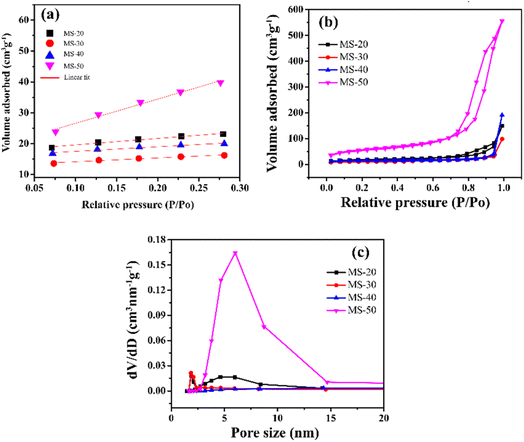 | ||
| Fig. 4 N2 adsorption by mesoporous silica: (a) t-plot, (b) Brunauer–Emmett–Teller (BET) and (c) Barrett–Joyner–Halenda (BJH). | ||
| Samples | BET surface area (m2 g−1) | Pore volume (cm3 g−1) | Pore size (nm) |
|---|---|---|---|
| MS-20 | 46.23 | 0.22 | 1.86 |
| MS-30 | 24.30 | 0.14 | 1.85 |
| MS-40 | 16.55 | 0.28 | 14.32 |
| MS-50 | 250.78 | 0.90 | 6.01 |
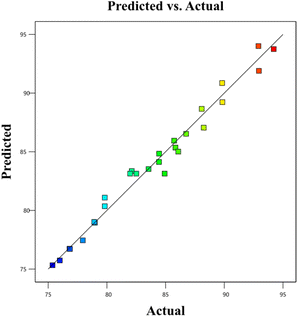
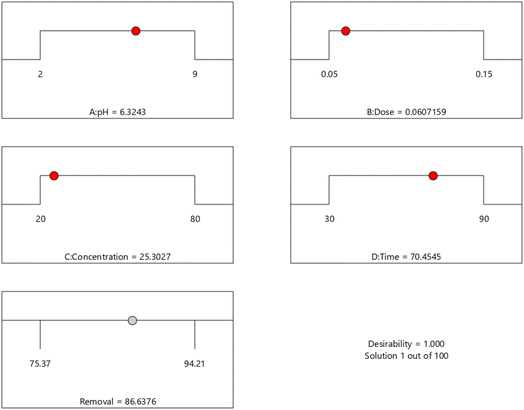
BBD planned a total of 27 experiments (Table 2). For the four factors that were examined, pH (A), adsorbent dose (B), Cd2+ ions concentration (C), and contact time (D) were studied as independent process factors, and their effects on the Cd2+ removal efficiency (the response) were studied using the BBD approach. The mathematical relationship between the response and the process factors was figured out using a quadratic polynomial model. The regression model for the response was tested for significance, and the results of ANOVA tests are shown in Table 4. Values of model terms Prob > F < 0.05 mean that factors are significant under certain conditions. Significant model terms for the response (Cd2+ removal) are A, B, C, A2, C2, AB, AC, and BC. It was found that pH (A) does not significantly affect the percentage of the Cd2+ removal efficiency. It is probably because the adsorption process is not as sensitive to changes in pH. ANOVA for response factors shows that the value of R-squared (determination coefficient) is 0.97, which is very high and shows a good relationship between the actual and predicted values, as shown in Fig. 5. The optimum conditions for the MS-50 to Cd2+ removal are effectively presented in Fig. 6. The calculations were done. The desirability value for Cd2+ showed that the maximum adsorption efficiency was 86.63% at the optimum conditions: contact time of 70.44 min, pH of 6.32, a dose of 0.06 g, and concentration of Cd2+ of 25.30 ppm. In the experiments, the initial pH and concentration of Cd2+ were changed to show how well Cd2+ was removed. The results showed that the pH of the solution has an essential effect on how well the process works (Fig. 7). The efficiency of Cd2+ adsorption decreases as the pH increases. This is caused by changes in the surface charges of the adsorbent and Cd2+ as a function of the pH. One of the most important things to consider is how the concentration of the ions at the beginning affects the process. With the initial concentration of the removal percentage, Cd2+ decreases. This can be explained by the fact that there are a limited number of active sites on the surface of the adsorbent, which are filled up after a particular optimum concentration.48 It is expected that this would happen because of a significant force. It happens because the concentration and solution of Cd2+ on the surface of the adsorbent are more significant when the initial concentration of Cd2+ is higher, and the amount of adsorbent is the same.49
| Source | Sum of squares | F-value | p-value | |
|---|---|---|---|---|
| Model | 743.33 | 39.42 | <0.0001 | Significant |
| A – pH | 3.59 | 2.66 | 0.1287 | |
| B – adsorbent | 54.53 | 40.49 | <0.0001 | |
| C – concentration | 74.05 | 54.99 | <0.0001 | |
| D – time | 453.75 | 336.92 | <0.0001 | |
| AB | 42.64 | 31.66 | 0.0001 | |
| AC | 28.20 | 20.94 | 0.0006 | |
| AD | 16.00 | 11.88 | 0.0048 | |
| BC | 9.95 | 7.39 | 0.0187 | |
| BD | 0.3306 | 0.2455 | 0.6292 | |
| CD | 3.31 | 2.46 | 0.1428 | |
| A2 | 0.0984 | 0.0731 | 0.7915 | |
| B2 | 13.55 | 10.06 | 0.0080 | |
| C2 | 9.93 | 7.37 | 0.0188 | |
| D2 | 16.94 | 12.58 | 0.0040 | |
| Residual | 16.16 | |||
| Lack of fit | 11.25 | 0.4582 | 0.8365 | Not significant |
| Pure error | 4.91 | 39.42 | ||
| Cor. total | 759.49 |
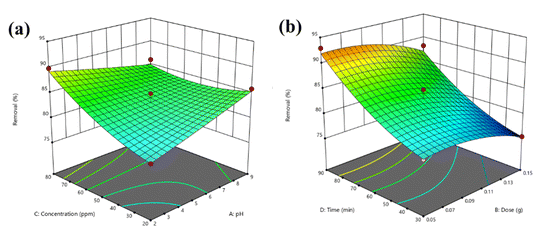 | ||
| Fig. 7 Response surfaces for the BBD of (a) pH – Cd2+ concentration and (b) adsorbent dosage – time. | ||
The isotherm equations for the Langmuir and Freundlich models have been tested in this study. The linear equations were used to fit the Cd2+ adsorption process on MS-50 presented in Fig. 8a and b, and the isotherm parameters are shown in Table 5. The Langmuir isotherm assumes a homogeneous adsorption process.13 The Langmuir equation is calculated as,
 | (3) |
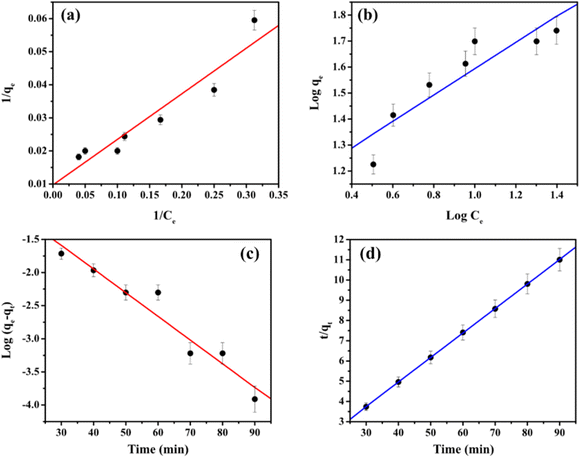 | ||
| Fig. 8 The adsorption of Cd2+ onto MS-50 of the (a) Langmuir and (b) Freundlich isotherm model. Kinetics plots for the removal of Cd2+ by MS-50 of (c) pseudo-first-order and (d) pseudo-second-order. | ||
| Langmuir | Freundlich | ||||
|---|---|---|---|---|---|
| qm (mg g−1) | KL | R2 | KF (mg g−1) | n | R2 |
| 103.10 | 0.07 | 0.90 | 12.22 | 1.97 | 0.83 |
| Pseudo-first-order | Pseudo-second-order | ||||
|---|---|---|---|---|---|
| qe (mg g−1) | k1 (min−1) | R2 | qe (mg g−1) | k2 (min−1) | R2 |
| 0.59 | 0.005 | 0.93 | 8.26 | 0.12 | 0.99 |
The Freundlich adsorption isotherm is an empirical equation employed to describe heterogeneous systems.50 The Langmuir equation is calculated as,
 | (4) |
![[thin space (1/6-em)]](https://www.rsc.org/images/entities/char_2009.gif) qe versus log
qe versus log![[thin space (1/6-em)]](https://www.rsc.org/images/entities/char_2009.gif) Ce.
Ce.
Results show that the Langmuir model is better than the Freundlich model in simulating the adsorption experiments. The adsorption isotherm of MSME-A suggests that the adsorption process is homogeneous. The maximum adsorption capacities for Cd2+ were 103.10 mg g−1. During the adsorption process, several parameters are related to the state of the adsorbent and the physicochemical state in which adsorption affects the kinetic reactions. The pseudo-first-order and pseudo-second-order kinetics models were used to determine that the adsorbent took up Cd2+. The linear equation pseudo-first-order is calculated as,51
ln(qe − qt) = ln![[thin space (1/6-em)]](https://www.rsc.org/images/entities/char_2009.gif) qe − k1t qe − k1t
| (5) |
The linear equation of pseudo-second-order is calculated as,
 | (6) |
The plots of the pseudo-first-order and pseudo-second-order for different initial Cd2+ concentrations are shown in Fig. 8c and d. The adsorption kinetics data and the predicted model parameters are shown in Table 5. Among these parameters, the correlation coefficient (R2) and the agreement between the calculated and experimental values of q are the most important. It is used to confirm that the models can be used. The excellent agreement between the calculated qe and the theoretical qe and the high values of R2 (R2 = 0.99) show that the pseudo-second-order kinetic model gives a good description of this adsorption process. This means that the limiting step for removal may be a chemisorption process.
A comparison between the adsorption capacities (qm) values of different adsorbents reported in the literature and that of MS-50 for adsorption of Cd2+ can be seen in Table 6. It may be seen that qm values differ widely for different adsorbents. Comparison of qm values also shows that MS-50 exhibited a reasonable capacity for adsorption of Cd2+ from aqueous solutions. Mesoporous silica Cd adsorption can be done repeatedly.
4. Conclusion
The stability of mesoporous silica using ricinoleic methyl ester as a template with the addition of HCl has been done. FT-IR results of all silica material products in all reaction conditions showed the formation of Si–OH, Si–O–Si, and Si–O. The XRD analysis results showed that all silica are amorphous. SEM images show that the mesoporous silica was spherical. The results of the nitrogen adsorption characterization show that MS-50 has a large surface area and porosity, resulting in good mesoporous silica. According to the final model equation for the coded factors, the pH, adsorbent dose, Cd2+ concentration, and contact time (in that order) had the most significant effect on the efficiency of the process. About 86.63% of the Cd2+ was taken out under the best conditions. Based on the isotherm studies, the Langmuir model was the best fit for the equilibrium data, and the maximum adsorption capacity was 103.10 mg g−1.Conflicts of interest
The authors state that they have no known conflicting financial or personal interests that might have influenced the work presented in this study.Acknowledgements
The research has been carried out under the financial support obtained from DRPM 2018 with contract number 231/UN5.2.3.1/PPM/KP-DRPM/2018.References
- Y. Wei, W. Yang and Z. Yang, Int. J. Hydrogen Energy, 2022, 47, 9537–9565 CrossRef CAS.
- M. Vallet-Regí, M. Colilla, I. Izquierdo-Barba and M. Manzano, Molecules, 2017, 23, 47 CrossRef PubMed.
- S. Y. Tan, C. Teh, C. Y. Ang, M. Li, P. Li, V. Korzh and Y. Zhao, Nanoscale, 2017, 9, 2253–2261 RSC.
- G. Wang and S. Sun, Appl. Opt., 2020, 59, 3933 CrossRef CAS PubMed.
- X. Xiang, J. Y. Wu, Q. X. Shi, Q. Xia, Z. G. Xue, X. L. Xie and Y. S. Ye, J. Mater. Chem. A, 2019, 7, 9110–9119 RSC.
- D. Thangadurai, V. Ahuja, J. Sangeetha, J. Naik, R. Hospet, M. David, A. K. Shettar, A. Torvi, S. C. Thimmappa and N. Pujari, in Handbook of Nanomaterials and Nanocomposites for Energy and Environmental Applications, Springer International Publishing, Cham, 2021, pp. 403–420 Search PubMed.
- F. Zeng, Q. Cai, X. Liu, Y. Yao, F. Zhuo, Q. Gao, Y. Xie and Y. Wang, J. Alloys Compd., 2017, 728, 413–423 CrossRef CAS.
- L. Pan and J. Shi, Chin. J. Chem., 2018, 36, 481–486 CrossRef CAS.
- A. A. Alotaibi, A. K. Shukla, M. H. Mrad, A. M. Alswieleh and K. M. Alotaibi, Membranes, 2021, 11, 935 CrossRef CAS PubMed.
- T. Asefa and V. Dubovoy, in Comprehensive Supramolecular Chemistry II, Elsevier, 2017, pp. 157–192 Search PubMed.
- S. Miri, V. S. Raghuwanshi, P. C. Andrews and W. Batchelor, Microporous Mesoporous Mater., 2021, 311, 110701 CrossRef CAS.
- W. Jia, J. Wang, L. Ma, S. Ren and S. Yang, J. Appl. Polym. Sci., 2020, 137, 48792 CrossRef CAS.
- W. Zhu, J. Wang, D. Wu, X. Li, Y. Luo, C. Han, W. Ma and S. He, Nanoscale Res. Lett., 2017, 12, 323 CrossRef PubMed.
- W.-S. Chen, Y.-C. Chen and C.-H. Lee, Processes, 2022, 10, 150 CrossRef CAS.
- S. Abd Hamid, M. Shahadat, B. Ballinger, S. Farhan Azha, S. Ismail, S. Wazed Ali and S. Ziauddin Ahammad, J. Saudi Chem. Soc., 2020, 24, 785–798 CrossRef CAS.
- A. Andriayani, H. Nainggolan, M. Taufik, S. Simamora and N. Sofyan, J. Phys.: Conf. Ser., 2018, 1116, 042006 CrossRef.
- V. B. Cashin, D. S. Eldridge, A. Yu and D. Zhao, Environ. Sci.: Water Res. Technol., 2018, 4, 110–128 RSC.
- K. Hasani, A. Peyghami, A. Moharrami, M. Vosoughi and A. Dargahi, Arabian J. Chem., 2020, 13, 6122–6139 CrossRef CAS.
- S. Afshin, Y. Rashtbari, M. Vosough, A. Dargahi, M. Fazlzadeh, A. Behzad and M. Yousefi, J. Water Process. Eng., 2021, 42, 102113 CrossRef.
- P. Archariyapanyakul, B. Pangkumhang, P. Khamdahsag and V. Taboonchuy, Sains Malays., 2017, 46, 655–665 CrossRef CAS.
- H. Aghayan, A. R. Khanchi, T. Yousefi and H. Ghasemi, J. Nucl. Mater., 2017, 496, 207–214 CrossRef CAS.
- A. Andriayani, M. Marpongahtun, S. Suharman and A. Daulay, Case Stud. Chem. Environ. Eng., 2023, 7, 100287 CrossRef CAS.
- R. H. Elkousy, Z. N. A. Said, M. A. Abd El-Baseer and S. A. Abu El wafa, J. Ethnopharmacol., 2021, 271, 113878 CrossRef CAS PubMed.
- S. Mukherjee and M. Ghosh, Carbohydr. Polym., 2017, 157, 1076–1084 CrossRef CAS PubMed.
- G. A. Smith, in Biobased Surfactants, Elsevier, 2019, pp. 287–301 Search PubMed.
- D. W. Hayward, L. Chiappisi, J. H. Teo, S. Prévost, R. Schweins and M. Gradzielski, Soft Matter, 2019, 15, 8611–8620 RSC.
- D. J. Belton, O. Deschaume and C. C. Perry, FEBS J., 2012, 279, 1710–1720 CrossRef CAS PubMed.
- M. Nikolic, R. Filipovic and S. Stanojevic-Nikolic, Process. Appl. Ceram., 2015, 9, 209–214 CrossRef CAS.
- A. Alfawaz, A. Alsalme, A. Alkathiri and A. Alswieleh, J. King Saud Univ., Sci., 2022, 34, 102106 CrossRef.
- S. Henkel, M. C. Misuraca, P. Troselj, J. Davidson and C. A. Hunter, Chem. Sci., 2018, 9, 88–99 RSC.
- A. Daulay, A. Andriayani, M. Marpongahtun and S. Gea, AIP Conf. Proc., 2021, 2342, 040001 CrossRef CAS.
- A. Daulay, A. Andriayani, M. Marpongahtun and S. Gea, Rasayan J. Chem., 2021, 14, 2125–2128 CrossRef CAS.
- G. Abu Rumman, T. J. Al-Musawi, M. Sillanpaa and D. Balarak, Environ. Nanotechnol., Monit. Manage., 2021, 16, 100536 CAS.
- P. K. Verma, A. Kundu, M. S. Puretz, C. Dhoonmoon, O. S. Chegwidden, C. H. Londergan and M. Cho, J. Phys. Chem. B, 2018, 122, 2587–2599 CrossRef CAS PubMed.
- Y. Zhao, M. Liu, L. Guo, D. Yang, N. He, B. Ying and Y. Wang, J. Soils Sediments, 2020, 20, 2343–2353 CrossRef CAS.
- P. E. Imoisili, K. O. Ukoba and T.-C. Jen, Bol. Soc. Esp. Ceram. Vidrio, 2020, 59, 159–164 CrossRef CAS.
- S. Calderon, T. Ribeiro, J. P. S. Farinha, C. Baleizão and P. J. Ferreira, Small, 2018, 14, 1802180 CrossRef PubMed.
- A. Daulay, A. Andriayani, M. Marpongahtun and S. Gea, S. Afr. J. Chem. Eng., 2022, 42, 32–41 Search PubMed.
- A. Daulay, A. Andriayani, M. Marpongahtun, S. Gea and T. Tamrin, S. Afr. J. Chem. Eng., 2022, 41, 203–210 Search PubMed.
- R. Thahir, A. W. Wahab, N. La Nafie and I. Raya, Open Chem., 2019, 17, 963–971 CAS.
- X. Sun, W. Yu, J. Yan, J. Li, G. Jin, J. Feng, Z. Guo and X. Liang, RSC Adv., 2018, 8, 27207–27215 RSC.
- A. Ijaz, M. B. Yagci, C. W. Ow-Yang, A. L. Demirel and A. Mikó, Microporous Mesoporous Mater., 2020, 303, 110240 CrossRef CAS.
- M. K. Oo, B. Alallam, A. A. Doolaanea, A. Khatib, F. Mohamed and B. Chatterjee, ACS Omega, 2022, 7, 27126–27134 CrossRef CAS PubMed.
- Z. Zhang, J. Wang, X. Tang, Y. Liu, Z. Han and Y. Chen, Sci. Rep., 2019, 9, 16056 CrossRef PubMed.
- B. Zhou, C. Y. Li, N. Qi, M. Jiang, B. Wang and Z. Q. Chen, Appl. Surf. Sci., 2018, 450, 31–37 CrossRef CAS.
- D.-W. Lee, M.-H. Jin, J.-H. Park, Y.-J. Lee, Y.-C. Choi, J. Chan Park and D. H. Chun, ACS Sustainable Chem. Eng., 2018, 6, 12241–12250 CrossRef CAS.
- M. Kang, J. Lee, M.-K. Kim, M. Byun and J.-Y. Bae, Micromachines, 2022, 13, 926 CrossRef PubMed.
- S. Mortazavian, A. Saber, J. Hong, J.-H. Bae, D. Chun, N. Wong, D. Gerrity, J. Batista, K. J. Kim and J. Moon, J. Ind. Eng. Chem., 2019, 69, 196–210 CrossRef CAS.
- M. Shirmardi, N. Alavi, E. C. Lima, A. Takdastan, A. H. Mahvi and A. A. Babaei, Process Saf. Environ. Prot., 2016, 103, 23–35 CrossRef CAS.
- L. Usgodaarachchi, C. Thambiliyagodage, R. Wijesekera and M. G. Bakker, Curr. Res. Green Sustainable Chem., 2021, 4, 100116 CrossRef CAS.
- M. Yousefi, M. Gholami, V. Oskoei, A. A. Mohammadi, M. Baziar and A. Esrafili, J. Environ. Chem. Eng., 2021, 9, 105677 CrossRef CAS.
- V. K. Gupta and A. Nayak, Chem. Eng. J., 2012, 180, 81–90 CrossRef CAS.
- N. M. Salem, A. M. Farhan and A. M. Awwad, Am. J. Environ. Sci., 2012, 2, 123–127 Search PubMed.
- H. Tounsadi, A. Khalidi, M. Abdennouri and N. Barka, J. Environ. Chem. Eng., 2015, 3, 822–830 CrossRef CAS.
- Y. Ding, D. Jing, H. Gong, L. Zhou and X. Yang, Bioresour. Technol., 2012, 114, 20–25 CrossRef CAS PubMed.
- N. Azouaou, Z. Sadaoui, A. Djaafri and H. Mokaddem, J. Hazard. Mater., 2010, 184, 126–134 CrossRef CAS PubMed.
- U. I. Gaya, E. Otene and A. H. Abdullah, SpringerPlus, 2015, 4, 458 CrossRef PubMed.
- L. H. Velazquez-Jimenez, A. Pavlick and J. R. Rangel-Mendez, Ind. Crops Prod., 2013, 43, 200–206 CrossRef CAS.
- H. S. Mohamed, N. K. Soliman, D. A. Abdelrheem, A. A. Ramadan, A. H. Elghandour and S. A. Ahmed, Heliyon, 2019, 5, e01287 CrossRef PubMed.
- W. Chen, H. Zhang, Y. Liang, H. Ding and S. Sun, Front. Chem., 2018, 6, 556 CrossRef CAS PubMed.
| This journal is © The Royal Society of Chemistry 2023 |

