 Open Access Article
The multifunctional Prussian blue/graphitic carbon nitride nanocomposites for fluorescence imaging-guided photothermal and photodynamic combination therapy†
Xinxu Wanga,
Chenghan Wanga,
Yichen Xub,
Yuxin Li a,
Haotian Lia,
Bingjun Fana,
Fan Yang*a and
Liping Li
 *a
*a
aShanxi Medical University, Taiyuan, 030001, China. E-mail: liliping@sxmu.edu.cn; yangfan9327@163.com
bXiangya School of Medicine, Central South University, Changsha, 410006, China
First published on 23rd December 2022
Abstract
Cancer has been regarded as one of the most intractable diseases worldwide and threatens human health and life. Photothermal/Photodynamic therapy (PTT and PDT) have emerged as reliable and effective strategies in cancer treatment with the superiorities of non-invasiveness, slight side effects, and high treatment efficiency. Herein, a nanocomposite (PBCN) was fabricated via electrostatic interaction between Prussian blue nanoparticles (PBNPs) and graphitic carbon nitride (g-C3N4), and the resulting PBCN possessed good photothermal properties and excellent photodynamic effects with 808 nm irradiation. Furthermore, it exhibits excellent fluorescence imaging ability in cells, highlighting its potential as a powerful imaging agent in the biomedical field. Combination with a photothermal material, photosensitizer, and fluorescence imaging agent would thus allow PBCN to realize fluorescence imaging-guided PTT/PDT, showing an outstanding theranostic effect on cancer cells.
1. Introduction
Nanomaterial-based theranostic strategies have attracted wide attention as novel technologies in the field of biomedicine.1 Their tunable size, multiple morphologies, and ease of surface functionalization endow them with excellent biosecurity, high carrier capacity, and enormous potential as nanomedicines for disease diagnosis and treatment, including cancer.2 Cancer has been recognized as the main factor threatening the health and life of people around the world. The traditional clinical treatment options such as radiotherapy, chemotherapy, and surgery, are often associated with low treatment efficiency and severe side effects on the human body.3 Therefore, it is crucial to develop safe and potent ways for tumor ablation. The near-infrared (NIR) light-driven phototherapeutic strategies, representatively as photothermal therapy (PTT)4,5 and photodynamic therapy (PDT),6 have been developed due to their non-invasiveness, low drug resistance, and slight side effects.7PTT is a typical treatment that induces tumor cell apoptosis via a photothermal agent irradiated under NIR light to generate local high thermal energy.8 Common photothermal agents include gold nanomaterials,9 MoS2,10 and graphene oxide et al.,11 which have disadvantages such as high cost, complex synthesis, and low photothermal conversion efficiency. In contrast, Prussian blue nanoparticles (PBNPs) have been widely applied in PTT because of their simple synthesis, good photothermal properties, and low cytotoxicity.12 For example, Cheng et al. used PBNPs modified with polyethylene glycol as photothermal agents, which showed good photothermal stability and strong ability of tumor ablation in vivo.13
PDT is a process in which photosensitizers generate reactive oxygen species (ROS) through energy transfer by laser irradiation and then induce cancer cell death.14 Graphitic carbon nitride (g-C3N4) has the characteristics of simple synthesis, stable structure, large specific surface area, tunable optical properties, and good biocompatibility, highlighting its potential as a photosensitizer for PDT. For example, Wu et al. reported that g-C3N4 had a strong ability to cleave water and promote the production of ROS in large quantities, showing great application potential in PDT.15 However, the PDT efficiency of g-C3N4 is far from satisfactory because the limitation of the original bandgap (2.7 eV) makes it difficult for g-C3N4 to absorb visible light. Furthermore, Liu et al. synthesized 3-amino-1,2,4-triazole modified g-C3N4 to expand the light response range of g-C3N4 and enhance PDT.16
Although researchers have made efforts to improve the efficacy of PTT and PDT, monotherapy cannot completely destroy tumor cells and remains unsatisfactory for expected therapeutic effect.17 Photothermal/photodynamic combination therapy has become a robust modality to provide synergistic effects for tumor inhibition and ablation. For example, Xu et al. combined g-C3N4 with the photothermal agent (CuS) to improve the lethality of cancer cells via combined PTT/PDT therapy.18 Zhang et al. reported a Ti3C2/g-C3N4 nanocomposite with NIR response for the synergy PTT/PDT treatment of breast cancer, which expressed a good anticancer effect.19
In this work, PBNPs with a negative charge and C3N4 nanosheet with a positive charge were assembled into C3N4-PBNPs (PBCN) nanocomposites through electrostatic interaction. Based on the advantages of good photothermal response, strong ROS generation ability, and fluorescence imaging capability, PBCN nanocomposites were applied for cell imaging and PTT/PDT combined treatment in cancer cells. The good PTT/PDT of PBCN was verified by monitoring the heating curve and ROS production in vitro with an 808 nm laser. Furthermore, the fluorescence imaging ability and synergistic therapeutic effect were achieved in breast cancer cells (MCF-7). The work highlights the potential of PBCN for fluorescence imaging-guided PTT/PDT (Scheme 1).
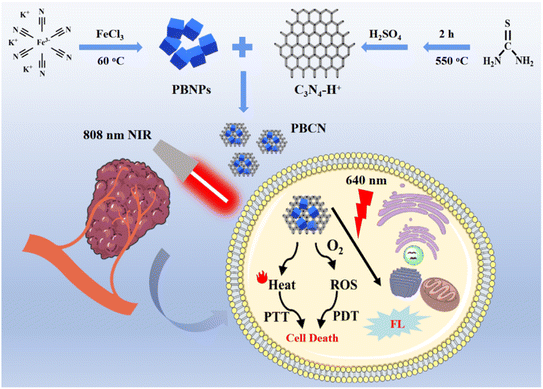 | ||
| Scheme 1 Schematic illustration of synthesis and photothermal and photodynamic synergistic therapy of PBCN. | ||
2. Experimental section
2.1 Reagents and materials
FeCl3, CH4N2S, C6H8O7·H2O, C3H7NO, K3[Fe(CN)6], C20H14O, and C5H9NO3S, were purchased from Shanghai Aladdin Reagent Co., Ltd. Human breast cancer cell (MCF-7) and Calcein-AM/PI Double Stain Kit were ordered from Beijing Solarbio. Fetal bovine serum was obtained from Sijiqing (China).2.2 Synthesis of PBCN
![[thin space (1/6-em)]](https://www.rsc.org/images/entities/char_2009.gif) 000 rpm for 5 min and washed with deionized water for 3 times. After freeze-drying, the blue powder was acquired and collected for subsequent use.
000 rpm for 5 min and washed with deionized water for 3 times. After freeze-drying, the blue powder was acquired and collected for subsequent use.2.3 Photothermal properties of PBCN nanocomposites
To evaluate the photothermal properties, PBCN nanocomposites were dissolved in ultrapure water and prepared into aqueous solution with different concentrations (0, 10, 50, 75, 100, 125, and 150 μg mL−1). All these solution were irradiated with a laser (808 nm, 1.8 W cm−2) for 10 min, respectively. A thermocouple microprobe was used to record the solution temperature every 30 seconds. In order to compare the photothermal capacity of C3N4–H+, PBNPs, and PBCN, the aqueous solution containing 150 μg mL−1 C3N4–H+ and PBNPs were measured under the same measurement conditions, respectively.The photothermal conversion efficiency (η) was evaluated as follows: the solution containing PBCN nanocomposites (150 μg mL−1) was irradiated using an 808 nm laser (1.8 W cm−2) for 5 min, and then cooled to room temperature naturally. PBCN (150 μg mL−1) solution was repeatedly irradiated for 5 cycles to evaluate the photothermal stability.
2.4 Detection of ROS
The ROS generation capability of PBCN nanocomposites was evaluated by measuring singlet oxygen (1O2) generation with a 1,3-diphenylisobenzofuran (DPBF) probe. First, the DPBF solution (54 μM) was mixed with different nanomaterials (C3N4–H+, PBNPs, and PBCN) in a quartz cuvette, respectively. All their concentrations were maintained at 150 μg mL−1. Then, the solution was irradiated with a laser (808 nm, 1.8 W cm−2) for 10 min. Finally, the absorbance values of DPBF were measured every 2 minutes using a UV-vis spectrometer.2.5 Phototoxicity assay of PBCN nanocomposites
The phototoxicity of PBCN nanocomposites to cells was detected using an 3-(4,5-dimethyl-2-thiazolyl)-2,5-diphenyl-2-H-tetrazolium bromide (MTT). MCF-7 cells were divided into PTT and PTT/PDT groups. In the PTT group: the adherent cells were incubated with 200 mM N-acetylcysteine (NAC) to eliminate ROS.23 20 min later, the cells were cultured with 1640 medium containing different concentrations of PBCN for 12 h. In PTT/PDT group: the cells were directly added 1640 medium containing PBCN nanocomposites and incubated for 12 h. All the groups were irradiated using a laser (808 nm, 1.8 W cm−2) for 20 min. Then MTT was added in each well and incubated for another 4 h. Finally, the DMSO was added and a microplate reader was used to record the absorbance at 490 nm.2.6 In vitro cell imaging
First, MCF-7 cells were incubated with 1640 medium-contained 150 μg mL−1 PBCN nanocomposites for different times (0 to 20 h). Then, the cells were washed with PBS buffer. Finally, the intracellular fluorescence was observed and collected by a CLSM.2.7 Intracellular measurement of ROS
First, MCF-7 cells were incubated with 1640 medium-contained 150 μg mL−1 PBCN nanocomposites for 12 h. Then, the medium was discarded and the cells were treated with 2′,7′-dichlorodihydrofluorescein diacetate (DCFH-DA, 10 μM) probe for 1 h and irradiated with a laser (808 nm, 1.8 W cm−2) for different times (0, 2, 6, 10, 15 and 20 min). Finally, the fluorescence images were collected using a CLSM.2.8 Evaluation of PTT/PDT combined therapy effect
The calcein AM/propidiumiodide (AM-PI) two-stained assay was performed to evaluate the PTT/PDT combined therapeutic effect of PBCN nanocomposites. MCF-7 cells were divided into multigroup with different treatments as follows: The cells were treated with PBS (blank group), NAC (blank group), ice (blank group), 808 nm laser irradiation (blank group), 150 μg mL−1 C3N4–H+ + 808 nm laser irradiation (control group 1), 150 μg mL−1 PBNPs + laser irradiation (control group 2), 150 μg mL−1 PBCN (control group 3), NAC + 150 μg mL−1 PBCN + laser irradiation (PTT group), ice + 150 μg mL−1 PBCN + 808 nm laser irradiation (PDT group), and 150 μg mL−1 PBCN + 808 nm laser irradiation (PTT/PDT group). After treatment, 100 μL AM-PI staining solution was added to all the groups and incubated for 15 min, and washed with PBS for three times. Finally, the intracellular fluorescence was observed and collected by a CLSM.3. Results and discussion
3.1 Synthesis and characterization
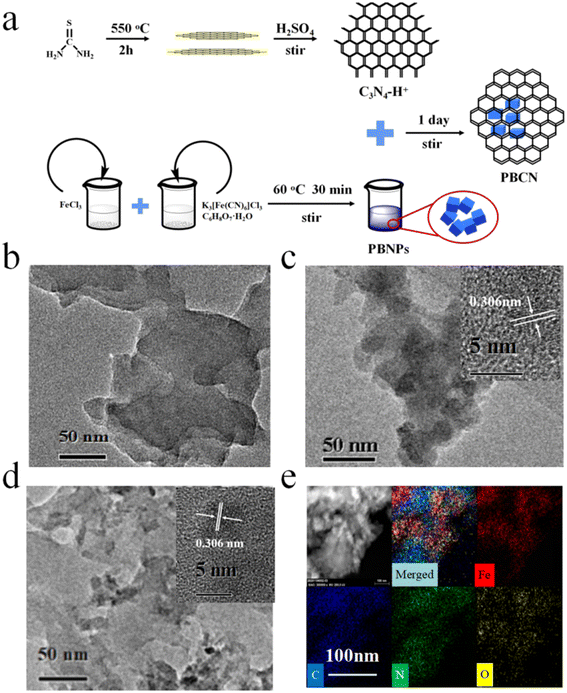
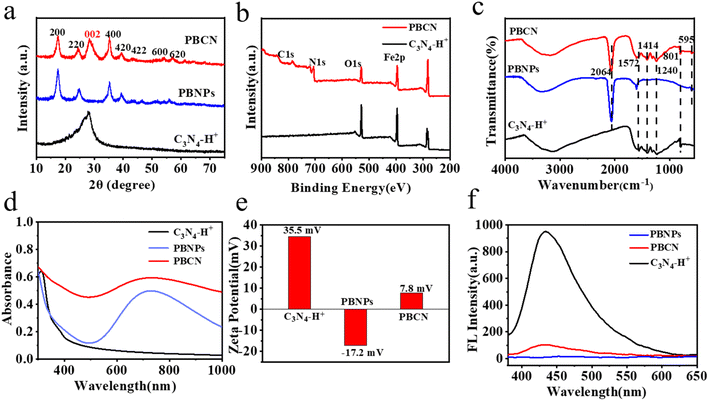
The detailed synthesis procedure for C3N4–H+, PBNPs, and PBCN nanocomposites are available in Fig. 1a. First, the thiourea was heated to 550 °C for 2 h, and the obtained yellow powder was stirred with concentrated sulfuric acid for 4 h to prepare C3N4–H+. Meanwhile, the PBNPs were synthesized in a solution of FeCl3, C6H8O7·H2O, and K3[Fe(CN)6] at 60 °C. Finally, the obtained C3N4–H+ and PBNPs were mixed to form PBCN nanocomposites through electrostatic interaction. The morphology of C3N4–H+ nanosheets, PBNPs, and PBCN nanocomposites was visualized by TEM. The C3N4–H+ nanosheets presented a graphite-like layered structure (Fig. 1b). The synthesized PBNPs with a lattice spacing of 0.306 nm (Fig. 1c). In Fig. 1d, it could be clearly observed that PBNPs are dispersed on the surface of C3N4–H+ nanosheets. The inner illustration showed clear lattice fringes of PBNPs (0.306 nm).24,25 The distribution of EDS elements corresponding to PBCN nanocomposites indicates the presence of Fe, C, N, and O elements (Fig. 1e). The crystal structures of C3N4–H+, PBNPs, and PBCN were analyzed by XRD patterns. As presented in Fig. 2a, C3N4–H+ has only one strong diffraction peak located at 28.1°, while the characteristic peak corresponding to the (100) crystal plane disappears, which may be due to the change of atomic order caused by acidification.20 The characteristic diffraction peaks of PBNPs were 17.46°, 24.73°, 35.28°, 39.37°, 43.56°, 54.12°, and 57.18°, corresponding to the (200), (220), (400), (420), (422), (600) and (620) surfaces of Prussian blue, respectively.24,26–28 The XRD patterns of PBCN nanocomposites contained the peaks of C3N4–H+ and PBNPs, and no new diffraction peaks appear, indicating that the structure of PBCN was not destroyed by recombination. The surface functional groups of C3N4–H+, PBNPs, and PBCN nanocomposites were characterized by FT-IR. As shown in Fig. 2c, the absorption peaks of C3N4–H+ located at 801 cm−1, 1240 cm−1, 1414 cm−1 and 1572 cm−1 were corresponding to the stretching vibrations of the triazine ring, C–O, C–N, and C![[double bond, length as m-dash]](https://www.rsc.org/images/entities/char_e001.gif) N, respectively.27,29 There was a wide peak at 3000–3500 cm−1 due to the stretching vibration of O–H and N–H.30 PBNPs had two typical characteristic absorption peaks at 2064 cm−1 and 595 cm−1,31 which were attributed to the stretching vibration of Fe2+–CN–Fe3+ and Fe–C.26 Not only the characteristic absorption peaks of C3N4–H+ but also the typical absorption peaks of PBNPs in the FT-IR diagram of PBCN nanocomposites. The XPS total spectrum of PBCN appeared four elements of C, N, O, and Fe, which was consistent with the results of EDS (Fig. 2b). Among them, the fine energy spectrum of C 1s had two characteristic peaks located at 284.9 eV and 288.6 eV, which were ascribed to the binding energy of C–C and C
N, respectively.27,29 There was a wide peak at 3000–3500 cm−1 due to the stretching vibration of O–H and N–H.30 PBNPs had two typical characteristic absorption peaks at 2064 cm−1 and 595 cm−1,31 which were attributed to the stretching vibration of Fe2+–CN–Fe3+ and Fe–C.26 Not only the characteristic absorption peaks of C3N4–H+ but also the typical absorption peaks of PBNPs in the FT-IR diagram of PBCN nanocomposites. The XPS total spectrum of PBCN appeared four elements of C, N, O, and Fe, which was consistent with the results of EDS (Fig. 2b). Among them, the fine energy spectrum of C 1s had two characteristic peaks located at 284.9 eV and 288.6 eV, which were ascribed to the binding energy of C–C and C![[double bond, length as m-dash]](https://www.rsc.org/images/entities/char_e001.gif) O bond.32 The fine energy spectrum of N 1s showed three binding energy peaks at 397.6 eV, 399.20 eV, and 400.9 eV, which were corresponding to Fe–N, N–(C)3 and N–H bonds, respectively.33 As shown in Fig. S1c,† the fine energy spectrum of O 1s had two absorption peaks at 531.9 eV and 533.4 eV, attributing to the C
O bond.32 The fine energy spectrum of N 1s showed three binding energy peaks at 397.6 eV, 399.20 eV, and 400.9 eV, which were corresponding to Fe–N, N–(C)3 and N–H bonds, respectively.33 As shown in Fig. S1c,† the fine energy spectrum of O 1s had two absorption peaks at 531.9 eV and 533.4 eV, attributing to the C![[double bond, length as m-dash]](https://www.rsc.org/images/entities/char_e001.gif) O and the binding energy of the C–O bond, respectively.34 In the fine energy spectrum of Fe 2p (Fig. S1d†), five characteristic peaks were observed at 708 eV, 710.1 eV, 712.3 eV, 721.5 eV, and 724.4 eV, respectively, which were attributed to Fe–N, Fe2+ 2p3/2, Fe3+ 2p3/2, Fe2+ 2p1/2 and Fe3+ 2p1/2.25
O and the binding energy of the C–O bond, respectively.34 In the fine energy spectrum of Fe 2p (Fig. S1d†), five characteristic peaks were observed at 708 eV, 710.1 eV, 712.3 eV, 721.5 eV, and 724.4 eV, respectively, which were attributed to Fe–N, Fe2+ 2p3/2, Fe3+ 2p3/2, Fe2+ 2p1/2 and Fe3+ 2p1/2.25
As demonstrated in Fig. 2d, PBNPs showed a narrow absorption at 750–1000 nm, following a maximum absorption wavelength at 700 nm. Compared with PBNPs, the absorption of PBCN nanocomposites was wider in the near-infrared optical region of 750–1000 nm, and the maximum absorption peak showed a slight red shift, which could be ascribed to the carrier jump of Fe2+ and Fe3+ in PBNPs.26 An absorption peak was observed at 380 nm for C3N4–H+ nanosheets, and a weak absorption was observed at 400 nm for PBCN, which could be explained by the n–π* transition of C![[double bond, length as m-dash]](https://www.rsc.org/images/entities/char_e001.gif) O group on the surface of C3N4–H+ nanosheets.32 In Fig. 2e, the zeta potential of C3N4–H+ nanosheets, PBNPs, and PBCN are 35.5 mV, −17.2 mV, and 7.8 mV, respectively, suggesting that PBCN nanocomposites were formed through the electrostatic assembly. The fluorescence intensity of PBCN nanocomposites was significantly reduced than C3N4–H+ nanosheets, indicating that they had a higher electron–hole pair separation efficiency (Fig. 2f).19 The fluorescence lifetimes of C3N4–H+ nanosheets and PBCN were 15.61 ns and 3.14 ns, respectively. The fluorescence lifetimes of PBCN were smaller than that of C3N4–H+ nanosheets, indicating that PBCN had higher photogenerated carrier separation efficiency. Moreover, the fluorescence quantum yield of PBCN was calculated to be 37.3%, indicating that PBCN expressed a good potential for biological imaging. All these experiments demonstrated the successful preparation of PNCN, which showed great potential for cell imaging and biomedicine application.
O group on the surface of C3N4–H+ nanosheets.32 In Fig. 2e, the zeta potential of C3N4–H+ nanosheets, PBNPs, and PBCN are 35.5 mV, −17.2 mV, and 7.8 mV, respectively, suggesting that PBCN nanocomposites were formed through the electrostatic assembly. The fluorescence intensity of PBCN nanocomposites was significantly reduced than C3N4–H+ nanosheets, indicating that they had a higher electron–hole pair separation efficiency (Fig. 2f).19 The fluorescence lifetimes of C3N4–H+ nanosheets and PBCN were 15.61 ns and 3.14 ns, respectively. The fluorescence lifetimes of PBCN were smaller than that of C3N4–H+ nanosheets, indicating that PBCN had higher photogenerated carrier separation efficiency. Moreover, the fluorescence quantum yield of PBCN was calculated to be 37.3%, indicating that PBCN expressed a good potential for biological imaging. All these experiments demonstrated the successful preparation of PNCN, which showed great potential for cell imaging and biomedicine application.
3.2 Photothermal properties of PBCN nanocomposites
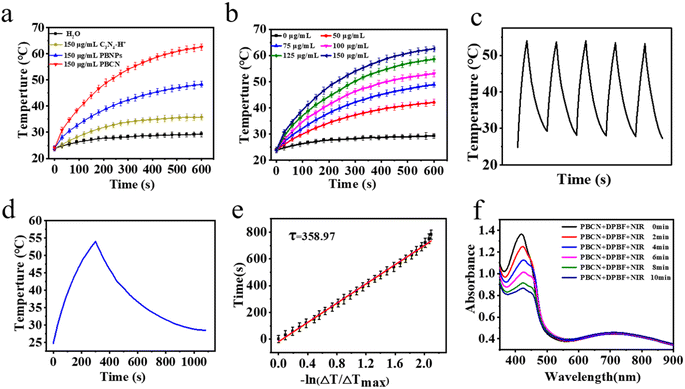
In order to verify the photothermal properties of PBCN nanocomposites, an 808 nm laser with high absorption coefficient and deep tissue penetration (optical power density 1.8 W cm−2) was selected as the light source for the following experiments.35 In Fig. 3a after irradiating C3N4–H+ nanosheets, PBNPs, and PBCN solutions (150 μg mL−1) for 10 min, the temperatures of the solution reached 35.9 °C, 48.6 °C and 62.5 °C, respectively, indicating the potential of PBCN nanocomposites as photothermal material. The temperature of PBCN solution with different concentrations (0–150 μg mL−1) raised quickly with the time of irradiation. The temperature of the PBCN solution (50 μg mL−1) could rise to 43.8 °C with laser irradiation, which had reached the critical temperature to induce cell apoptosis (43 °C) (Fig. 3b).36 The η was used to evaluate the photothermal performance. The η of PBCN was calculated to be 60.1% based on the cooling curve (Fig. 3e), which is superior to other PBNPs-based nanocomposites, such as CDs/PBNPs nanomaterials (30%),26 MnPB NPs nanomaterials (27.8%),11 and CaP&PB (40.2%).28 The good photothermal stability was verified by exposing PBNC to an 808 nm laser for 5 min, followed by natural cooling to room temperature. The cycle of laser on/off was repeated five times (Fig. 2c). All the experimental results revealed that PBCN was a potential photothermal agent for PTT.3.3 Photodynamic effects of PBCN nanocomposites
The ROS generation of PBCN was evaluated by using 1,3-diphenylisobenzofuran (DPBF) as a scavenger,37 whose UV absorption peak at 425 nm would be reduced in the presence of 1O2. As shown in Fig. S2,† the DPBF group, DPBF content of the C3N4–H+ nanosheets group, and DPBF content of the PBNPs group with NIR irradiation showed negligible effect on the degradation. In contrast, the absorbance of DPBF solution containing PBCN at 425 nm under the irradiation of an 808 nm laser showed a continuous decrease within 10 min (Fig. 3d), indicating that PBCN was a promising photosensitizer for PDT.3.4 The fluorescence imaging of PBCN nanocomposites
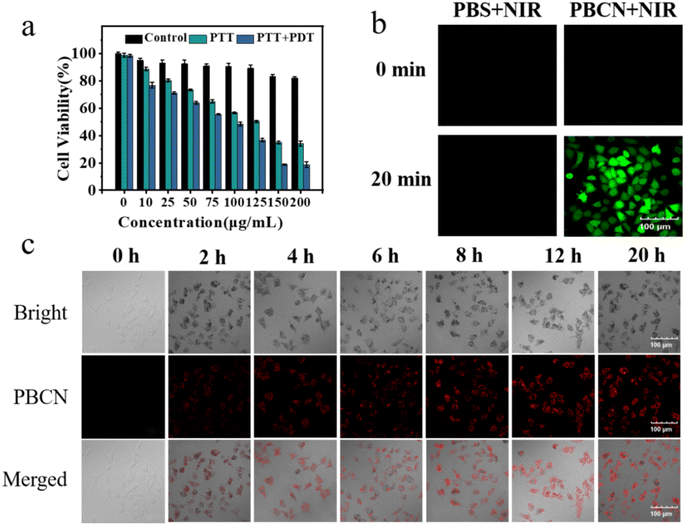
Before evaluating the imaging and anti-tumor capability of PBCN nanocomposites in cells, the cytotoxicity was first determined by MTT assay using MCF-7 cells. The PBCN nanocomposites displayed a slight cytotoxicity toward MCF-7 cells when the concentration was from 0 to 200 μg mL−1 (Fig. 4a). The cell viability remain maintained at 82% even if the concentration of PBCN nanocomposites reached 200 μg mL−1 (black, control group), indicating the good biocompatibility and high biosafety of PBCN nanocomposites.The fluorescence imaging ability of PBCN nanocomposites in live cells was studied in Fig. 4c. The cytoplasm of MCF-7 incubated with PBCN nanocomposites showed red fluorescence signals, indicating that PBCN nanocomposites could enter into the cytoplasm. The fluorescence signals enhanced with the incubation time and reached the brightest at 12 h since the concentration of PBCN nanocomposites in the cytoplasm might reach saturation. All the results proved that PBCN nanocomposites could be used as a promising fluorescent probe for cellular imaging.
3.5 PTT/PDT effect of PBCN on MCF-7 cells
The DCFH-DA was applied as a chemical probe to assess ROS generation ability in MCF-7 cells. First, the real-time fluorescence intensity was monitored to optimize the irradiation time. As shown in Fig. S3a,† MCF-7 cells treated with 150 μg mL−1 PBCN nanocomposites displayed a brighter green fluorescence with the irradiation from 0 to 20 min, indicating that PBCN nanocomposites could generate a large amount of ROS after 20 min irradiation. Note that MCF-7 cells incubated with PBCN nanocomposites only showed green fluorescence under NIR light irradiation (808 nm, 1.8 W cm−2), while the cells treated with PBS buffer showed insignificant fluorescence both with NIR or without NIR irradiation (Fig. 4b). All these results suggested the powerful ROS production ability of PBNC nanocomposites with an 808 nm laser assistant.Furthermore, the Calcein AM (green fluorescence, live cells)–PI (red fluorescence, dead cells) two-stained assay was performed to evaluate the therapeutic effects of PBCN nanocomposites. The cells were treated with PBS buffer, 808 nm laser irradiation, singlet oxygen scavenger NAC incubation, and ice cube incubation, respectively. All these groups showed green fluorescence and there are no red fluorescence signals were observed, indicating that the pure 808 nm laser irradiation, NAC, and low temperature did not affect the cell viability (Fig. S3b†). A slight red fluorescence signal was observed in the visual field when the cells were incubated by C3N4–H+ nanosheets or PBNPs with laser irradiation (Fig. 5a), indicating that both C3N4–H+ nanosheets and PBNPs showed a weak PTT/PDT effects in live cells. Furthermore, the mono-PTT or PDT effects of PNCN nanocomposites. Were evaluated using NAC and ice cube-treated cells under laser irradiation, respectively. Both red and green fluorescence signals were observed in two groups, which suggested that the mono-therapy was not effective enough to kill the cancer cells. The cells directly treated with PBCN nanocomposites and irradiated with an 808 nm laser for 20 min named as PTT/PDT group, it denoted red fluorescence in the whole field of vision, indicating that the cells suffered serious apoptosis. The results also were confirmed via MTT assay (Fig. 4a). The cell viability of the PTT/PDT group was 19%, while the cell viability of the mono-PTT group still retained at 35.8%. The irradiation time also showed an effect on the apoptosis of cells. The ratio of red/green gradually increased with irradiation time, indicating that the cell viability decreased (Fig. 5b). All these results indicated that PBCN nanocomposites with photothermal and photodynamic capabilities owned the best synergistic therapeutic effect on MCF-7 cells with a NIR laser assistant.
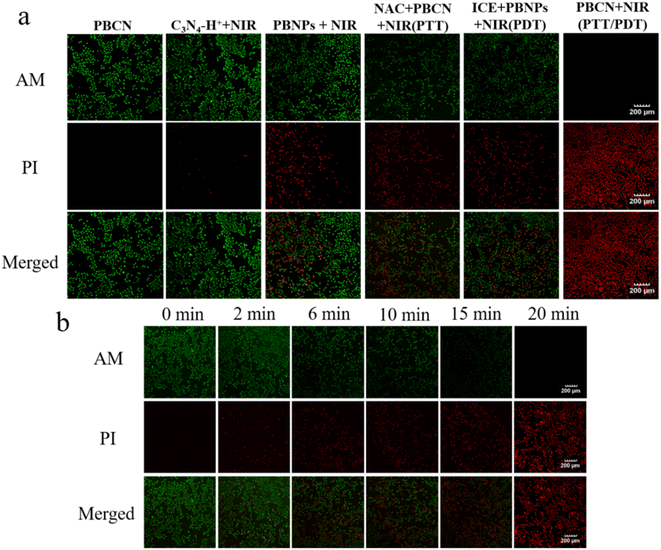 | ||
| Fig. 5 (a) CLSM images of AM-PI stained MCF-7 cells with different treatments. (b) CLSM images of AM-PI stained MCF-7 cells treated with PBCN under different irradiation times. | ||
4. Conclusions
In summary, we have successfully developed multifunctional nanocomposites for fluorescence imaging-guided synergistic PTT and PDT. The Prussian blue/graphitic carbon nitride (PBCN) nanocomposites were fabricated via electrostatic interaction between PBNPs and C3N4–H+ nanosheets. The composition and morphology of PBCN were comprehensively characterized. We revealed PBCN nanocomposites showed excellent fluorescence imaging ability and 1O2 generation capacity than free-C3N4–H+ nanosheets system. Moreover, PBCN nanocomposites displayed a good photothermal performance with a η up to 60.1%, which was superior to other previously reported PBNP-based nanocomposites. Importantly, PBNC presented an excellent therapeutic efficiency anticancer treatment in living cells than mono-PTT/PDT system due to a synergetic effect, indicating its possibility as a novel theranostic agent for biomedical applications.Conflicts of interest
There are no conflicts to declare.Acknowledgements
This work was financially supported by the National Nature Science Foundation of China (82001962), China Postdoctoral Science Foundation (2021T140432, 2019M661056), Shanxi Province Science Foundation for Youths (201901D211337) and National Innovation and Entrepreneurship Training Program for College Students, China (202210114001).References
- G. Chen, I. Roy, C. Yang and P. N. Prasad, Chem. Rev., 2016, 116, 2826–2885 CrossRef CAS PubMed.
- S. Avnesh and S. Sanjiv, Ca-Cancer J. Clin., 2013, 63, 395–418 CrossRef PubMed.
- A. Boddu, S. R. Obireddy, D. Zhang, K. Rao and W. F. Lai, Drug Delivery, 2022, 29, 2481–2490 CrossRef CAS PubMed.
- G. Li, X. Zhang, W. Zhao, W. Zhao, F. Li, K. Xiao, Q. Yu, S. Liu and Q. Zhao, ACS Appl. Mater. Interfaces, 2020, 12, 20180–20190 CrossRef CAS PubMed.
- G. Li, R. Zhou, W. Zhao, B. Yu, J. Zhou, S. Liu, W. Huang and Q. Zhao, Research, 2020, 2020, 5351848 CAS.
- G. Li, Q. Wang, J. Liu, M. Wu, H. Ji, Y. Qin, X. Zhou and L. Wu, J. Mater. Chem. B, 2021, 9, 7347–7370 RSC.
- N. Zhang, Y. Wu, W. Xu, Z. Li and L. Wang, Drug Delivery, 2022, 29, 506–518 CrossRef CAS PubMed.
- Y. Jin, K. Wang, S. Li and J. Liu, J. Colloid Interface Sci., 2022, 614, 345–354 CrossRef CAS PubMed.
- X. Li, Y. Zhang, G. Liu, Z. Luo, L. Zhou, Y. Xue and M. Liu, RSC Adv., 2022, 12, 7635–7651 RSC.
- D. Fang, Z. Liu, H. Jin, X. Huang, Y. Shi and S. Ben, Front. Bioeng. Biotechnol., 2022, 10, 939158 CrossRef PubMed.
- D. Fang, Z. Liu, H. Jin, X. Huang, Y. Shi and S. Ben, Front. Bioeng. Biotechnol., 2022, 10, 939158 CrossRef PubMed.
- M. A. Busquets and J. Estelrich, Drug Discovery Today, 2020, 25, 1431–1443 CrossRef CAS PubMed.
- L. Cheng, H. Gong, W. Zhu, J. Liu, X. Wang, G. Liu and Z. Liu, Biomaterials, 2014, 35, 9844–9852 CrossRef CAS PubMed.
- X. Liu, N. Xu, X. Pu, J. Wang, X. Liao, Z. Huang and G. Yin, J. Mater. Chem. B, 2022, 10, 4605–4614 RSC.
- Y. Wu, D. Yang, W. Xu, R. Song, M. Li, Y. Wang, B. Zhou, N. Wu, W. Zhong, H.-l. Cai, J. Tu, D. Zhang and X. S. Wu, Appl. Catal., B, 2020, 269, 118848 CrossRef CAS.
- X. Liu, S. Xing, Y. Xu, R. Chen, C. Lin and L. Guo, Spectrochim. Acta, Part A, 2021, 250, 119363 CrossRef CAS PubMed.
- Z. Chu, T. Tian, Z. Tao, J. Yang, B. Chen, H. Chen, W. Wang, P. Yin, X. Xia, H. Wang and H. Qian, Bioact. Mater., 2022, 17, 71–80 CrossRef CAS PubMed.
- M. Xu, G. Yang, H. Bi, J. Xu, L. Feng, D. Yang, Q. Sun, S. Gai, F. He, Y. Dai, C. Zhong and P. Yang, Chem. Eng. J., 2019, 360, 866–878 CrossRef CAS.
- Y. Zhang, Y. Cheng, F. Yang, Z. Yuan, W. Wei, H. Lu, H. Dong and X. Zhang, Nano Today, 2020, 34, 100919 CrossRef CAS.
- L. Wang, Y. Hong, E. Liu, X. Duan, X. Lin and J. Shi, Carbon, 2020, 163, 234–243 CrossRef CAS.
- A. Zhang, Y. Guo, H. Xie, Y. Zhang, Y. Fu, C. Ye, Y. Du and M. Zhu, J. Colloid Interface Sci., 2022, 628, 397–408 CrossRef CAS PubMed.
- P. Shou, Z. Yu, Y. Wu, Q. Feng, B. Zhou, J. Xing, C. Liu, J. Tu, O. U. Akakuru, Z. Ye, X. Zhang, Z. Lu, L. Zhang and A. Wu, Adv. Healthcare Mater., 2020, 9, e1900948 CrossRef PubMed.
- Z. Meng, J. Liu, Z. Feng, S. Guo, M. Wang, Z. Wang, Z. Li, H. Li and L. Sui, Stem Cell Res. Ther., 2022, 13, 466 CrossRef CAS PubMed.
- L. Hou, X. Gong, J. Yang, H. Zhang, W. Yang and X. Chen, Adv. Mater., 2022, 34, e2200389 CrossRef PubMed.
- K. Zhang, J. Wu, X. Zhao, J. Qin, Y. Xue, W. Zheng, L. Wang, H. Wang, H. Shen, T. Niu, Y. Luo, R. Tang and B. Wang, ACS Nano, 2021, 15, 19838–19852 CrossRef CAS PubMed.
- W. Shen, G. Han, L. Yu, S. Yang, X. Li, W. Zhang and P. Pei, Int. J. Nanomed., 2022, 17, 1397–1408 CrossRef PubMed.
- Y. N. Wang, W. S. Zhang, X. P. Liu, Y. Y. Wei and Z. R. Xu, Colloids Surf., B, 2022, 215, 112490 CrossRef CAS PubMed.
- D. Zhong, Y. Wang, F. Xie, S. Chen, X. Yang, Z. Ma, S. Wang, M. Z. Iqbal, J. Ge, Q. Zhang, R. Zhao and X. Kong, J. Mater. Chem. B, 2022, 10, 4889–4896 RSC.
- Y. Tian, D. Zhao, X. Huang, X. Guan, F. Wang and X. Wei, ACS Appl. Mater. Interfaces, 2022, 14, 7626–7635 CrossRef CAS PubMed.
- M. X. Liu, X. L. Zhang, J. B. Yang, Z. L. Lu and Q. T. Zhang, J. Mater. Chem. B, 2022, 10, 5430–5438 RSC.
- D. Li, T. Wang, L. Li, L. Zhang, C. Wang and X. Dong, J. Colloid Interface Sci., 2022, 613, 671–680 CrossRef CAS PubMed.
- Z. Xu, Y. Liu, R. Ma, J. Chen, J. Qiu, S. Du, C. Li, Z. Wu, X. Yang, Z. Chen and T. Chen, ACS Appl. Mater. Interfaces, 2022, 14, 14059–14071 CrossRef CAS PubMed.
- S. Wang, N. Zeng, Q. Zhang, M. Chen and Q. Huang, Front. Oncol., 2022, 12, 888855 CrossRef PubMed.
- H. Wang, R. Qu, Q. Chen, T. Zhang, X. Chen, B. Wu and T. Chen, J. Mater. Chem. B, 2022, 10, 5410–5421 RSC.
- E. Kirbas Cilingir, M. Sankaran, J. M. Garber, F. A. Vallejo, M. Bartoli, A. Tagliaferro, S. Vanni, R. M. Graham and R. M. Leblanc, Nanoscale, 2022, 14, 9686–9701 RSC.
- W. Cao, L. Liu, R. Yuan and H. Wang, Biosens. Bioelectron., 2022, 214, 114506 CrossRef CAS PubMed.
- Z. Hou, M. Zhou, Y. Ma, X. Xu, Z. Zhang, S. Lai, W. Fan, J. Xie and S. Ju, Eur. J. Nucl. Med. Mol. Imaging, 2022, 49, 2655–2667 CrossRef CAS PubMed.
Footnote |
| † Electronic supplementary information (ESI) available. See DOI: https://doi.org/10.1039/d2ra07022g |
| This journal is © The Royal Society of Chemistry 2023 |

