
 Open Access Article
 This Open Access Article is licensed under a Creative Commons Attribution-Non Commercial 3.0 Unported Licence
Experimental and modelling studies of carbon dioxide capture onto pristine, nitrogen-doped, and activated ordered mesoporous carbons† ‡
Talla Venkata Rama Mohan a,
Palla Sridharb and
Parasuraman Selvam*ac
a,
Palla Sridharb and
Parasuraman Selvam*ac
aNational Centre for Catalysis Research and Department of Chemistry, Indian Institute of Technology-Madras, Chennai 600 036, India. E-mail: selvam@iitm.ac.in; Tel: +91-44-2257-4235
bDepartment of Chemical Engineering, Indian Institute of Technology-Madras, Chennai 600 036, India
cInternational Research Organization for Advanced Science and Technology, Kumamoto University, 2-39-1 Kurokami, Chuo-ku, Kumamoto 860-8555, Japan
First published on 4th January 2023
Abstract
The search for suitable materials for carbon dioxide capture and storage has attracted the attention of the scientific community in view of the increased global CO2 levels and its after-effects. Among the different materials under research, porous carbons and their doped analogues are extensively debated for their ability to store carbon dioxide at high pressures. The present paper examined high-pressure carbon dioxide storage studies of 1-D hexagonal and 3-D cubic ordered mesoporous pristine and N-doped carbons prepared using the nano-casting method. Excess carbon dioxide sorption isotherms were obtained using the volumetric technique and were fitted using the Toth model. Various parameters that influence CO2 storage on metal-free ordered mesoporous carbons, such as the effect of pore size, pore dimension, pyrolysis temperature, the impact of nitrogen substitution, and the effect of ammonia activation are discussed. It was observed that the carbon dioxide storage capacity has an inverse relation to the total nitrogen doped, the amount of pyridinic nitrogen functionality, and the pyrolysis temperature, whereas the pore size seems to have a linear relationship. On the other hand, the presence of oxygen has a positive effect on the sorption capacity. Among the prepared ordered mesoporous carbons, the ammonia-treated one has shown the highest adsorption capacity of 37.8 mmol g−1 at 34 bar and 0 °C.
Introduction
Frequently observed adverse climatic effects are associated with increasing global warming and have been a widespread concern in recent years. Carbon dioxide (CO2) is the primary greenhouse gas that is responsible for these calamities. The threshold limit for global CO2 emissions is ∼450 ppm.1 The world average CO2 concentration has reached 415 ppm, and is rising by 2.5 ppm per year which is an increasing cause of worry for humanity.1,2 It was apparent during the pandemic that the primary reasons for these emissions are the energy and transportation sectors, which involve the use of fossil fuels and coal as the primary energy source. Hence, there is a substantial interest in shifting from fossil fuel systems that evolve CO2 to cleaner systems to decrease the current levels of CO2 globally. To reduce the CO2 levels, various methods such as curbing atmospheric CO2, conversion of CO2 to useful chemicals, and limiting the amount of CO2 evolved in different fossil fuel consumption processes are under trial. In particular, CO2 storage at high pressure is utilized in the carbon capture and storage (CCS) technologies for better transport and sequestration of CO2, and for pressure swing adsorptions such as gas purification and separation of carbon dioxide from the flue gases, the pressure fluctuations are in the range of 10–40 bar. Hence, CO2 storage has gained much attention, and the physical capture or storage of CO2 is mostly focused on porous adsorbents.Various adsorbents such as zeolites, templated silica, porous carbon materials, porous aromatic frameworks (PAF), porous organic polymers (POP), hierarchical porous carbons (HPC), and metal–organic frameworks (MOF) have actively pursued CO2 storage evaluations.3–12 To act as an ideal adsorbent, along with high CO2 adsorption capacities, the materials must also adhere to other criteria, such as good cyclic stability and cost-effectiveness, and are economically recycled. Porous carbons have all these advantageous features.13 The CO2 storage capacity of porous carbons was studied with various carbon materials ranging from amine-grafted porous carbons to zeolite or mesoporous silica template carbons prepared using soft template methods synthesized by post-grafting method or activated using either physical or chemical processes.10,14–17 Among them, the ordered mesoporous carbons (OMCs) are flexible materials and are considered to be very attractive as they possess high surface areas with interconnected ordered pore channels that facilitate gas diffusion with ease. This is a unique feature, which distinguishes OMCs from other types of carbonaceous materials including activated carbons. Also, the effect of functionality created in the carbon matrix, such as doping with nitrogen, boron, or other light elements and amine functionalization, is advantageous, particularly at sub-ambient pressures.18
In particular, nitrogen doping has created a keen interest as it is assumed that increased functional groups increase the interaction of incoming acidic CO2 molecules and bind them even more vital. Different groups have studied the adsorption capacity of mesoporous N-doped carbons (designated here as MNCs) made using both soft-template and hard-template methods. The details of precursors used for synthesis, textural properties, and the CO2 adsorption capacities of various ordered mesoporous carbons reported till now are summarized in Table S1.‡ 2,19–40While the soft template studies were mainly limited to using urea-doped phenolic resins as precursors, hard-template methods used precursors such as ethylene diamine, ethyl violet, and melamine–formaldehyde polymers.20–25 Zhou et al.33 studied the effect of pyrolysis in the temperature range of 700–1100 °C on the CO2 adsorption capacity of MNCs and showed that lower pyrolysis temperature is favored for CO2 adsorption. Similar results were obtained with the works of Goel and co-workers, who studied the adsorption behaviors in the temperature range of 500–800 °C and showed that a pyrolysis temperature of 700 °C has shown the maximum adsorption.30
On the other hand, Lakhi et al.41 and Yu et al.42 independently showed using ethylene diamine as a carbon precursor, CO2 adsorption capacity increases with pyrolysis temperature. Saleh et al.39 and Wang et al.40 also studied the effect of pyrolysis temperature using disorder porous activated carbons in the range of 500–800 °C and found a pyrolysis temperature of 600 gave better CO2 adsorption. By considering all these, we can say that a pyrolysis temperature of 600–700 °C is suitable for CO2 adsorption studies. The comprehensive reports of the adsorption of CO2 on template carbons show that the adsorbents are studied only after physical or chemical activation of the prepared carbons, along with the study of the effect of pyrolysis temperature (see Table S1‡). However, the CO2 adsorption performance evaluation in these templated and doped carbons were limited to ambient pressures and temperatures to 0 °C or 25 °C. A small number of reports are available on high-pressure studies of mesoporous pristine and N-doped carbons.19–22 In this regard, the study of CO2 adsorption capacities of ordered mesoporous carbons at high pressures is of keen interest, considering the advantages of these porous materials. Also, the dependence of pore size, pore dimensionality, and nitrogen doping on the adsorption capacity of CO2 is yet to be studied. Taking all this into consideration, in the present study, we have synthesized and characterized various OMCs and MNCs with multiple pore sizes and pore dimensionality. After that, we looked for the possible effects of carbons material synthesis on the CO2 adsorption capacity at high pressures.
Methodology
Starting materials
All the chemicals used were of analytical grade. The surfactants (Pluronic P123; Brij-56, Brij-58 and CTAB), silica source (tetraethyl orthosilicate; TEOS), and carbon source (sucrose) were procured from Sigma-Aldrich. Other chemicals including, ethylenediamine (≥99.5%), carbon tetrachloride (≥99.5%) polyvinylpyrrolidone (PVP) (≥99.0), p-phenylenediamine (≥98.0%), anilines, and pyrrole, toluene, peroxy disulphate, HF (40% aqueous solution), HCl (36% aqueous solution), ammonia solution, were obtained from various chemical resources, viz., Sigma-Aldrich, and SD-fine chemicals.Materials synthesis
The 1-D hexagonal and 3-D cubic OMCs were prepared using the nanocasting method, which employed ordered mesoporous silica as hard templates43–52 and acidified sucrose as a carbon source. Likewise, all the MNCs were also synthesized using SBA-15 silica as a hard template53,54 and the precursors used for synthesizing these N-doped carbons are ethylene diamine, p-diaminobenzene, aniline, pyrrole, and polyvinylpyrrolidone (PVP). The N-doped carbons were also prepared through post-ammonia treatment by exposing the OMCs. All the materials under study were characterized in detail using various structural, textural microscopic, and spectroscopic techniques. Detailed synthesis protocols and characterization techniques are given below.MCM-41. The ordered mesoporous silica (MCM-41) was synthesized hydrothermally as per the following procedure with a typical gel (molar) composition of: SiO2
![[thin space (1/6-em)]](https://www.rsc.org/images/entities/char_2009.gif) :0.27CTAB:0.26TMAOH:0.13NaOH:68H2O.43–45 To this, fumed silica (SiO2) was added slowly to a solution of tetramethylammonium hydroxide diluted with water (TMAOH) to obtain a homogeneous solution A. Solution B was prepared by dispersing cetyltrimethylammonium bromide (CTAB) in aqueous NaOH for about 30 min. Now, solution A and solution B were mixed together under constant stirring for an hour in order to get a homogeneous gel. After adjusting the gel pH to 11.5 the solution was autoclaved for hydrothermal treatment at 100 °C for 24 h. The solid product obtained (as-synthesized MCM-41) was washed with copious amounts of water filtered and dried at 100 °C. In order to remove the surfactant sample was calcined at 550 °C under flowing nitrogen for 1 h and followed by air for 6 h with a heating rate of 1 °C min−1. The resulting sample is designated as MCM-41.
:0.27CTAB:0.26TMAOH:0.13NaOH:68H2O.43–45 To this, fumed silica (SiO2) was added slowly to a solution of tetramethylammonium hydroxide diluted with water (TMAOH) to obtain a homogeneous solution A. Solution B was prepared by dispersing cetyltrimethylammonium bromide (CTAB) in aqueous NaOH for about 30 min. Now, solution A and solution B were mixed together under constant stirring for an hour in order to get a homogeneous gel. After adjusting the gel pH to 11.5 the solution was autoclaved for hydrothermal treatment at 100 °C for 24 h. The solid product obtained (as-synthesized MCM-41) was washed with copious amounts of water filtered and dried at 100 °C. In order to remove the surfactant sample was calcined at 550 °C under flowing nitrogen for 1 h and followed by air for 6 h with a heating rate of 1 °C min−1. The resulting sample is designated as MCM-41.
IITM-56. Mesoporous silica, IITM-56 was synthesized using Brij56 (C16H33(OCH2CH2)10OH) as surfactant with molar gel composition of 1
:11.30:119:1.50 TEOS/HCl/H2O/Brij56.46,47 Typically, 2.0 g of Brij56 was dissolved in 10.0 mL of water and 40.0 mL of 2.0 M dil. HCl solution with stirring at 50 °C for 3 h until a homogeneous solution is obtained. To this solution, 4.4 mL of TEOS was added and stirred at 50 °C for 24 h. This mixture was then subjected to hydrothermal treatment at 100 °C for 24 h followed by filtration and calcined at 550 °C in the air for 6 h at a heating rate of 1 °C min−1 to obtain IITM-56.
SBA-15. SBA-15 was prepared by using the method reported in the literature.48–50 In a typical synthesis, 8.0 g of P123 triblock copolymer was dissolved in 16.0 mL of HCl, and 160.0 mL of water and was stirred for 1 h at 40 °C. To this, 18.0 mL of TEOS was added and the solution was stirred for 20 h at 40 °C. The mixed solution was then put into an autoclave and subjected to hydrothermal treatment for 24 h at 100 °C. The obtained precipitate was filtered, washed with water, dried at 60 °C, and then kept for calcination at 550 °C for 6 h in the air to remove the template.
SBA-11. Mesoporous silica SBA-11 was prepared by adding tetraethoxysilane (TEOS) into a hydrochloric acid solution of Brij58.48 The molar composition was 1
:5.9:193:0.053 TEOS/HCl/H2O/Brij58. Typically, 1.78 g Brij58 was dispersed in 20.0 mL H2O followed by the addition of 80.0 mL 2.0 M HCl. After stirring for 3 h, 6.5 g TEOS was added and the stirring was continued for 48 h at 40 °C. Then the solution was kept for hydrothermal treatment at 100 °C for 48 h. The obtained solid was filtered and dried at 80 °C overnight. SBA-11 was obtained by calcination at 550 °C for 6 h in the presence of an air atmosphere.
KIT-6. KIT-6 was prepared by using the method reported in the literature.55 In a typical synthesis, 6.0 g of P123 triblock copolymer was dissolved in 217.0 g water, 11.85 g of conc. HCl, and was stirred for 1 h at 40 °C. 6.0 g of n-butanol was added at once then the stirring was continued for one more hour. To this, 12.95 g of TEOS was added and the solution was stirred for 24 h at 40 °C. The mixed solution was then put into an autoclave and subjected to hydrothermal treatment for 24 h at 100 °C. The obtained precipitate was filtered hot, washed with water, dried at 100 °C, and then calcined at 550 °C for 6 h in the air to remove the template.
CSI-xxx. The mesoporous silica MCM-41, IITM-56, SBA-15, SBA-11, and KIT-6, are used as the hard templates for the synthesis of mesoporous carbon.56,57 Sucrose and sulphuric acid were used as the carbon source and the dehydrating agent, respectively. First, sucrose (1.25 g) is dissolved in 5.0 mL water then 98% sulphuric acid (0.14 g) is added under stirring. After that 1.0 g of SBA-15 is dispersed in an acid-containing sucrose solution. The slurry is heated at 100 °C for 6 h in an oven and subsequently at 160 °C for another 6 h. This step is repeated with different amounts of substances (0.8 g of sucrose, 0.09 g of sulphuric acid, and 5.0 mL of water). After heating, the dark brown solid product is obtained, which is a composite of carbon and mesoporous silica. This composite material is carbonized at 900 °C under an argon atmosphere for 6 h. The silica template is removed by dissolving the material in a 15% HF solution and then washed with ethanol and dried at 120 °C. For all other carbons' synthesis, the same protocol is followed except that the amount of water added varies from 2.0 to 2.5 mL per gram of template. The obtained resulting template-free carbon materials synthesized from MCM-41, IITM-56, SBA-15, SBA-11, and KIT-6 were designated as CSI-419, CSI-569, CSI-309, CSI-119, and CSI-809, respectively.
CMK-xxx. Likewise, two sets of samples were prepared using the SBA-15 template and sucrose as the source varying the pyrolysis temperature and pyrolysis atmosphere. In the first set of samples, the carbonization was done under an argon atmosphere and the samples were designated as CSI-306 and CSI-309, respectively, for samples carbonized at 600 and 900 °C. For the second set of samples, the carbonization was done under a nitrogen atmosphere, and the samples carbonized at 600 and 900 °C were denoted as CMK-306 and CMK-309.
MNC-316. MNC-316 was synthesized by adopting the following procedure.58,59 Typically ordered mesoporous silica SBA-15 (1.0 g) is mixed with 4.4 g ethylenediamine and 10.8 g carbon tetrachloride. This mixture was subjected to reflux at 90 °C for 6 h to obtain a dark brown solid mixture that was dried and powdered. Further, pyrolysis and etching of the silica template gave the carbon MNC-316.
MNC-326. MNC-326 was synthesized by following the procedure reported.60 The synthesis is done by mixing 1.0 g SBA-15 in 30 mL toluene and then adding 3.24 g p-diaminobenzene and 4.6 g ammonium peroxydisulphate in a round-bottomed flask. The system was kept under reflux for 12 h at 80 °C to obtain a dark solid that was dried and ground into a fine powder. After pyrolysis and template removal we obtain MNC-326.
MNC-336. The sample was prepared via the liquid impregnation method according to a reported method in the literature.61 At first, 6.6 mL of aniline was in absolute ethanol. To this 1.0 g of SBA-15 was added under constant stirring that is continued for another 2 h before adding 20.0 mL of 1 M ammonium persulphate solution. The stirring was continued at room temperature for 12 h for complete polymerization. The resultant mixture was subsequently dried, pyrolyzed, and then the composite was then etched to give MNC-336 carbon.
MNC-346. MNC-346 was synthesized by following the procedure reported earlier.62,63 In brief, 0.1 mL of sulfuric acid was added to a solution of 1.0 mL of pyrrole in 0.5 mL absolute alcohol, to obtain a light-yellow solution that was added to 1.0 g of the SBA-15 template. Thereafter sample was kept at 80 °C in a vacuum for 2 h to evaporate alcohol followed by pre-carbonization at 150 °C for 8 h. The above steps are repeated once again before the sample was carbonized followed by template removal. The resultant sample was denoted as MNC-346.
MNC-356. A modified synthesis used for the preparation of N-doped carbon nanotubes was adopted for the preparation of N-doped OMC using OMS template.64 Solution of 5 g of PVP in 20 mL of dichloromethane was prepared and stirred for 1 h at below 30 °C. Subsequently, 1.0 g of SBA-15 was added and stirred for 6 h at room temperature. The mixture was placed in a drying oven at 70 °C for 6 h. The carbonization and template removal procedures are carried out and the template-free carbon product thus obtained is denoted as MNC-356.
CSI-xxx (NH3). The incorporation of nitrogen was also done by the post-synthesis method using aqueous ammonia as the nitrogen precursor.65 Ordered mesoporous carbons CSI-306, CSI-309, CMK-306 and CMK-309 prepared are used as templates for this purpose. For this, the prepared carbon was taken in a ceramic boat and was heated to 900 °C under an argon atmosphere. Then the flow was changed to NH3/Ar and was maintained at this temperature for 2 h. Then the sample was allowed to auto-cool under an argon atmosphere and collected. The activated samples were designated as CSI-306 (NH3), CSI-309 (NH3), CMK-306 (NH3) and CMK-309 (NH3).
Materials characterization
All the samples were systematically characterized using various analytical, spectroscopic, and imaging techniques. Powder X-ray diffraction (XRD) measurements were carried out on a Rigaku Miniflex II desktop model advanced powder X-ray diffractometer with a Cu Kα (λ = 1.5406 Å) radiation source, operating at 30 kV and 15 mA with a scanning rate 0.5° min−1. Nitrogen adsorption–desorption isotherms were obtained at 77 K on a Micrometrics ASAP 2020 apparatus. Prior to the analysis, all samples were treated at 200 °C for 10 h. The specific surface area of the samples was calculated according to the Brunauer–Emmet–Teller (BET) method, and pore size distribution curves were obtained from the analysis of the desorption branch of nitrogen adsorption isotherms using Barrett–Joyner–Halenda (BJH) method. TEM studies were carried out on a 2100 JEOL microscope operated at 200 kV. The samples for TEM studies are prepared by coating the carbon on 200 mesh lacey foam coated copper grid. Elemental analysis was done using PerkinElmer 2400 Series CHNS/O analyzer. X-ray photoelectron spectroscopy (XPS) measurements were performed with an Omicron Nanotechnology spectrometer with the hemispherical analyzer. The Al Kα X-source was operated at 15 kV and 20 mA. For the narrow scans, the analyzer pass energy of 25 eV was applied. The base pressure in the analysis chamber is 5 × 10⁻¹⁰ torr.CO2 sorption measurements
Carbon dioxide uptake capacity was performed on a Micrometrics HPVA apparatus. Pre-treatment of the samples was done overnight at 200 °C under vacuum (10−7 bar) conditions. CO2 uptake capacity measurements were performed using ultra-high pure CO2 (99.9995%) at 0 °C and room temperature, and up to 45 bar in pressure.Modelling studies
The synthesized ordered mesoporous carbons and N-doped carbons were then subjected to high-pressure carbon dioxide sorption studies that were obtained at 0 °C and 25 °C in the pressure up to 45 bar.T0 = 273 K, ‘n’ and ‘nmax’ are the equilibrium adsorption and maximum adsorption amounts, respectively, ‘b’ is the equation constant, ‘T’ is the temperature in Kelvin, ‘R’ is the universal gas constant and ‘p’ is the equilibrium pressure. If the value of t = 1, then the isotherm reduces to the Langmuir adsorption isotherm equation. The parameter ‘t’ represents the heterogeneity factor in the current study. The more the value of t deviates from 1 more heterogeneous the system is said to be. The parameters have been determined through the nonlinear curve fitting technique. The objective function used for fitting is given as:
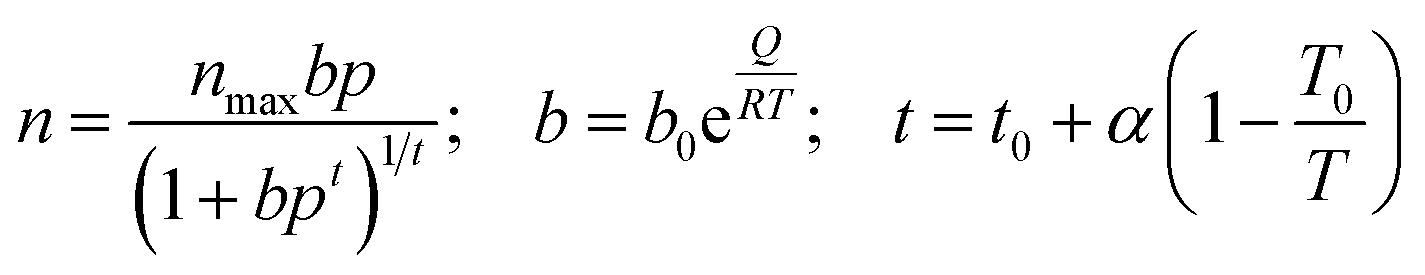
The parameters are represented in Table S2‡ with objective function values. The objective is defined as the above expression for 0 °C and 30 °C temperatures. The ‘nex’ denotes the experimental excess adsorption, ‘nm’ is the model predicted value and ‘i’ is the number of pressure points used. For all OMCs and MNCs, the isotherm modelling was performed to 30 bar for uniformity.
Results and discussion
OMCs
The HR-TEM images of various pristine OMCs including 1-D hexagonal and 3-D cubic structures are shown in Fig. 1 to illustrate the periodicity of the mesoporous structure. Fig. 1a–f depicts the nanoscopic images of 1-D hexagonal carbons in which the projections aligned parallel (100 planes) to the electron beam appear as closely spaced dots, which is direct evidence for the periodic arrangement of the prepared carbons. Parallel running strips with uniform thickness are seen in all images corresponding to the tubular arrays of ordered mesoporous carbons aligned perpendicular (110 planes) to the electron beam. Fig. 2 and 3 depict the corresponding XRD profiles with well-resolved reflections typical of 1-D hexagonal structure indicating that the mesoscopic order of the materials and the typical type IV N2 adsorption–desorption isotherms with characteristic H2 hysteresis are presented in Fig. S1 and S2.‡ The calculated pore sizes are given in Table 1 which are concurrent with the pore sizes calculated from TEM. Interestingly, the 1-D hexagonal OMCs exhibit three different pore sizes, viz., CSI-419 (1.9 nm), CSI-569 (2.9 nm), and CSI-309 (3.8 nm), which is clearly evidenced from the pore size distribution plots as shown in the insets of Fig. S1.‡ The values of surface area and total pore volume given in Table 1 indicate that all three carbons (CSI-419, CSI-569, and CSI-309) possess almost similar values. At this juncture, it is to be noted here that, out of the total surface area, 10% is comprised of micropores. On the other hand, the TEM images (see Fig. 1e and f) and BJH pore size distributions of 3-D cubic carbons (see Fig. S2‡ inset) show that both CSI-119 and CSI-809 are having a similar pore size of ∼3.8 nm with CSI-119 (1168 m2 g−1) having slightly higher surface area than CSI-809 (1068 m2 g−1).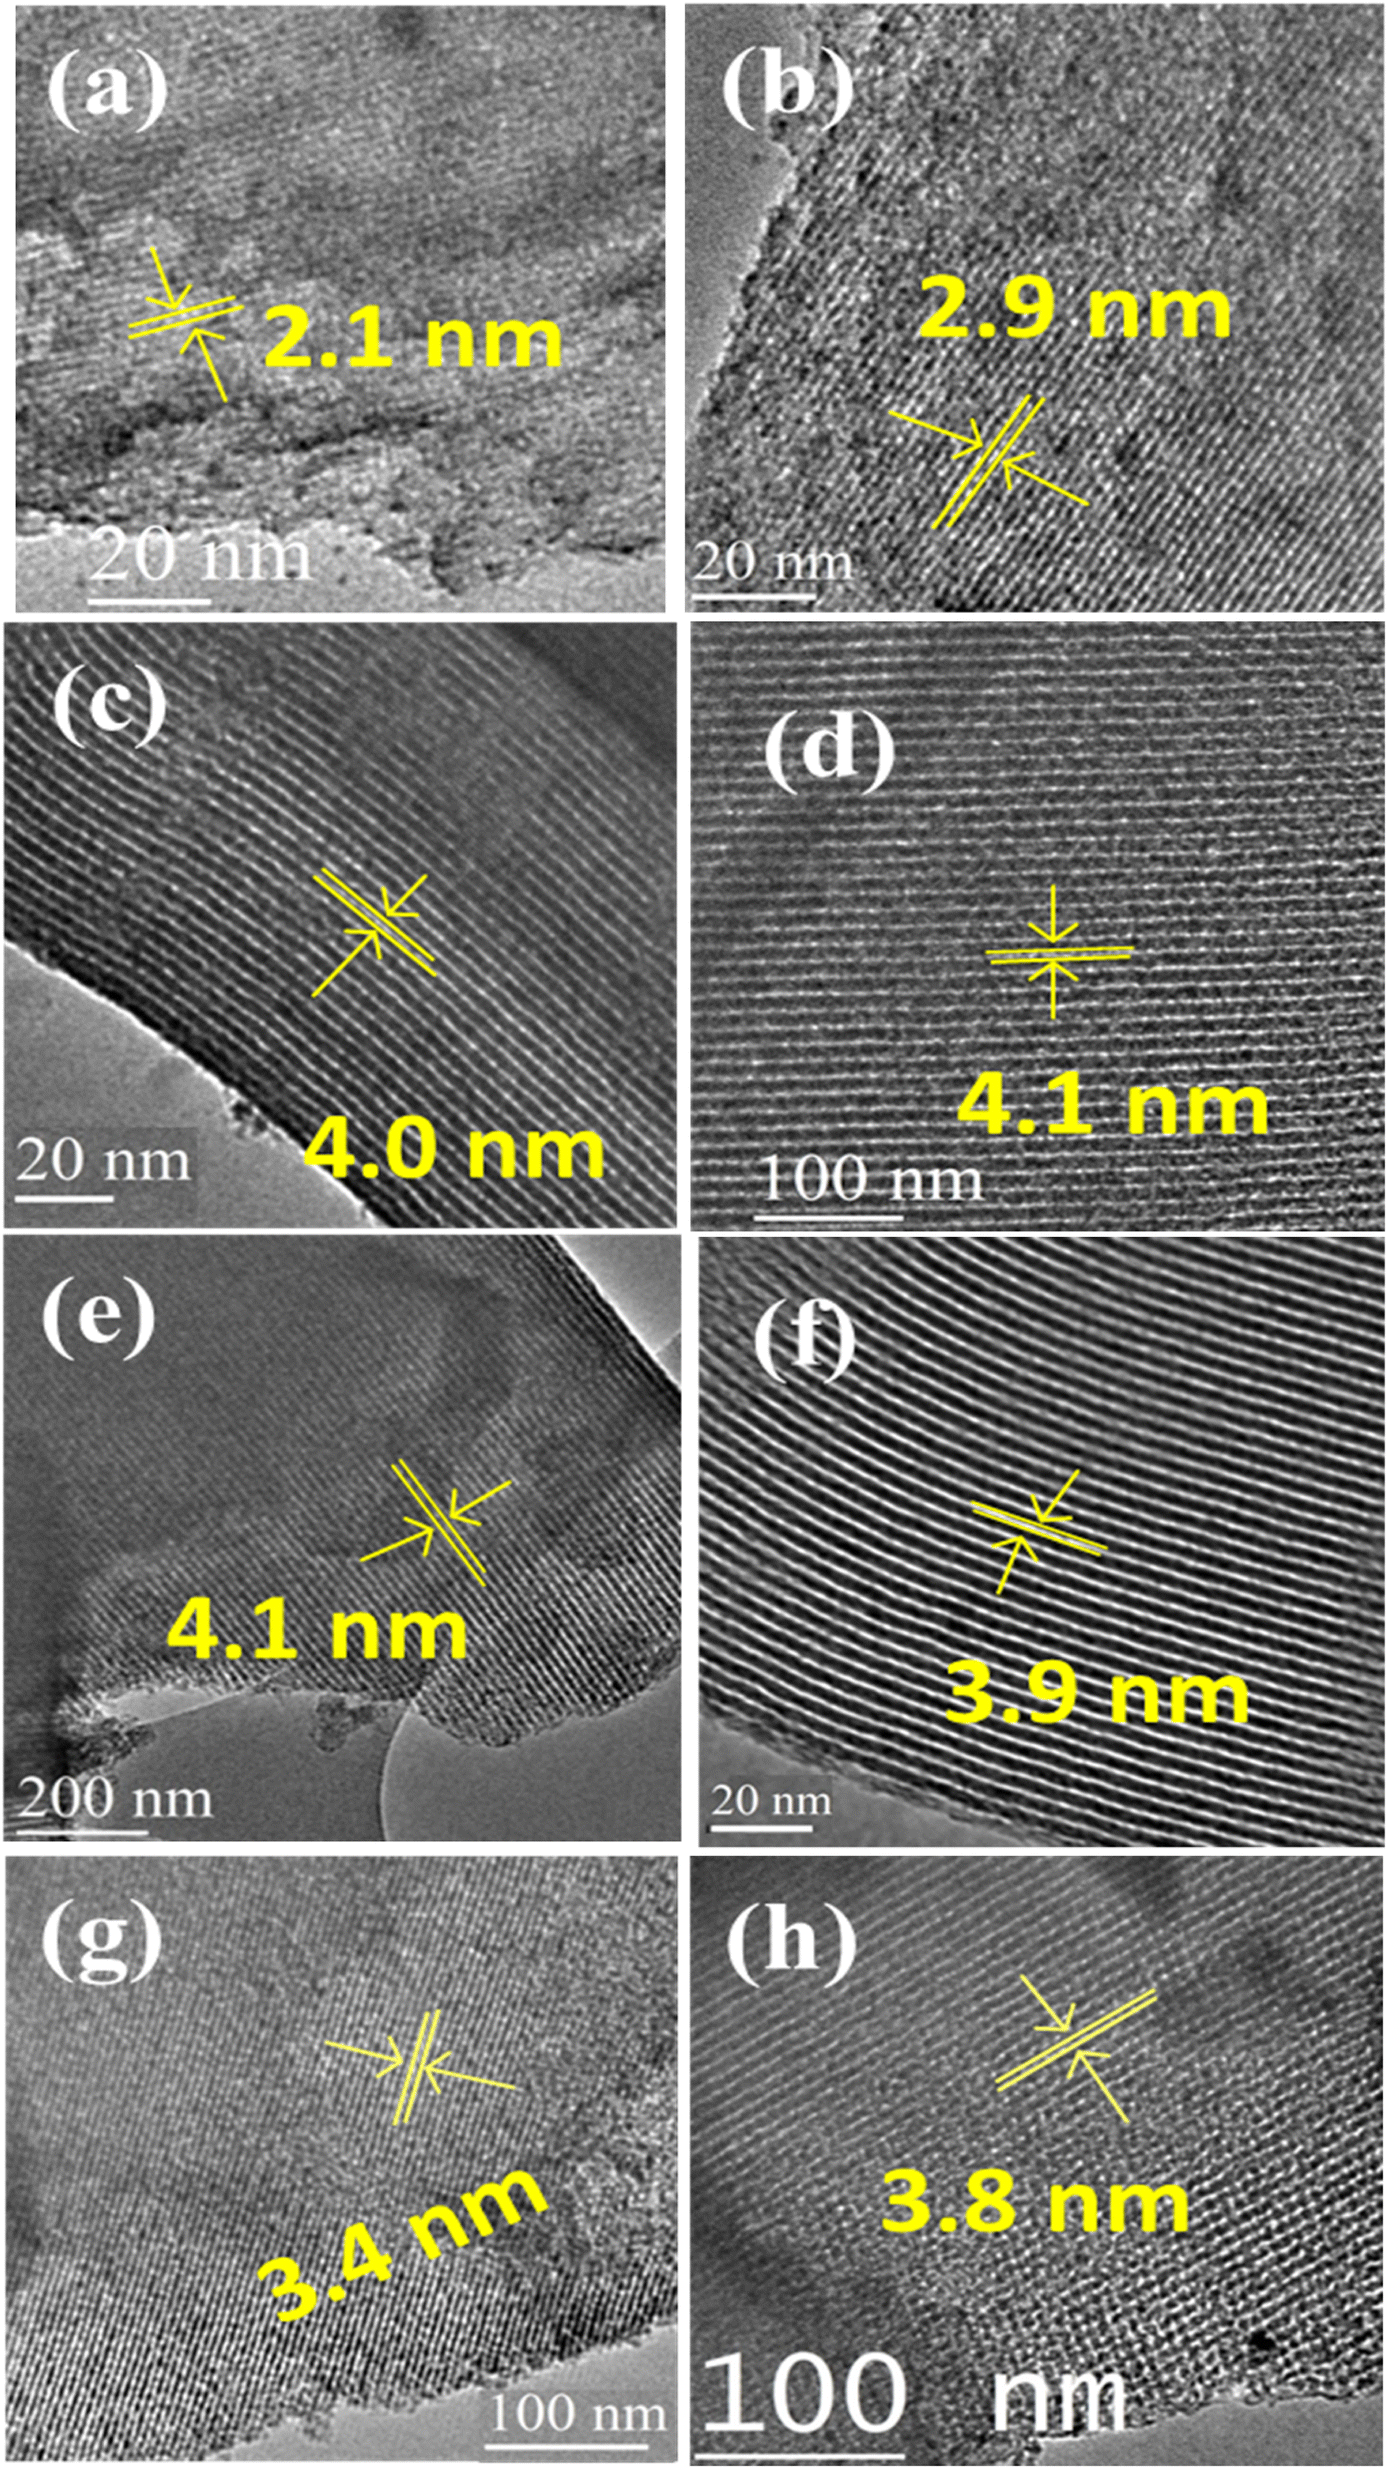 | ||
| Fig. 1 HRTEM images of different pristine ordered mesoporous carbons synthesized: (a) CSI-419, (b) CSI-569, (c) CSI-309, (d) CMK-309, (e) CSI-306, (f) CMK-306, (g) CSI-119 and (h) CSI-809. | ||
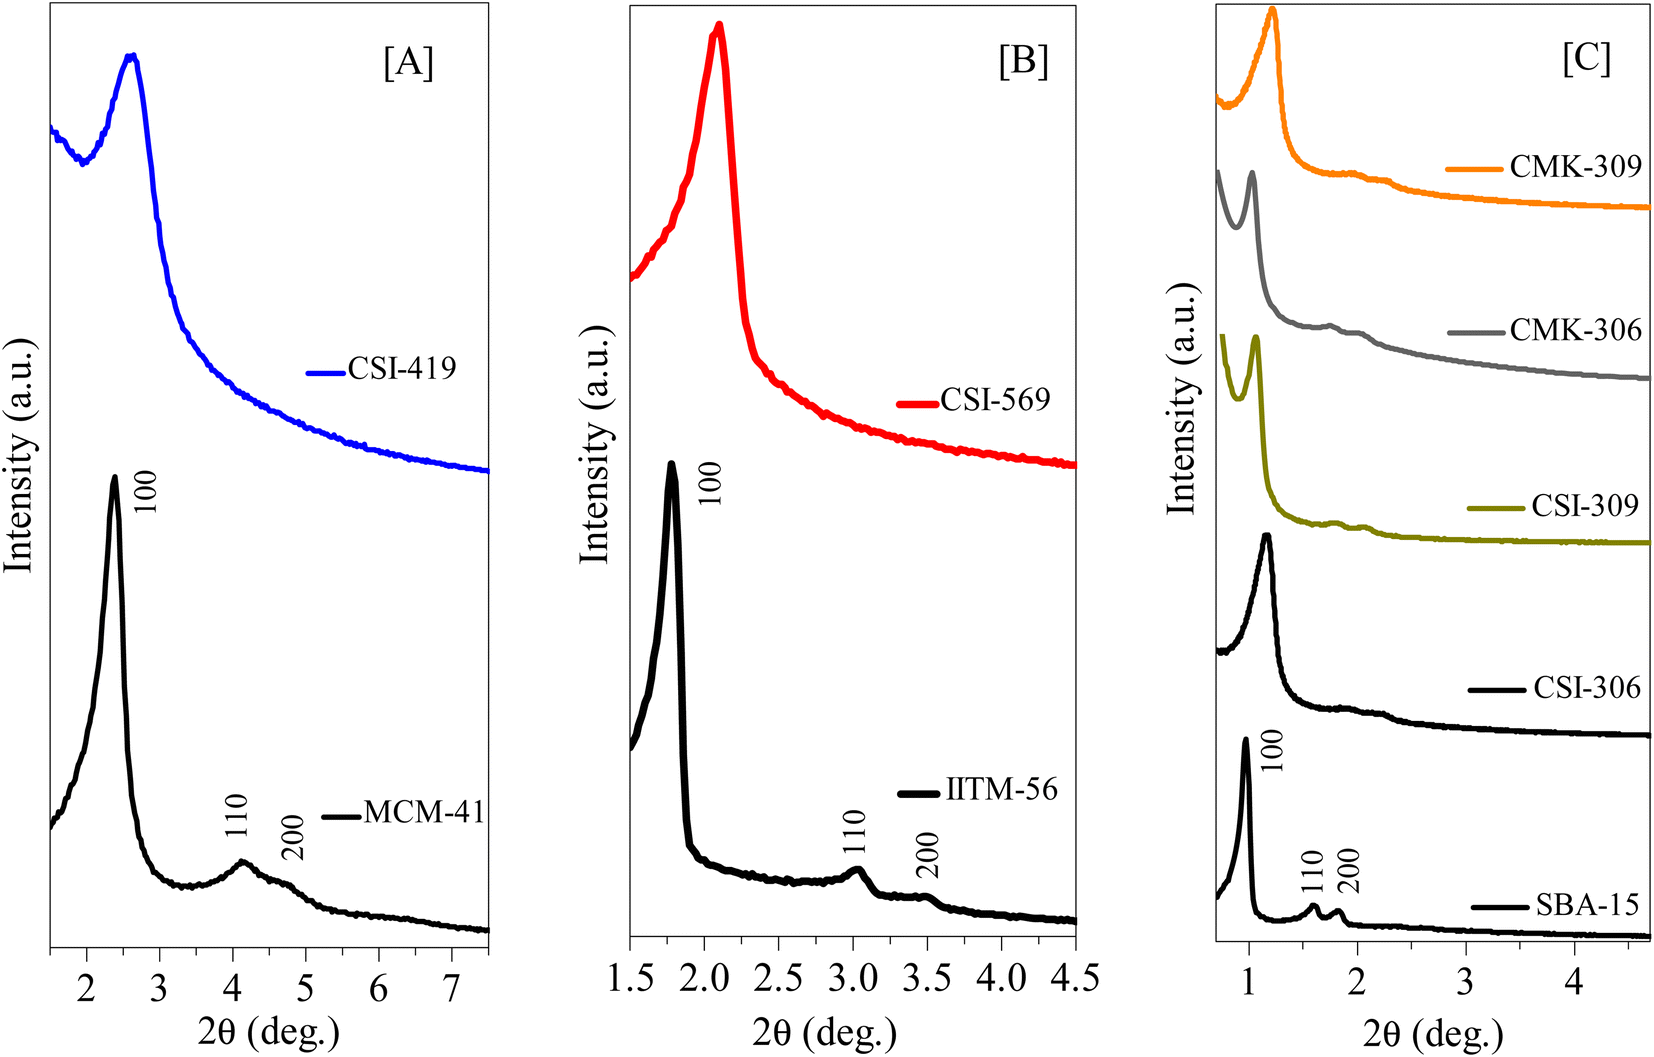 | ||
| Fig. 2 Low-angle XRD diffraction patterns of various 1D-hexagonal ordered mesoporous silicas, carbons, and nitrogenous carbons. (A) Small mesopore structures of pristine OMS and OMC, (B) intermediate mesopore structures of pristine OMS AND OMC, and (C) large mesopore structures of pristine OMS and OMC, and N-doped OMC. See also Tables 1 and S3.† | ||
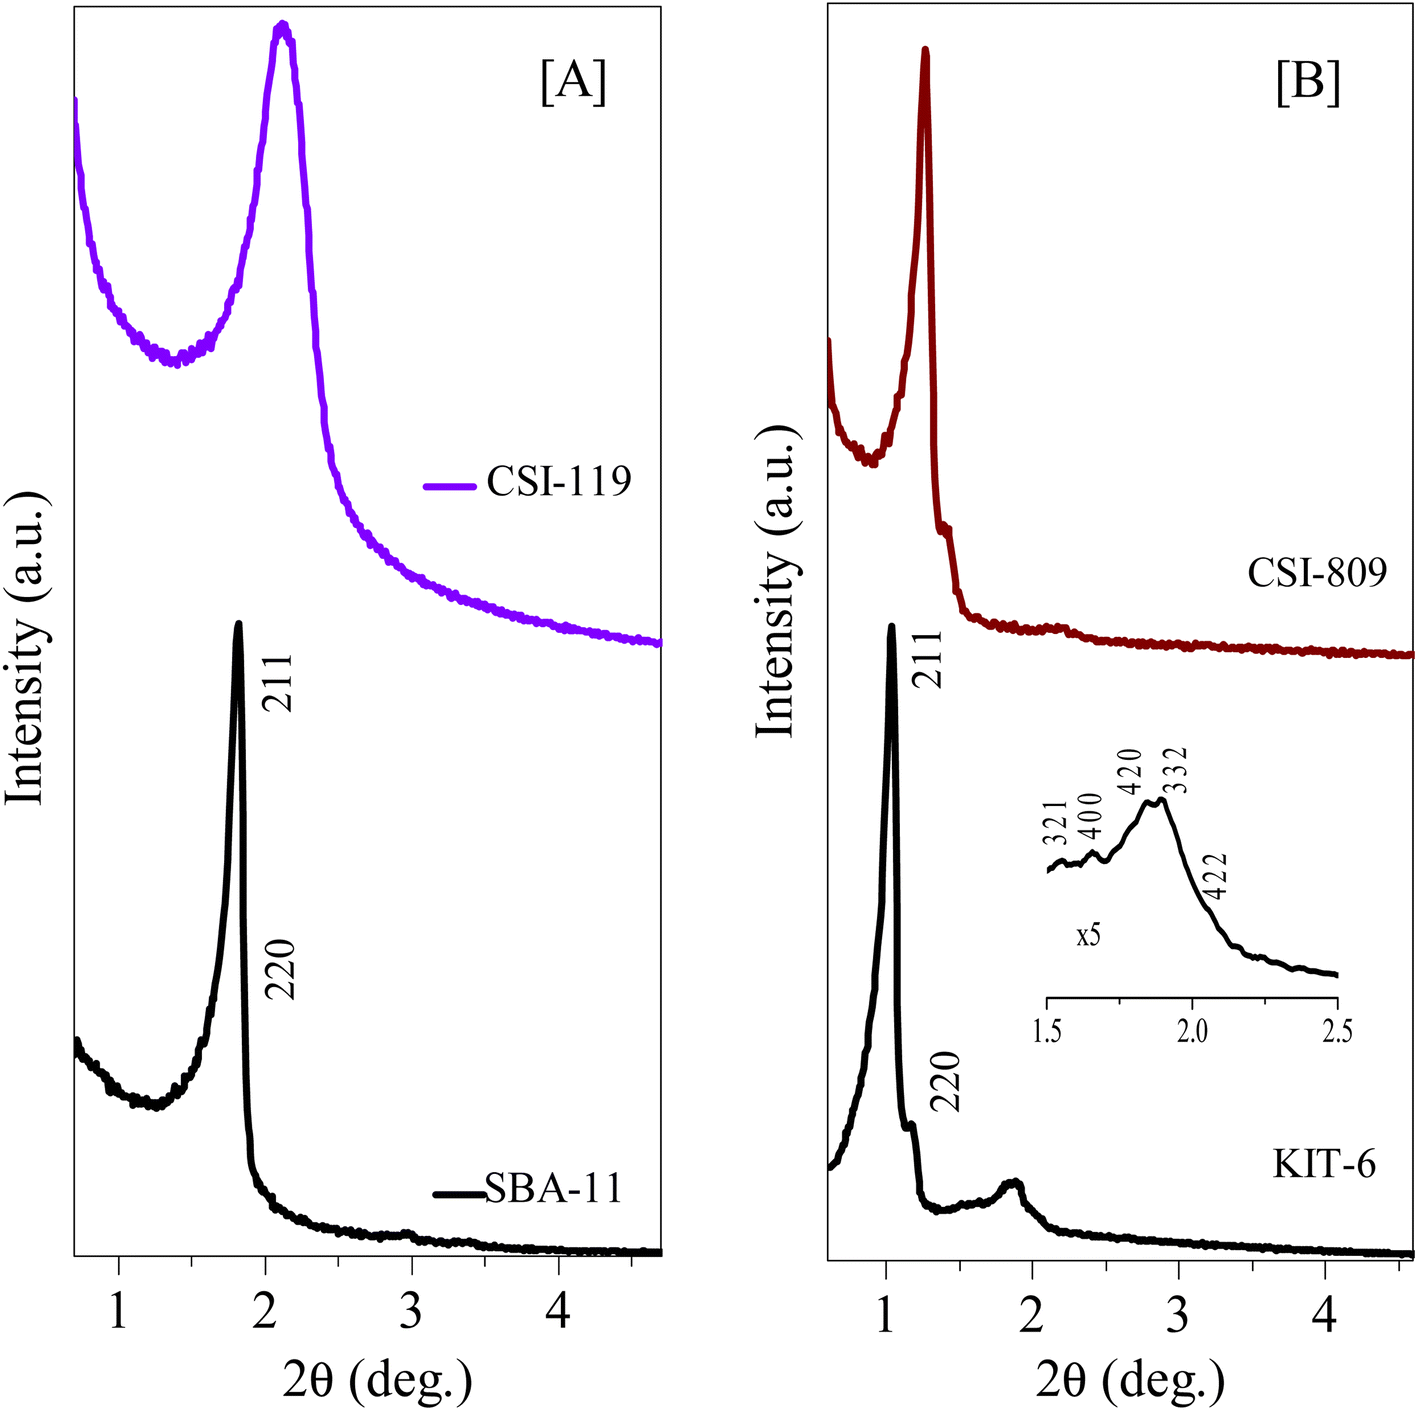 | ||
| Fig. 3 Low-angle XRD diffraction patterns of various 3D-cubic ordered mesoporous silicas and carbons. (A) Small mesopore structures of pristine OMS and OMC, and (B) large mesopore structures of pristine OMS and OMC. See also Tables 1 and S3.† | ||
| Adsorbent | STotal (m2 g−1) | SMicro (m2 g−1) | VP (cm3 g−1) | DBJH | DTEM | Elemental compositionb | CO2 uptake (mmol g−1) | ||
|---|---|---|---|---|---|---|---|---|---|
| Carbon (at%) | Nitrogen (at%) | 30 °C (45 bar) | 0 °C (34 bar) | ||||||
| a STotal = BET surface area; SMicro = micropore surface area determined from the t-plot; VP = total pore volume; DBJH = pore diameter (nm).b From CHNS elemental analysis data. | |||||||||
| CMK-306 | 1027 | 208 | 0.84 | 3.8 | 3.9 | 81.7 | 1.80 | 16.3 | 25.4 |
| CMK-309 | 1009 | 105 | 0.98 | 4.0 | 4.1 | 91.1 | 0.68 | 14.4 | 24.4 |
| CSI-306 | 1138 | 145 | 0.91 | 3.8 | 4.1 | 81.2 | 0.19 | 22.5 | 27.5 |
| CSI-309 | 1022 | 217 | 1.14 | 3.8 | 4.0 | 93.2 | 0.12 | 17.8 | 25.4 |
| CSI-419 | 1079 | 37 | 0.48 | 1.8 | 1.7 | 89.8 | 0.48 | 13.3 | 16.9 |
| CSI-569 | 1036 | 20 | 0.16 | 2.9 | 2.3 | 94.5 | 0.66 | 9.8 | 13.2 |
| CSI-809 | 1068 | 83 | 0.73 | 3.8 | 3.8 | 89.1 | 0.73 | 10.7 | 15.5 |
| CSI-119 | 1168 | 106 | 0.32 | 3.7 | 3.8 | 92.5 | 0.32 | 14.8 | 20.7 |
Furthermore, the influence of variation in pyrolysis atmosphere (nitrogen and argon) and different pyrolysis temperatures (600 and 900 °C) on high-pressure CO2 storage is also investigated for various OMCs such as CSI-306, CSI-309, CMK-306, and CMK-309. For this purpose, the various OMCs were carefully synthesized and systematically characterized. Fig. 2C depicts the characteristic XRD patterns with unique TEM images (see Fig. 1) and the typical type IV N2 adsorption–desorption isotherms (Fig. S3‡) with H2 hysteresis. The textural properties and elemental analysis data are listed in Table 1. Fig. 4 depicts the core-level N (1s) XP spectra for the various mesoporous carbon samples prepared under different experimental conditions. It is interesting to note from Fig. 4A that, unlike CMK-306 and CMK-309, the samples CSI-306 and CSI-309 show no signals corresponding to nitrogen functionality, which is consistent with the elemental compositions of nitrogen (0.2 wt%; Table 1). This observation evidently specifies that the OMC samples pyrolyzed in a nitrogen atmosphere show doping of a small amount nitrogen in the porous carbon matrix.
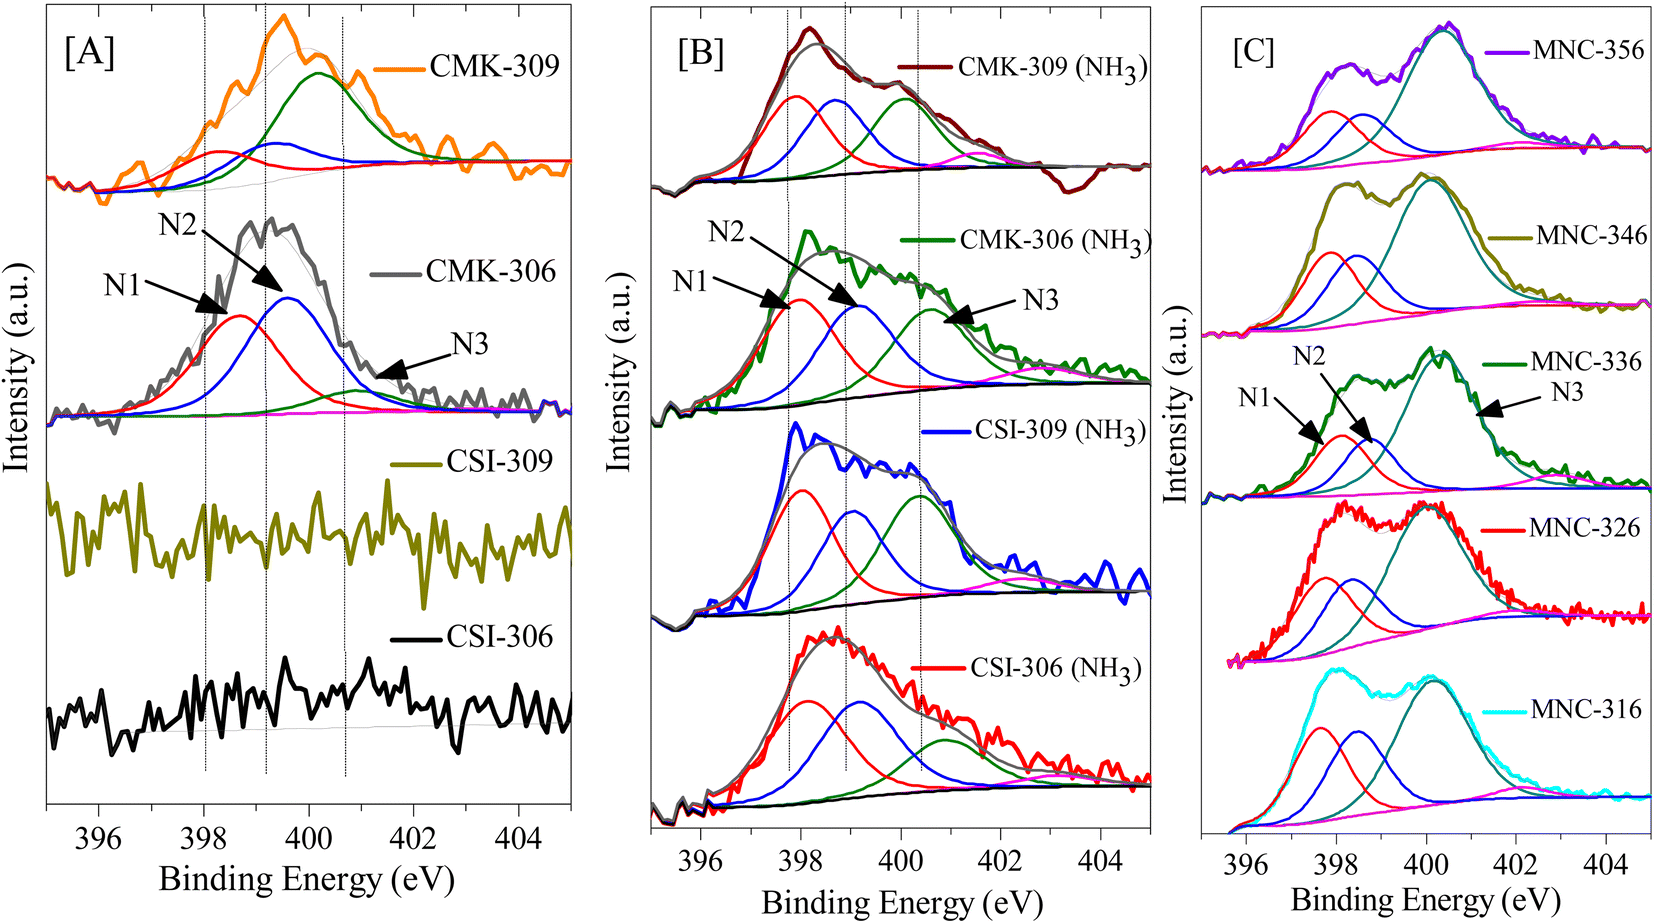 | ||
| Fig. 4 N(1s) core level XP spectra of various porous carbons: [A] pristine OMC; [B] CO2-activated OMC; [C] N-doped OMC. The signals marked by arrows represent different kinds of nitrogen species present in N-doped carbon showing phenanthridinic-(N1), acridinic-(N2), and graphitic-(N3) type nitrogen. | ||
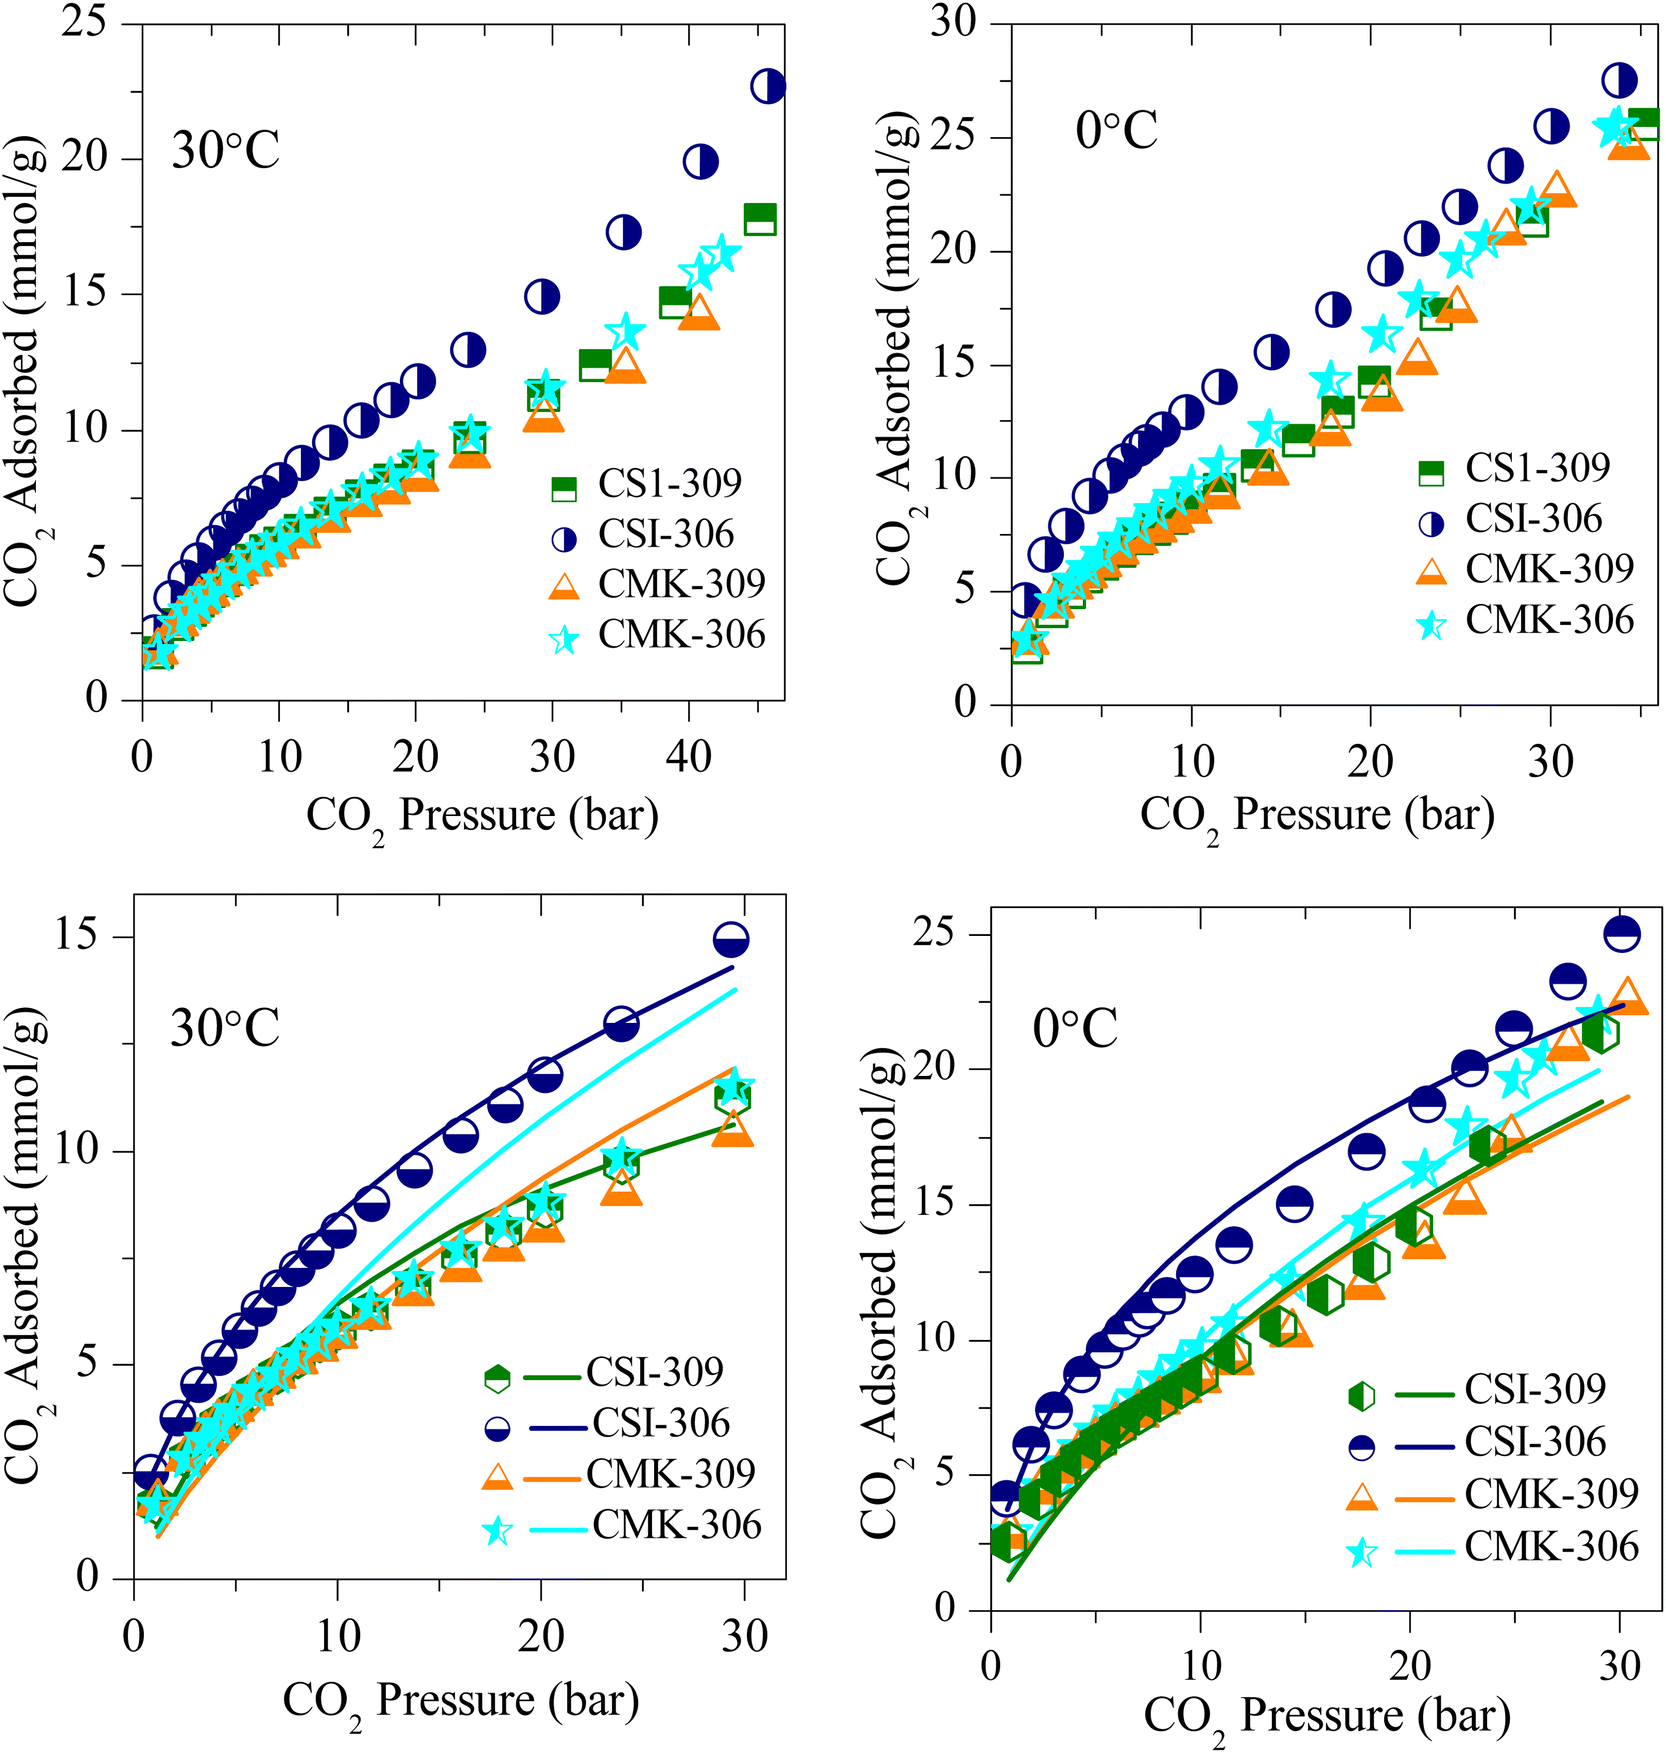
The CO2 adsorption isotherms of various OMCs and the model data both at 0 and 30 °C are presented in Fig. 5–7, S4 and S5.‡ The parameters used to model the experimental data are shown in Table S2.‡ As seen in Fig. 5, the adsorption capacity at room temperature and 45 bar of 1-D hexagonal carbon adsorbents follow the order: CSI-309 (17.8 mmol g−1) > CSI-419 (13.3 mmol g−1) > CSI-569 (9.8 mmol g−1). The presence of mesoporous channels greater than 3 nm in CSI-309 mainly contributes to the higher adsorption. Further, the adsorption temperature decreases, the adsorption capacities increase as the intermolecular repulsions are slowed down at lower temperatures. This is consistent with the adsorption capacities shown both at 0 and 30 °C (Fig. 5). At room temperature, the adsorption increases monotonically with pressure. In contrast, at 0 °C, we have observed a linear increase with an unsaturated curve due to the pore filling at this temperature. The unsaturation in the curve indicates that at this temperature the catalysts are capable of higher CO2 uptake at higher pressures. The CO2 adsorption capacity of 1-D hexagonal carbons is seen to decrease with the pore size, suggesting that a pore size of above 3 nm is desirable for sufficient CO2 uptake at high pressures. On the other hand, the cubic carbons (Fig. 6) have shown an adsorption capacity of 20.4 and 15.4 mmol g−1, respectively. Although the pore size is similar to that of 1-D hexagonal carbon CSI-309, the CO2 adsorption capacities of cubic carbons (CSI-809, CSI-119) are lower than corresponding 1-D hexagonal carbons. Similar behaviour was also observed with the hydrogen sorption system.50,51 In addition, it can also be seen from these figures that, unlike CMK-306, the sample CSI-306 exhibit highest CO2 uptake (Fig. 7) which could possibility be attributed to the low or no nitrogen content in the sample as it was fired in inert (argon) atmosphere. The former exhibit a lower capacity owing to the inerrant presence of nitrogen in the matrix upon firing in nitrogen atmosphere. The observed findings could be attributed to the presence of nitrogen in the carbon network which is in agreement with the results are obtained for the microporous activated carbons24,68 and slit pore-type graphitic pristine and N-doped carbons69 wherein it was shown that the nitrogen present in the carbon has no influence or negative influence on CO2 uptake or it is considered to be detrimental for this purpose. Therefore, it is clear from both literature data and our own experimental data that nitrogen doping negatively affects the CO2 adsorption capacity in porous carbons. CSI-306 has shown an adsorption capacity of 27.5 mmol g−1 of at 0 °C and 34 bar. A comparison of the different reports on CO2 adsorption on pristine OMC is made in Table S1,‡ which shows that the present result on CSI-306 material is the highest reported in pristine OMCs which is associated with the large surface area and possibly with the presence of oxygen functionality. In fact, there is the possibility of the quadrupole–lone pair interaction between CO2 and O2, which would increase the binding affinity of the CO2. This is clearly evidenced for CSI-306 (Fig. 7) which show an increased CO2 uptake owing to the presence of intrinsic oxygen functionality as the sample CSI-306 was prepared under nitrogen-free atmosphere. Hence, the higher surface area of carbons, i.e., the samples pyrolyzed at 600 °C, is the key to higher CO2 adsorption capacities.
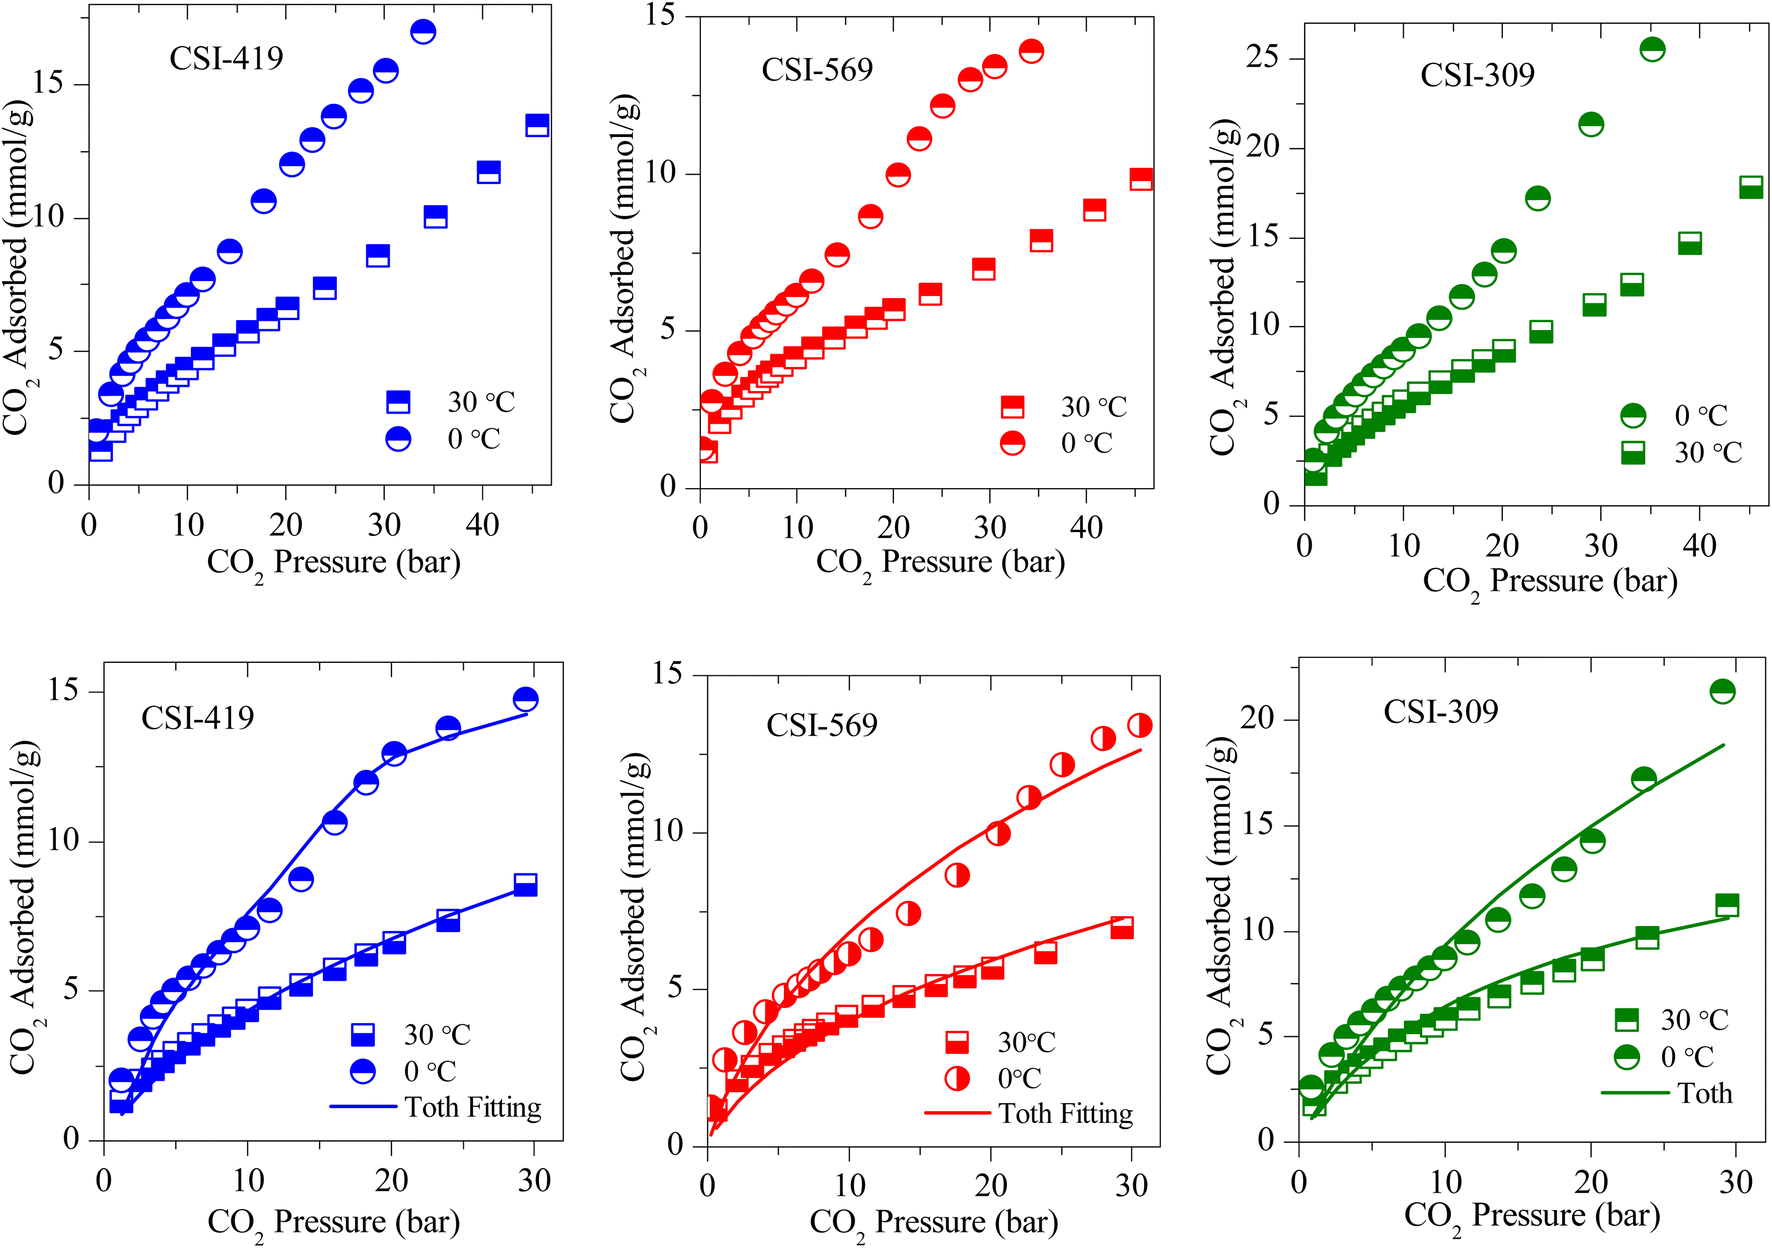 | ||
| Fig. 5 (Above) Experimental CO2 excess adsorption isotherm and (Below) modified Toth fit (solid lines) measurements of 1-D hexagonal OMC. | ||
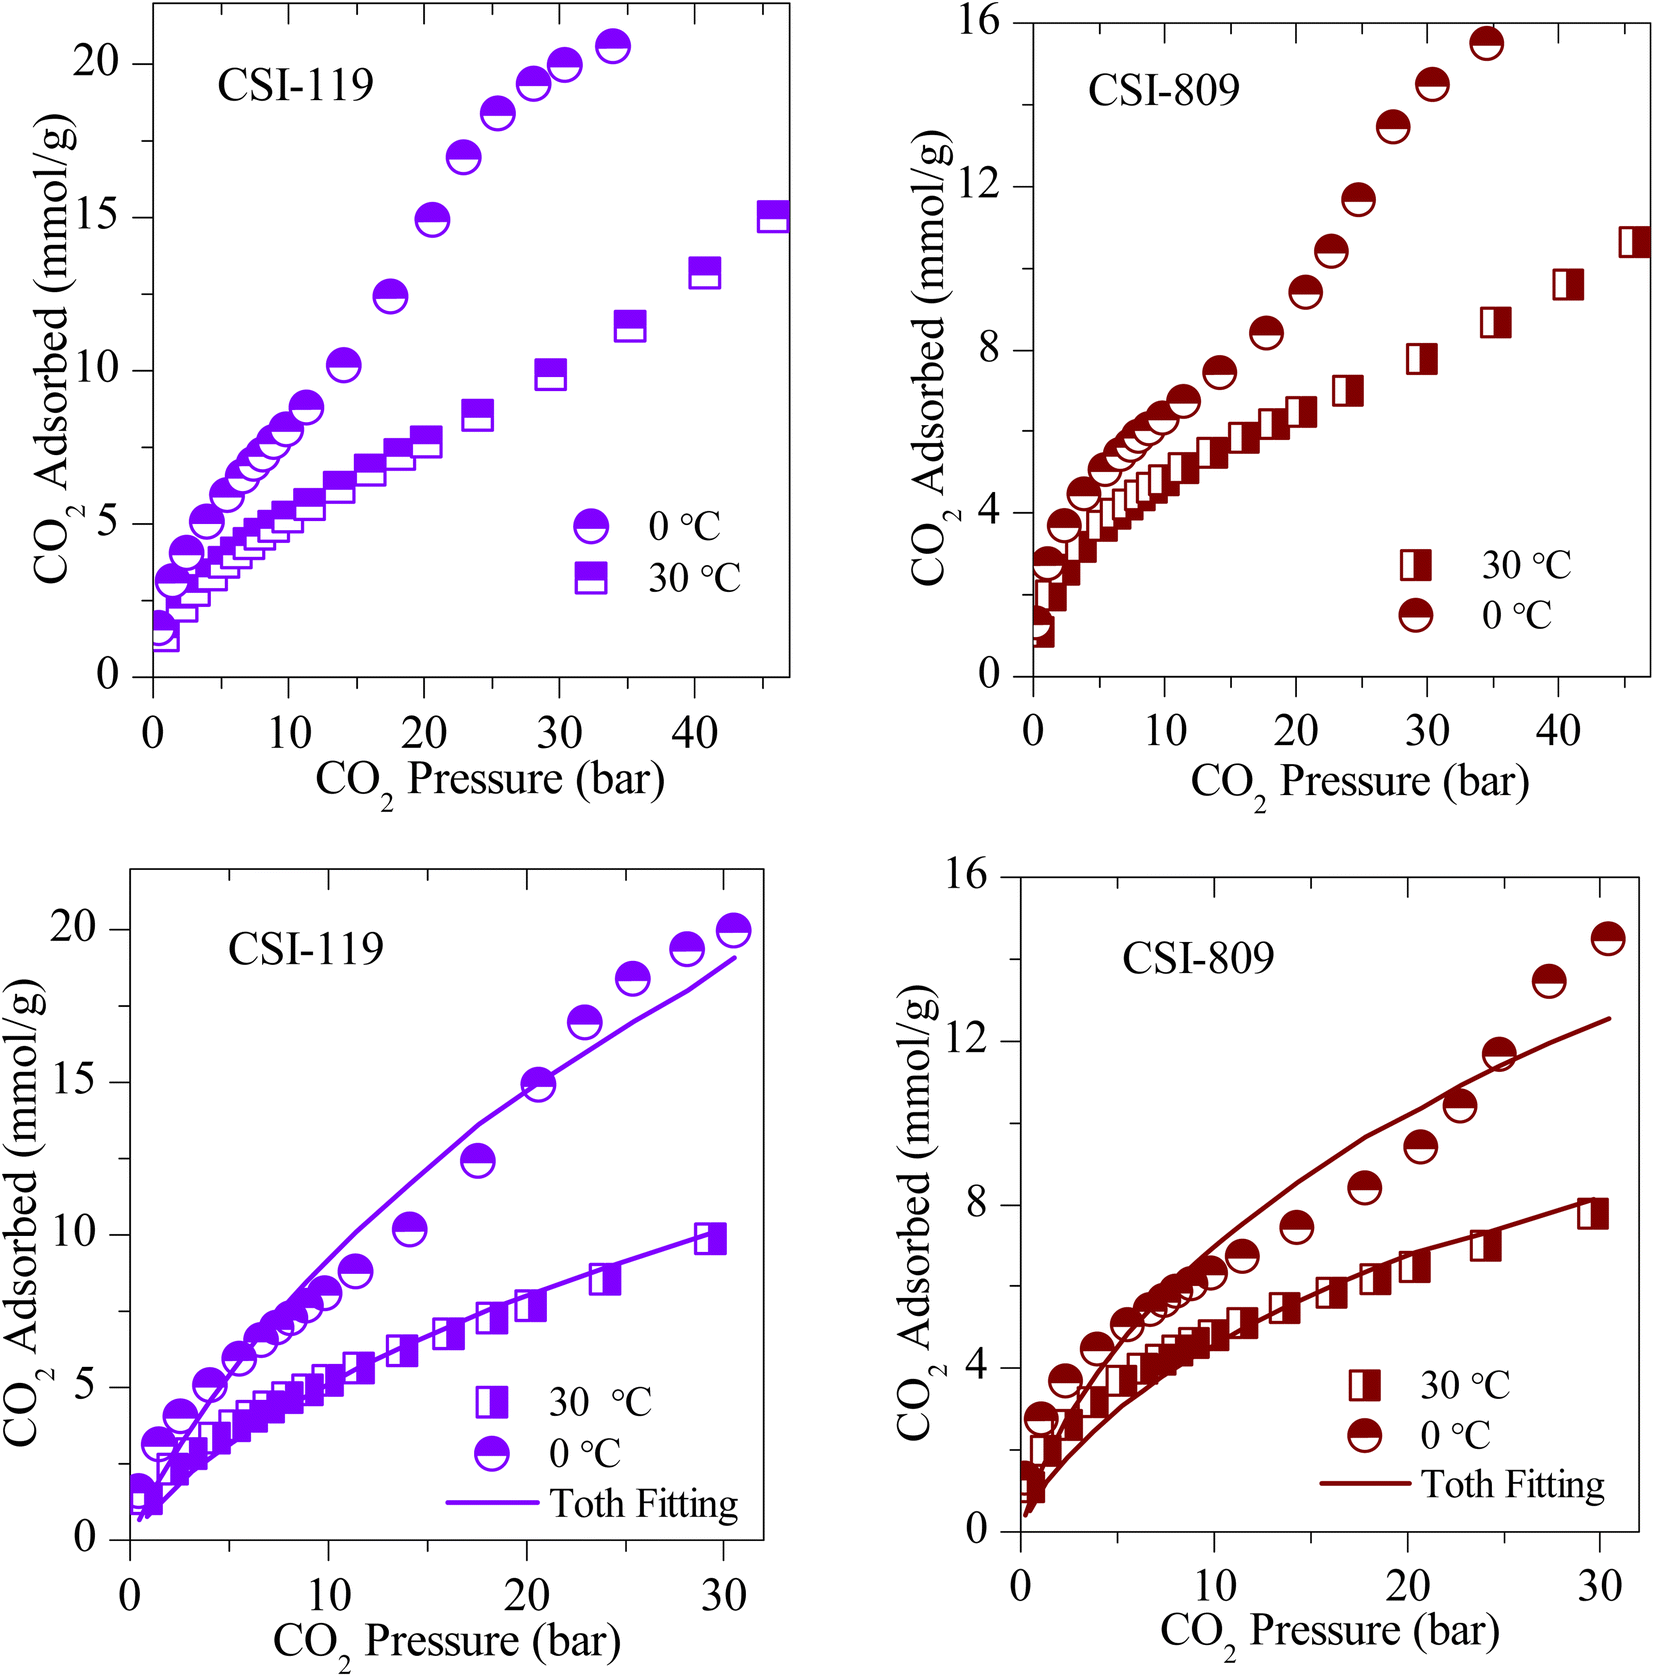 | ||
| Fig. 6 (Top) Experimental CO2 excess adsorption isotherm and (Bottom) modified Toth fit (solid lines) measurements of 3-D cubic OMS. | ||
 | ||
| Fig. 7 Experimental CO2 excess adsorption isotherm measurements (solid symbols) and modified Toth fit (solid lines) of OMC prepared at different reducing atmospheres and different pyrolysis temperatures at RT and 0 °C. | ||
N-doped OMCs
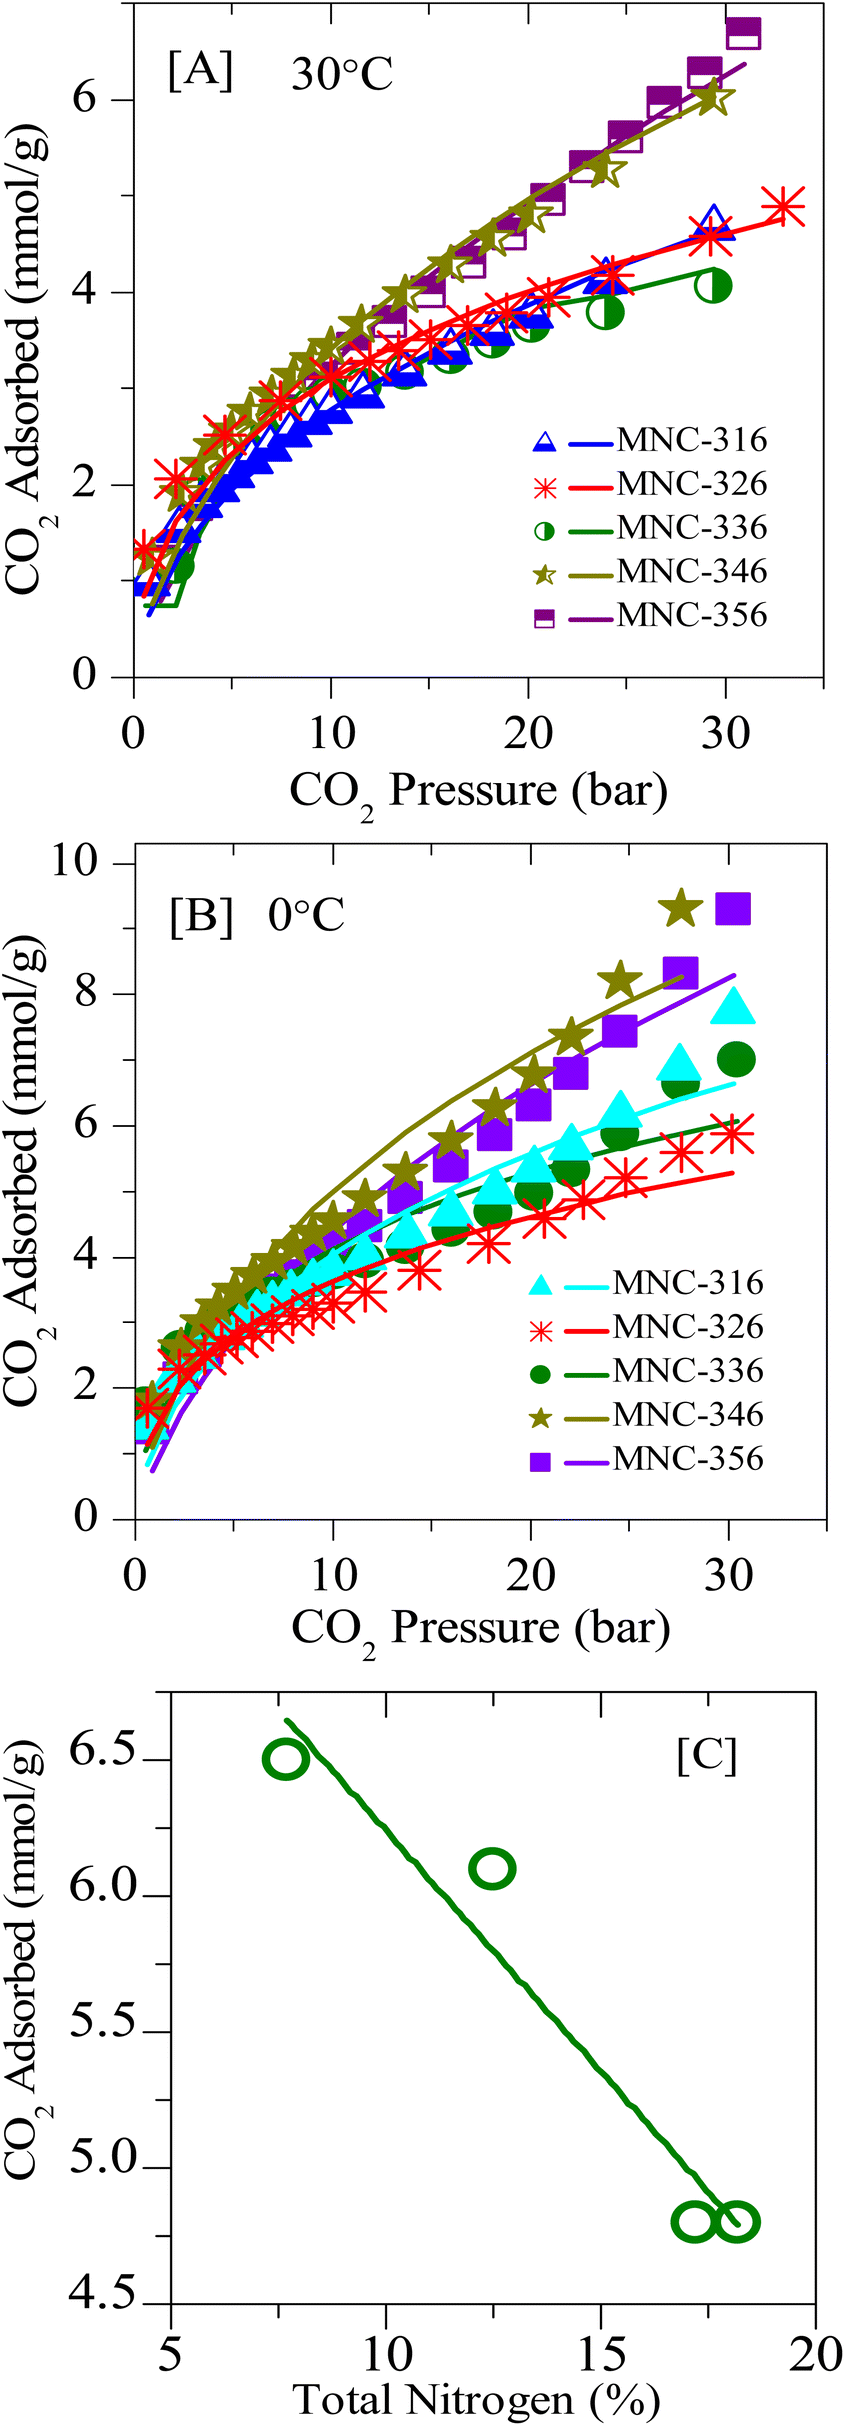
In order to study the effect of N-doping in detail, several N-doped ordered mesoporous carbons, designated as MNC-3x6, were synthesized and investigated for CO2 capture. Fig. 8 and 9 represent the typical XRD patterns and TEM images of these ordered mesoporous nitrogenous carbons, respectively. Both projections aligned parallel (100 planes) and perpendicular (110 planes) to the electron beam can clearly be visualized in these images which imply a highly ordered nature and unimodal pore size distribution. The deduced pore sizes from these images match with the BJH pore size distributions calculated from the N2-sorption isotherms (Fig. S6‡), and the corresponding data are represented in Table 2. It can be seen from this table that these MNCs have a surface area between 450–600 m2 g−1, with a pore size of around 3.6 nm. The nitrogen content was determined using elemental analysis and showed a total nitrogen content between 9–18 wt% (Tables 1 and 2). All these N-doped carbons were subject for CO2 storage in the pressure range of 0–45 bar at RT and between 0–35 bar at 0 °C. Fig. 10A, B, S7, and S8‡ present the CO2 isotherms, and it can be noticed that the adsorption capacity for all these nitrogen-doped carbons is far less than the corresponding undoped analogue, CMK-306. Indeed, the decrease in surface area is proposed to be the primary reason for this decrease besides a large amount of nitrogen content. The inclination of CO2 adsorption with the total nitrogen-doped in the carbons is plotted and is shown in Fig. 10C. From this figure, it was observed that as the total nitrogen in the carbon decreases, the CO2 adsorption capacity increases. This is in agreement with our results with pristine carbons. Similar results are seen from the study of Lakhi et al.41,42 wherein with the increase in pyrolysis temperature, a decrease in the nitrogen content and an increase in carbon dioxide adsorption capacity is perceived. Additionally, as indicated earlier (see OMC section), there is the possibility of the quadrupole–lone pair interaction between CO2 and O2, which would increase the binding affinity of the CO2. This is clearly evidenced in MNC-356 (Fig. 10), which show an increased CO2 uptake within the respective groups owing to the presence of intrinsic oxygen functionality owing to the fact that, unlike all other N-doped OMCs, the sample MNC-356 is prepared using oxygen/nitrogen-containing precursor.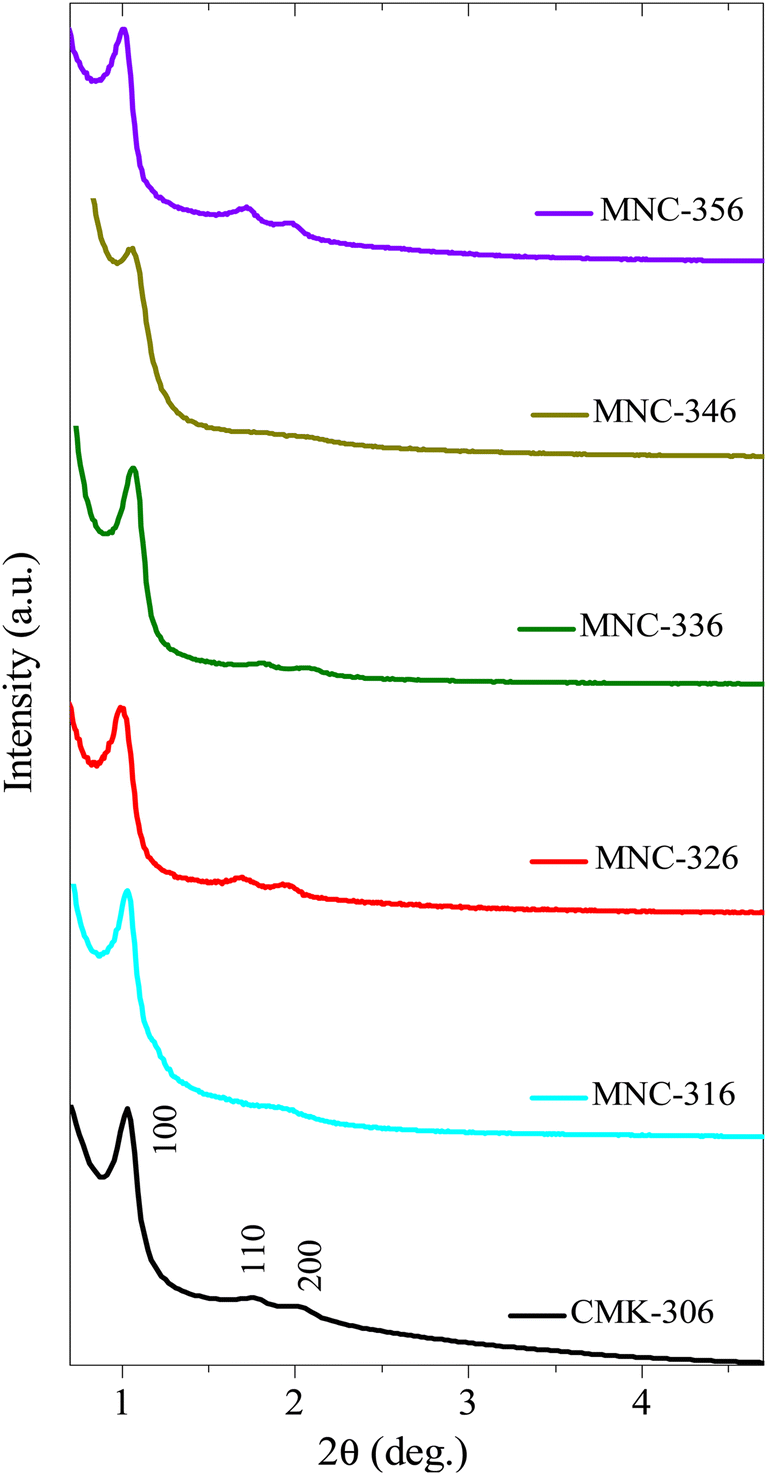 | ||
| Fig. 8 Low-angle XRD diffraction patterns of various N-doped/nitrogenous 1D-hexagonal ordered mesoporous carbons. | ||
| Adsorbent | STotal (m2 g−1) | SMicro (m2 g−1) | VP (cm3 g−1) | DBJH | DTEM | Elemental compositionb (at%) | CO2 uptake (mmol g−1) | ||||
|---|---|---|---|---|---|---|---|---|---|---|---|
| Carbon | Total N (N1 + N2 + N3) | Pyridinic-N (N1 + N2)c | Graphitic-N (N3)c | 30 °C (45 bar) | 0 °C (34 bar) | ||||||
| a STotal = BET surface area; SMicro = micropore surface area determined from the t-plot; VP = total pore volume; DBJH = pore diameter (nm).b From CHNS elemental analysis data.c From N(1s) XPS data – see also Fig. 4. | |||||||||||
| CMK-306 | 1027 | 208 | 0.84 | 3.8 | 3.9 | 81.7 | 1.8 | 2.1 | 0.3 | 16.3 | 25.4 |
| MNC-316 | 571 | 16 | 0.68 | 3.8 | 4.3 | 91.1 | 18.2 | 7.8 | 7.0 | 6.9 | 9.6 |
| MNC-326 | 690 | 66 | 0.89 | 3.6 | 4.1 | 81.2 | 17.2 | 6.4 | 6.7 | 6.6 | 6.7 |
| MNC-336 | 455 | 91 | 0.46 | 3.4 | 3.7 | 93.2 | 13.8 | 3.9 | 6.4 | 6.3 | 7.3 |
| MNC-346 | 637 | 21 | 0.47 | 3.4 | 3.7 | 89.8 | 12.5 | 5.5 | 6.7 | 9.2 | 10.4 |
| MNC-356 | 561 | 28 | 0.62 | 3.8 | 3.9 | 94.5 | 7.7 | 2.7 | 4.0 | 10.6 | 11.9 |
| CSI-306 (NH3) | 1351 | 205 | 1.18 | — | — | 89.1 | 9.2 | 5.8 | 1.5 | 20.8 | 29.3 |
| CSI-309 (NH3) | 1391 | 292 | 1.67 | — | — | 92.5 | 5.6 | 2.8 | 1.4 | 21.5 | 31.5 |
| CMK-306 (NH3) | 1301 | 334 | 1.15 | — | — | 81.7 | 7.8 | 4.3 | 1.8 | 16.6 | 29.0 |
| CMK-309 (NH3) | 1566 | 527 | 1.57 | — | — | 91.1 | 5.4 | 2.0 | 1.2 | 23.1 | 37.8 |
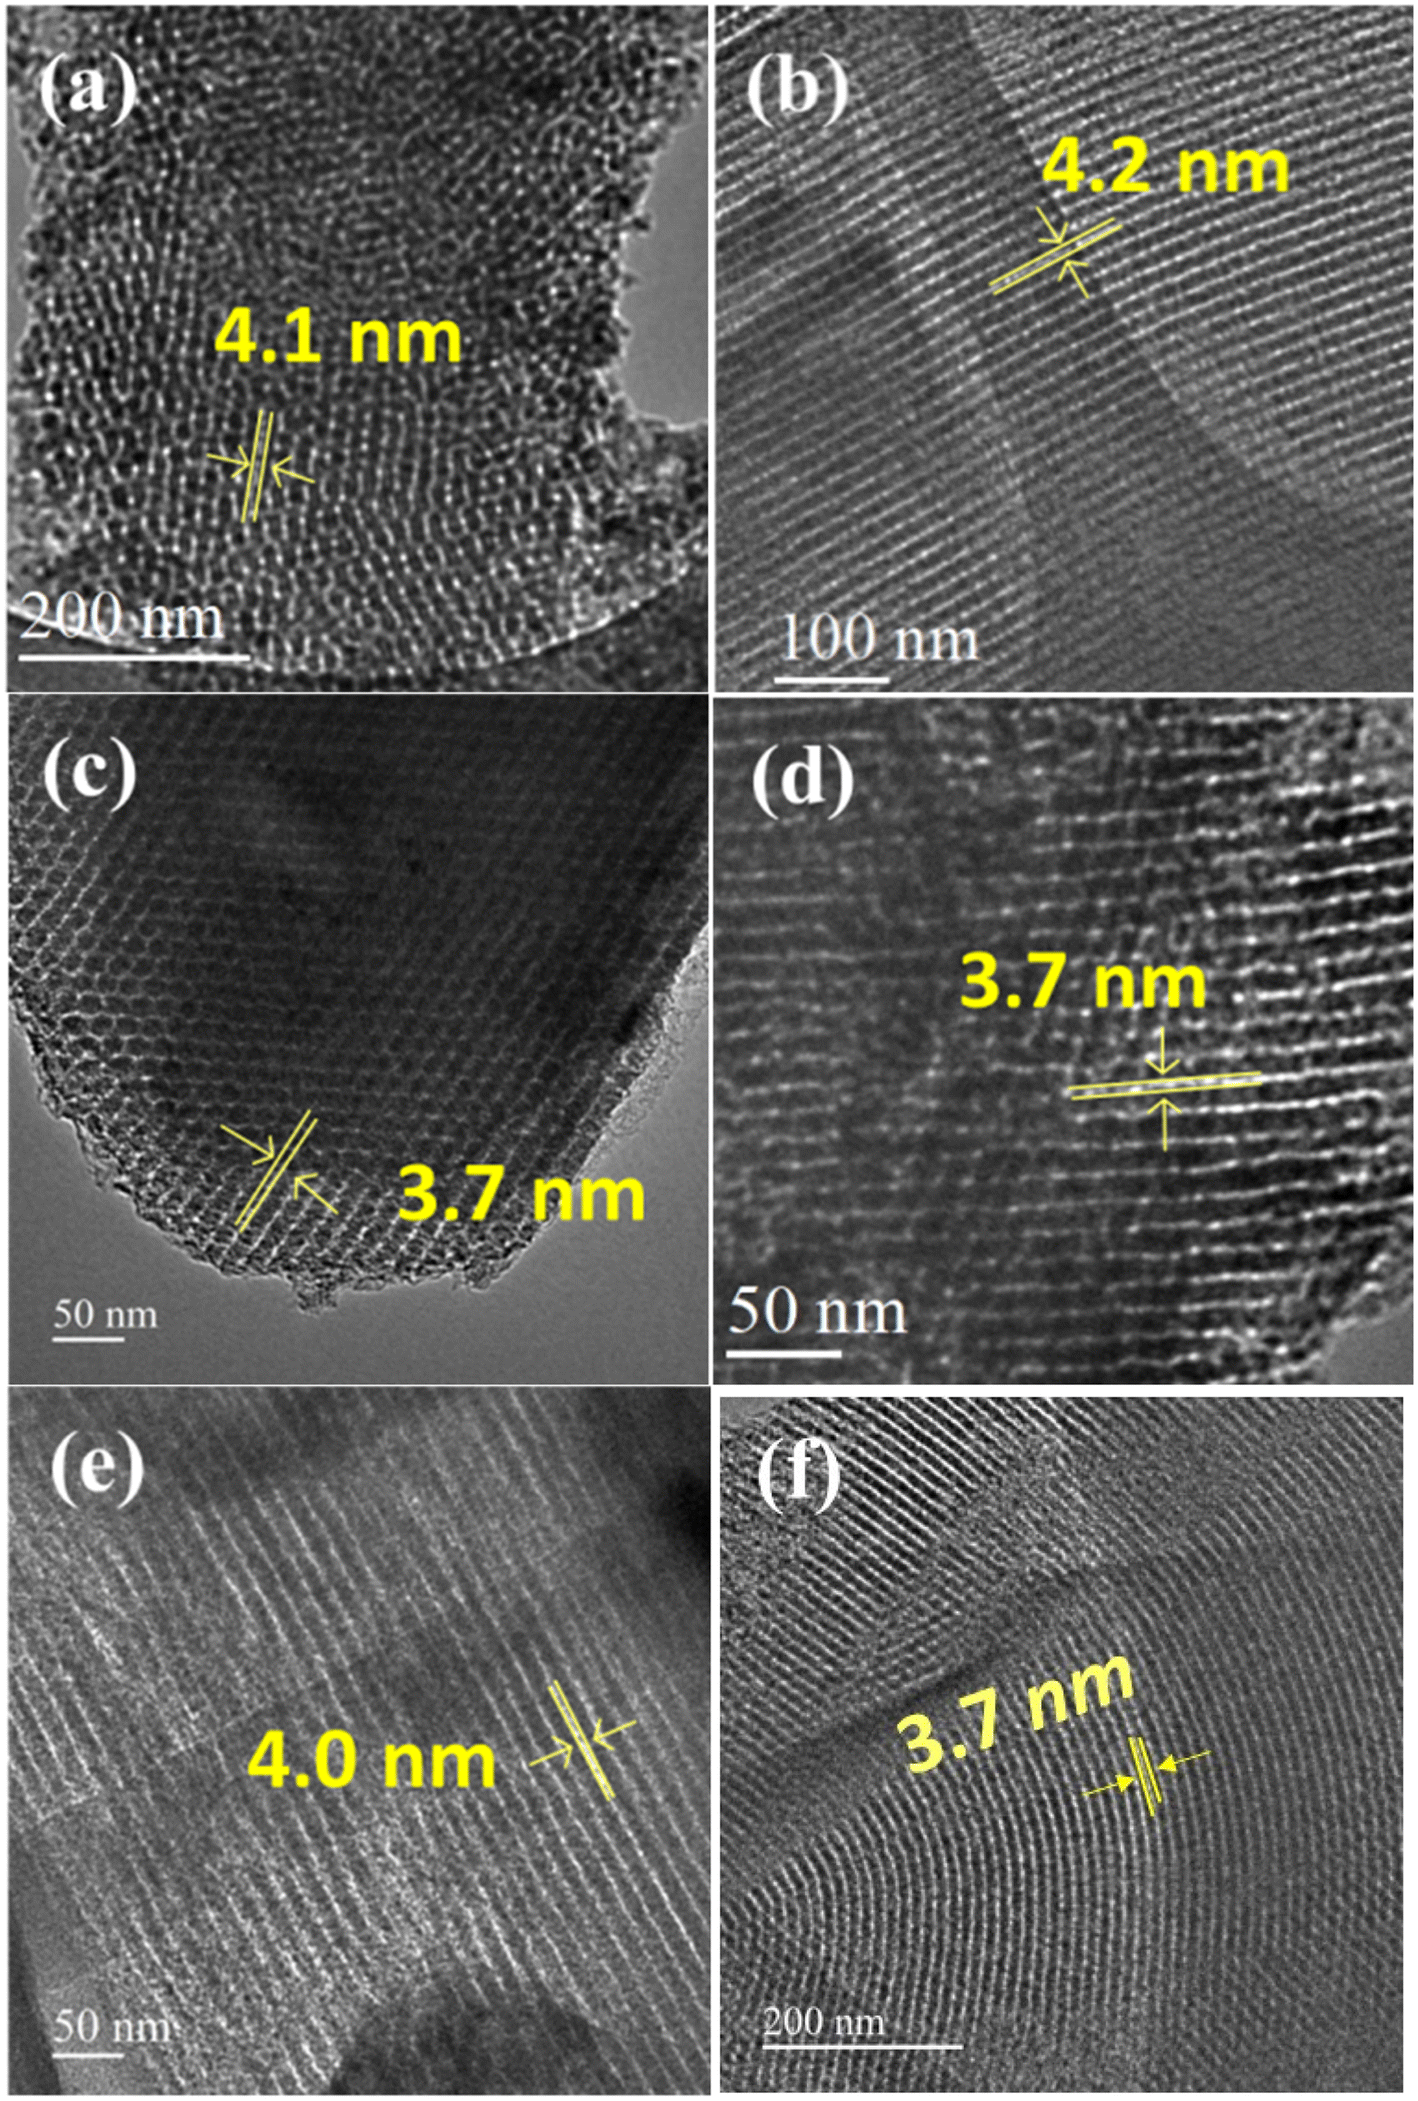 | ||
| Fig. 9 HRTEM images of various N-doped OMCs: (a) MNC-316 (b) MNC-326 (c) MNC-336 (d) MNC-346 (e) MNC-356 (f) CMK-306. | ||
 | ||
| Fig. 10 Experimental CO2 excess adsorption isotherm measurements (solid symbols) and modified Toth fit (solid lines) of N-doped OMCs at: [A] 0 °C and [B] RT; [C] correlation plot for CO2 sorption vs. total N-content in the framework structure. | ||
NH3-activated OMCs
Further, the post-synthesis ammonia-treated pristine ordered mesoporous carbons, namely CSI-306 (NH3), CSI-309 (NH3), CMK-306 (NH3), and CMK-309 (NH3) are rigorously characterized and used for CO2 storage studies. Upon activation, a significant collapse in the ordered nature of the porous system is observed, as evidenced by XRD, TEM (see Fig. S9‡), and N2-sorption isotherms (see Fig. S10‡). Also, the amount of nitrogen in these samples varied, with the samples CSI-306 (NH3), and CMK-306 (NH3) having a nitrogen percentage of 9.2 and 7.8 wt%, respectively, whereas the samples CSI-309 (NH3) and CMK-309 (NH3) possess almost 5.5 wt% nitrogen content (Table 2). The XP N (1s) analysis of the post-synthesized carbons was carried out the resultant plots are presented in Fig. 4B. Upon activation using ammonia, for the sample CSI-306 (NH3) the predominant substitution occurred at pyridinic sites (N1 + N2 regions). On the other hand, in all three samples, the doping occurred at both pyridinic (N1 + N2 regions) and quaternary (N3 region) sites. The percentage of nitrogen substitution at different functional areas of all prepared catalysts is given in Table 2. The carbon dioxide adsorption isotherms of the ammonia-activated post-synthesized carbons are shown in (Fig. 11, S11 and S12‡). An initial comparison with the pristine carbons suggests that the adsorption capacity of the activated carbons increased mostly in the low-pressure regions, wherein the micropores of the activated carbons are mostly filled. The increase in the sorption capacity is in line with the increase in surface area. The sample CSI-306 (NH3) with the highest total nitrogen showed the lowest adsorption, followed by CMK-306 (NH3), CSI-309 (NH3), and CMK-309 (NH3). The carbon CMK-309 (NH3) has shown a CO2 adsorption capacity of 37.8 mmol g−1 at 34 bar and 0 °C, which is one of the highest reported in porous carbons. Although CSI-306 (NH3) and CMK-306 (NH3) have a high amount of nitrogen substituted, the total CO2 adsorbed is lower compared with other CSI-309 (NH3) and CMK-309 (NH3). The high amount of nitrogen doping associated with the collapse of the major amount of mesoporosity resulted in the decrease of carbon dioxide adsorbed at higher pressures.On the other hand, for samples CSI-309 (NH3) and CMK-309 (NH3), the nitrogen doping resulted in only doping of approximately 5.5%. This is also associated with partial collapse of mesoporosity, as evident from the nitrogen sorption isotherms and the corresponding pore size distributions (Fig. S7‡). This resulted in a higher adsorption capacity of these samples. In addition, Fig. 11C shows the correlation profile of the CO2, adsorption of all the post-synthesized carbons against the amount of pyridine nitrogen functionality in these carbons. From Fig. 11C, the adsorption capacity decreases with the amount of pyridinic nitrogen present in the carbons, showing that pyridinic nitrogen inhibits carbon dioxide sorption even though the sample possesses a higher surface area. In literature, the presence of the pyridinic site in the carbons is proposed to be the primary reason for higher CO2 adsorption (at sub-ambient pressures), as the CO2, a weak acid, is known to bind strongly on the pyridinic sites.31,41 However, a negative correlation between the adsorption capacities with pyridinic sites is seen within the catalysts studied in the present context. This may be due to the differences in the interaction energies of CO2 molecules on free-grafted amines and the nitrogen functionality that is present in the graphitic lattice. As known, CO2 is weakly acidic and the interaction with highly basic free amine is more predominant, particularly at low pressures. On the other hand, the nitrogen present in the graphitic lattice is already in conjugation with the surrounding carbon atoms, decreasing its electron-donating capability and making it even less basic. This in-turn results in lowering the adsorption energies of these carbons for CO2 adsorption and hence lower sorption capacities. Therefore, it is further proved that nitrogen doping has a negative effect on the high-pressure CO2 adsorption capacity of the porous carbons. From these observations, we can summarize that microporosity will contribute to the enhancement of carbon dioxide at lower pressures, whereas its effect is not apparent at higher pressures. Additionally, we can say that in order to have high carbon dioxide adsorption at higher pressures, carbons with nitrogen-doped in micropore structure of carbon along with mesopores with pore size greater than 3 nm and high mesopore surface area are to be synthesized.
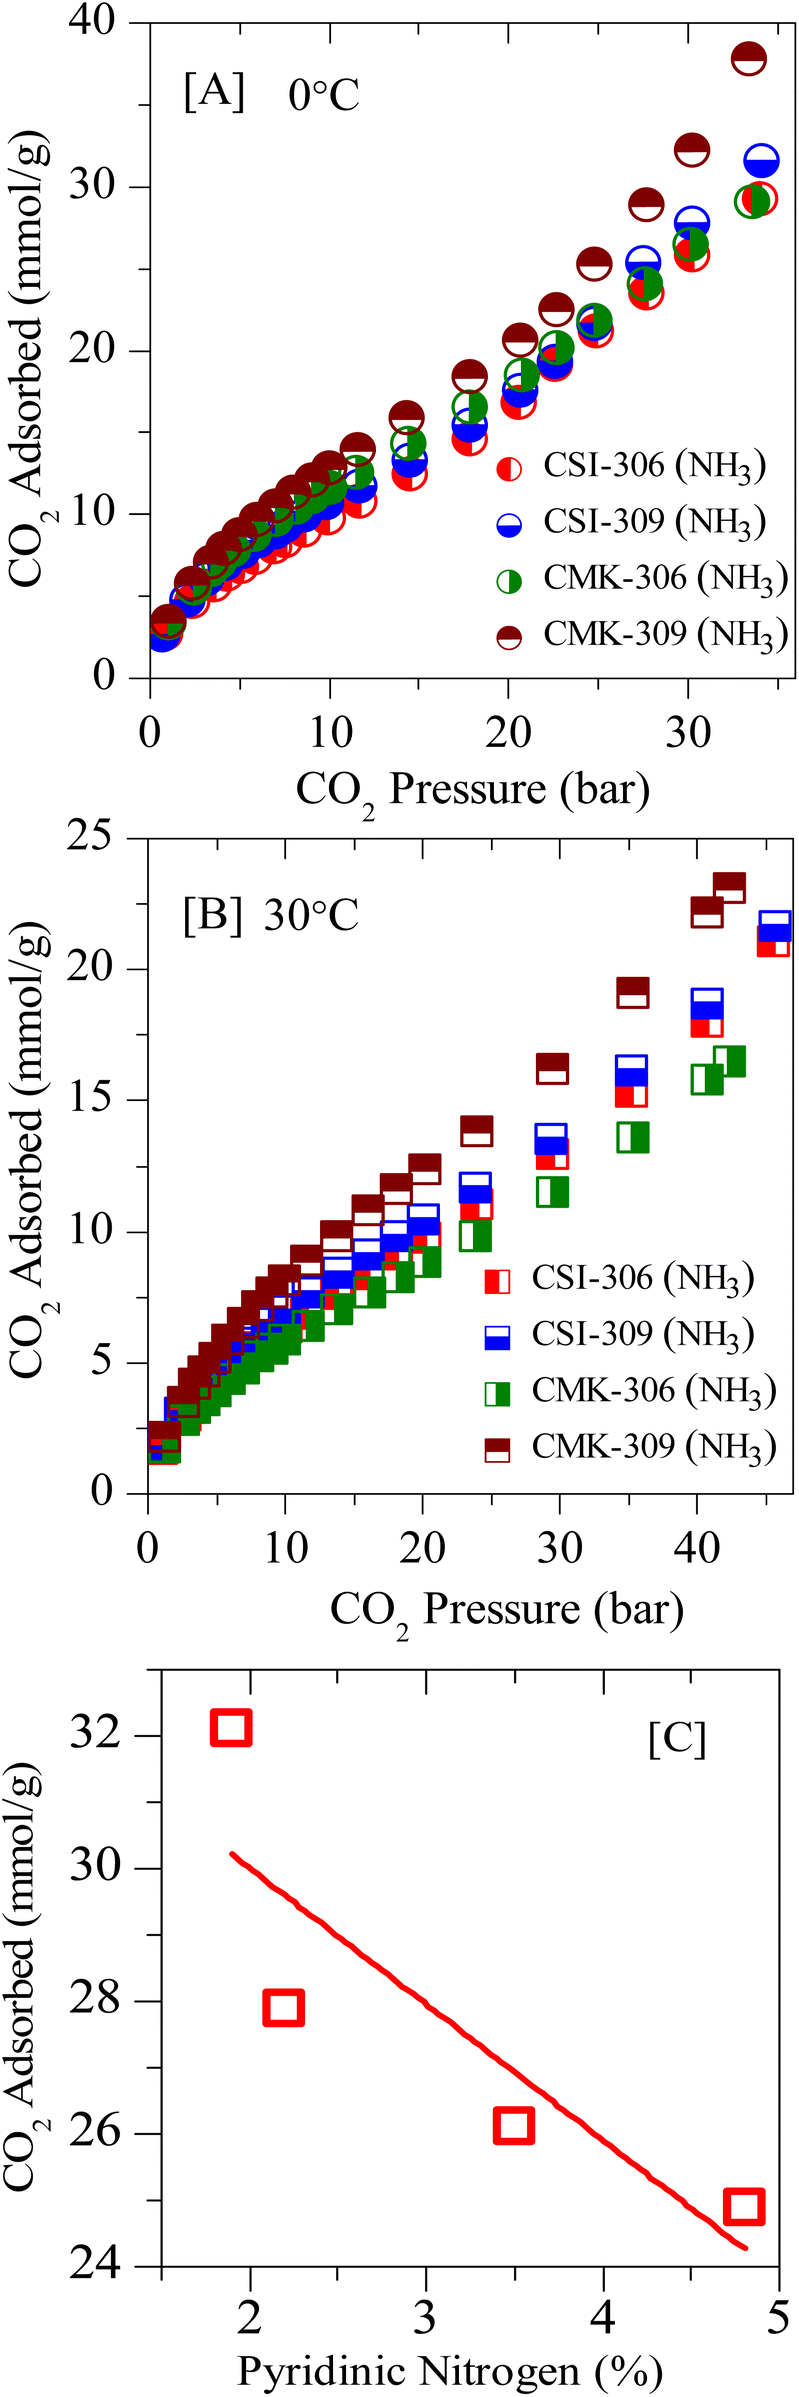 | ||
| Fig. 11 Experimental CO2 excess adsorption isotherm of ammonia-activated OMCs at: [A] 0 °C and [B] RT; [C] correlation plot of CO2 sorption vs. pyri-N in the framework structure. | ||
Finally, the various porous physiochemical parameters of all the samples used in the present study are correlated with CO2 uptake. Fig. 12A–C gives the linear fit plots of CO2 uptake at 0 °C and 34 bar pressure respectively against the total surface area, micropore surface area, and total pore volume (for values see Tables 1 and 2). It is known that the higher the correlation coefficient of a linear fit, the greater will be the dependence of that particular property with the characteristic under investigation.70 The correlation coefficients (R2) values for the physiochemical characteristics total surface area, micropore surface area, and total pore volume are respectively 0.79, 0.72, and 0.56. Also, the R2 values for the linear fits of total nitrogen content (Fig. 10C) and for pyridinic content (Fig. 11C) are given as 0.90 and 0.62. Therefore, from the above data, we can see that the total nitrogen content and the total surface area are the most influential factors in determining the CO2 adsorption capacities. While the total surface area poses a positive uptake with an increase in surface, total nitrogen content causes a negative influence on the uptake, particularly at high pressures. Also, we can see that during the filling of micro and mesopores, initially the pore surface is filled followed by the multilayer adsorption.71 Consequently, as more and more multilayers are accumulated, the mesopore gradually decreases to the micropore size and the pore filling takes place.72 Hence all the above results suggest that at high pressures, the influence of surface functional properties on CO2 uptake is masked and it is mainly dependent on the total surface area.
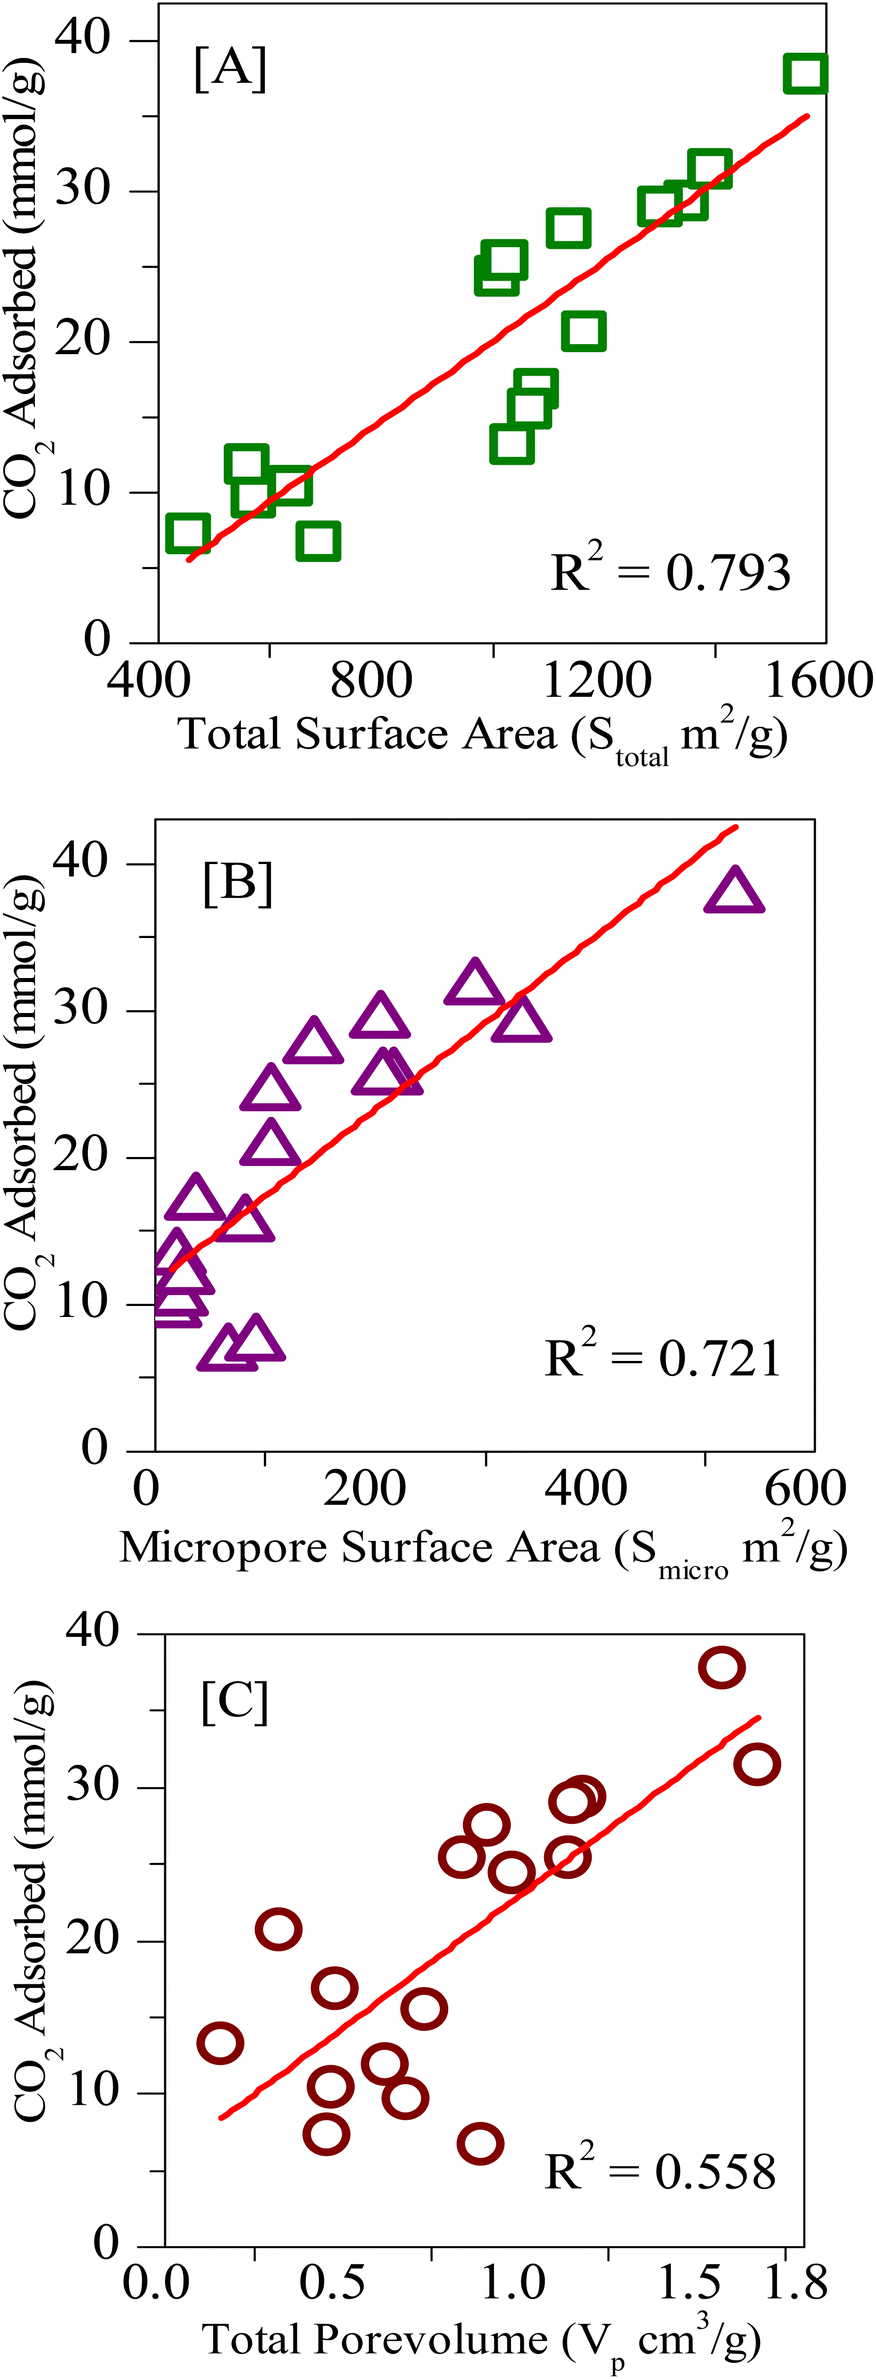 | ||
| Fig. 12 Linear fitting of the CO2 uptakes at 273 K and 34 bar vs. [A] total surface area (Stotal), [B] micropore surface area (Smicro), [C] total pore volume (Vp). | ||
Isosteric heat of adsorption
The isosteric heat of adsorption values for carbon dioxide sorption was derived using Van't Hoff equation: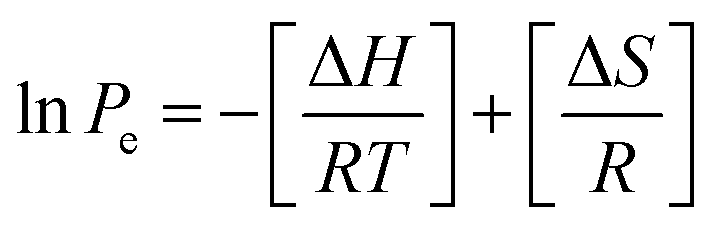
The corresponding entropy and free energy values are calculated using the following equations:

| ΔG = ΔH − TΔS |
The thermodynamic parameters are calculated using the above methods described and are depicted in Fig. 13. Since the adsorption isotherms are calculated using a high-pressure adsorption instrument the heat of adsorption at sub-ambient pressures is not determined. The parabolic shape of the isosteric heat of the adsorption curve suggests that, initially, the adsorbate–adsorbent interactions play a prominent role. Such heterogeneous interaction parameters result in the high heat of adsorption that initially decreases with an increased number of occupied active sites. After that, the intermolecular adsorbate–adsorbate forces dominate the heat of adsorption, resulting in an upshift of the values. The negative values of ΔG indicate that the adsorption is spontaneous, and the further decrease suggests that the adsorption decreases with an increase in temperature concurrent with the adsorption data. The positive nature of ΔS values indicates that the resultant adsorption results in a slight disorder increase. The ΔH values are below 10 kJ mol−1, suggesting that the process is exothermic and carbon dioxide adsorption on carbons is purely based on physisorption.
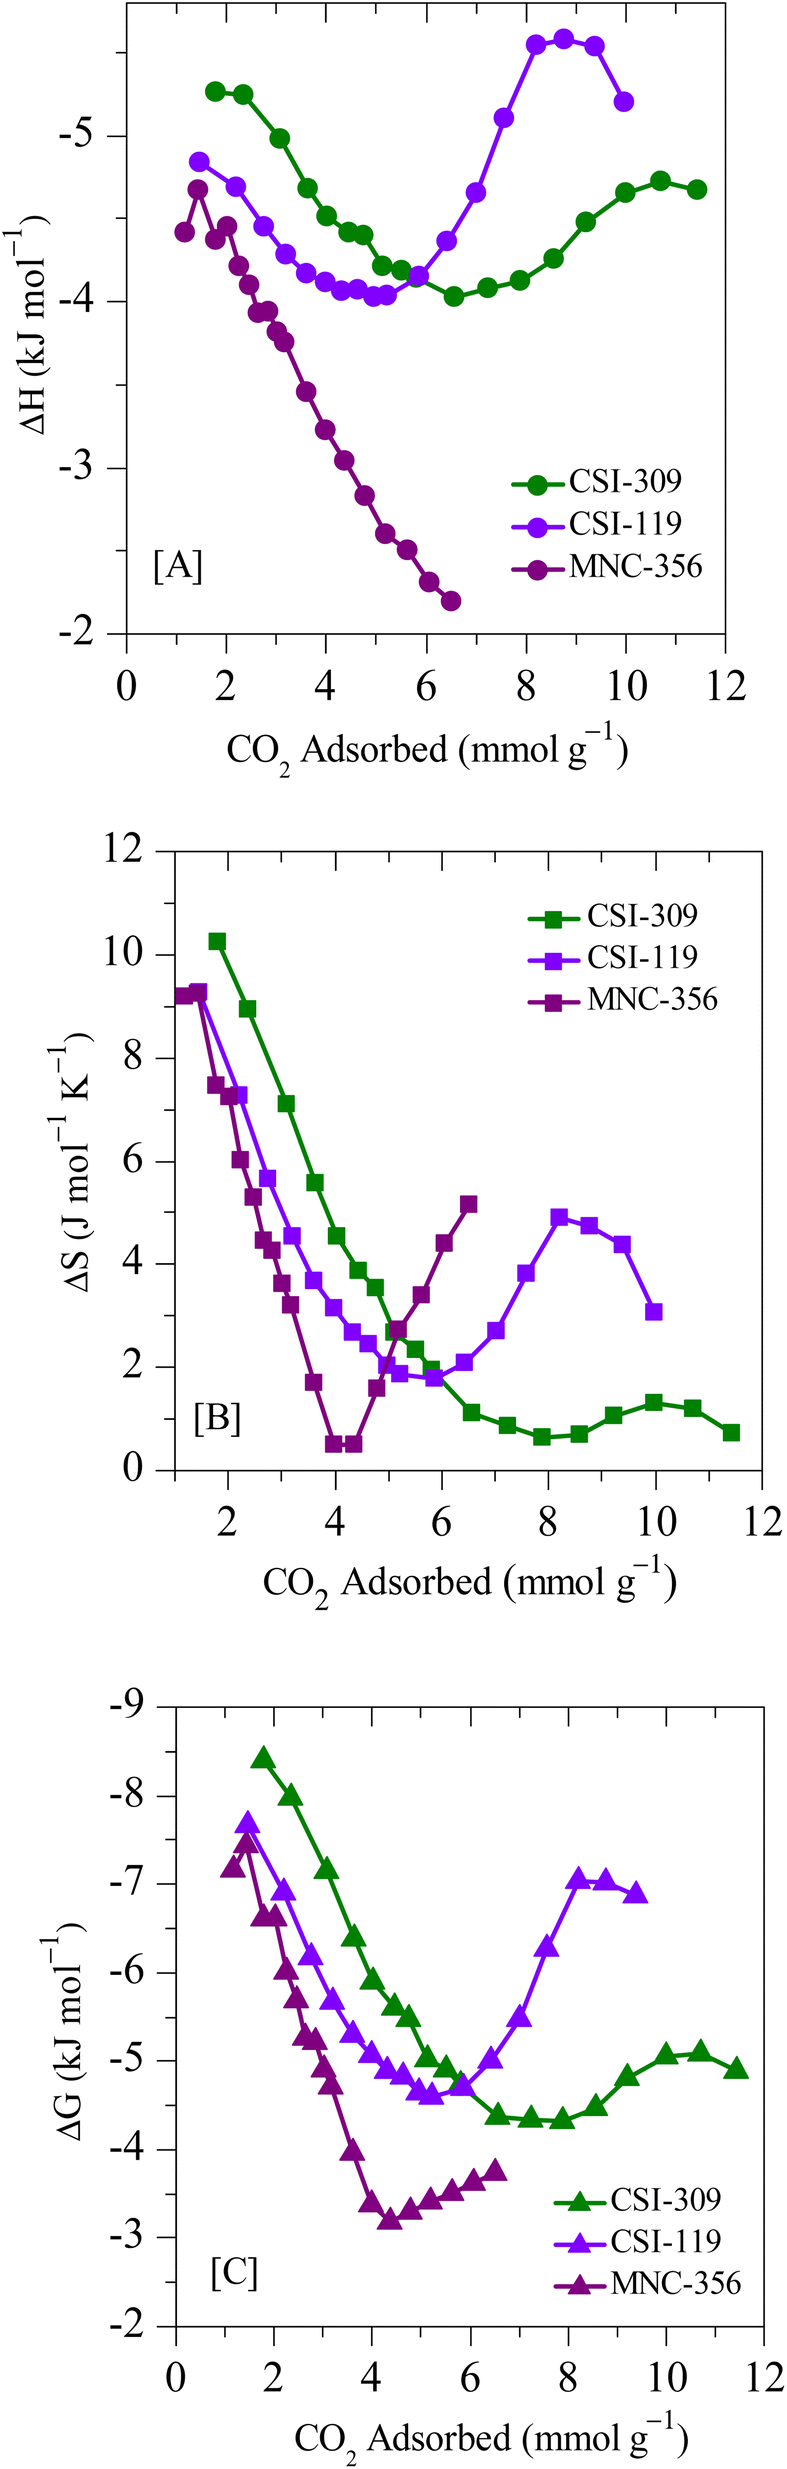 | ||
| Fig. 13 Entropy and free energy of adsorption for CSI-309, CSI-119 and MNC-356. | ||
Conclusion
Pristine mesoporous carbons with various pore sizes and pore dimensionalities and various nitrogen-doped ordered mesoporous carbons with highly ordered uniform sizes are synthesized successfully. The CO2 storage isotherms reveal that mesoporous carbons with pores greater than 3 nm will achieve high storage capacities. Also, it was seen that 1-D hexagonal carbons are better gas sorption materials when compared with their cubic counterparts. The effect of nitrogen doping in carbons keeping all other parameters like surface area, pyrolysis temperature, pore size and pore volume constant is studied and the results indicated that carbon dioxide adsorption decreases with an increase in the total nitrogen content as well as with the amount of pyridinic nitrogen. The post-synthesized carbons comprising of both micro and mesopores resulted in better adsorption capacities. Among the prepared carbons, CMK-309 (NH3) shows a CO2 adsorption capacity of 37.8 mmol g−1, which is the highest reported.Conflicts of interest
The authors declare no conflicts of interest.Acknowledgements
This work is supported by MNRE (No. 103/140/2008-NT). The authors thank DST for funding NCCR, IIT-Madras. Thanks are also due to Professor Niket S. Kaisare for his useful discussion, and Professor Shinya Hayami for the encouragement and support. One of the authors (TVRM) would like to thank CSIR for NET-JRF.References
- D. Tiwari, H. Bhunia and P. K. Bajpai, RSC Adv., 2016, 6, 111842–111855 RSC.
- D. Tiwari, C. Goel, H. Bhunia and P. K. Bajpai, J. Environ. Manage., 2017, 197, 415–427 CrossRef CAS PubMed.
- A. Zukal, S. I. Zones, M. Kubů, T. M. Davis and J. Čejka, ChemPlusChem, 2012, 77, 675–681 CrossRef CAS.
- A. R. Millward and O. M. Yaghi, J. Am. Chem. Soc., 2005, 127, 17998–17999 CrossRef CAS PubMed.
- K. Sumida, D. L. Rogow, J. A. Mason, T. M. McDonald, E. D. Bloch, Z. R. Herm, T.-H. Bae and J. R. Long, Chem. Rev., 2012, 112, 724–781 CrossRef CAS PubMed.
- J. Ren, L. Wu and B.-G. Li, Ind. Eng. Chem. Res., 2012, 51, 7901–7909 CrossRef CAS.
- M. G. Rabbani and H. M. El-Kaderi, Chem. Mater., 2012, 24, 1511–1517 CrossRef CAS.
- R. Koirala, K. R. Gunugunuri, S. E. Pratsinis and P. G. Smirniotis, J. Phys. Chem. C, 2011, 115, 24804–24812 CrossRef CAS.
- J. Silvestre-Albero, A. Wahby, A. Sepúlveda-Escribano, M. Martínez-Escandell, K. Kaneko and F. Rodríguez-Reinoso, Chem. Commun., 2011, 47, 6840–6842 RSC.
- T. Ben, H. Ren, S. Ma, D. Cao, J. Lan, X. Jing, W. Wang, J. Xu, F. Deng, J. M. Simmons, S. Qiu and G. Zhu, Angew. Chem., Int. Ed., 2009, 48, 9457–9460 CrossRef CAS PubMed.
- R. V. Siriwardane, M.-S. Shen, E. P. Fisher and J. Losch, Energy Fuels, 2005, 19, 1153–1159 CrossRef CAS.
- N. Sun, Z. Tang, W. Wei, C. E. Snape and Y. Sun, Front. Energy Res., 2015, 3, 9 Search PubMed.
- M. D. Hornbostel, J. Bao, G. Krishnan, A. Nagar, I. Jayaweera, T. Kobayashi, A. Sanjurjo, J. Sweeney, D. Carruthers, M. A. Petruska and L. Dubois, Carbon, 2013, 56, 77–85 CrossRef CAS.
- K. S. Walton, A. R. Millward, D. Dubbeldam, H. Frost, J. J. Low, O. M. Yaghi and R. Q. Snurr, J. Am. Chem. Soc., 2008, 130, 406–407 CrossRef CAS PubMed.
- M. Broda and C. R. Müller, Adv. Mater., 2012, 24, 3059–3064 CrossRef CAS PubMed.
- A. Wahby, J. M. Ramos-Fernández, M. Martínez-Escandell, A. Sepúlveda-Escribano, J. Silvestre-Albero and F. Rodríguez-Reinoso, ChemSusChem, 2010, 3, 974–981 CrossRef CAS PubMed.
- S. Himeno, T. Komatsu and S. Fujita, J. Chem. Eng. Data, 2005, 50, 369–376 CrossRef CAS.
- F. Su, C. Lu, S.-C. Kuo and W. Zeng, Energy Fuels, 2010, 24, 1441–1448 CrossRef CAS.
- Y.-R. Pei, G. Choi, S. Asahina, J.-H. Yang, A. Vinu and J.-H. Choy, Chem. Commun., 2019, 55, 3266–3269 RSC.
- G. Chandrasekar, W.-J. Son and W.-S. Ahn, J. Porous Mater., 2009, 16, 545–551 CrossRef CAS.
- K. S. Lakhi, W. S. Cha, J.-H. Choy, M. Al-Ejji, A. M. Abdullah, A. M. Al-Enizi and A. Vinu, Microporous Mesoporous Mater., 2016, 233, 44–52 CrossRef CAS.
- J. Zhou, W. Su, Y. Sun, S. Deng and X. Wang, J. Chem. Eng. Data, 2016, 61, 1348–1352 CrossRef CAS.
- C.-C. Huang and S.-C. Shen, J. Taiwan Inst. Chem. Eng., 2013, 44, 89–94 CrossRef CAS.
- M. Sevilla and A. B. Fuertes, J. Colloid Interface Sci., 2012, 366, 147–154 CrossRef CAS PubMed.
- C.-C. Hwang, Z. Jin, W. Lu, Z. Sun, L. B. Alemany, J. R. Lomeda and J. M. Tour, ACS Appl. Mater. Interfaces, 2011, 3, 4782–4786 CrossRef CAS PubMed.
- N. P. Wickramaratne and M. Jaroniec, ACS Appl. Mater. Interfaces, 2013, 5, 1849–1855 CrossRef CAS PubMed.
- H. Chen, F. Sun, J. Wang, W. Li, W. Qiao, L. Ling and D. Long, J. Phys. Chem. C, 2013, 117, 8318–8328 CrossRef CAS.
- Q. Li, J. Yang, D. Feng, Z. Wu, Q. Wu, S. S. Park, C.-S. Ha and D. Zhao, Nano Res., 2010, 3, 632–642 CrossRef CAS.
- G.-P. Hao, W.-C. Li, D. Qian and A.-H. Lu, Adv. Mater., 2010, 22, 853–857 CrossRef CAS PubMed.
- C. Goel, H. Bhunia and P. K. Bajpai, RSC Adv., 2015, 5, 46568–46582 RSC.
- J. Yu, M. Guo, F. Muhammad, A. Wang, F. Zhang, Q. Li and G. Zhu, Carbon, 2014, 69, 502–514 CrossRef CAS.
- A. Chen, Y. Yu, Y. Zhang, W. Zang, Y. Yu, Y. Zhang, S. Shen and J. Zhang, Carbon, 2014, 80, 19–27 CrossRef CAS.
- S. Zhou, H. Xu, Q. Yuan, H. Shen, X. Zhu, Y. Liu and W. Gan, ACS Appl. Mater. Interfaces, 2016, 8, 918–926 CrossRef CAS.
- D.-H. Park, K. S. Lakhi, K. Ramadass, M.-K. Kim, S. N. Talapaneni, S. Joseph, U. Ravon, K. Al-Bahily and A. Vinu, Chem. Eur. J., 2017, 23, 10753–10757 CrossRef CAS PubMed.
- K. S. Lakhi, A. V. Baskar, J. S. M. Zaidi, S. S. Al-Deyab, M. El-Newehy, J.-H. Choy and A. Vinu, RSC Adv., 2015, 5, 40183–40192 RSC.
- K. S. Lakhi, W. S. Cha, S. Joseph, B. J. Wood, S. S. Aldeyab, G. Lawrence, J.-H. Choy and A. Vinu, Catal. Today, 2015, 243, 209–217 CrossRef CAS.
- Y. Zhao, L. Zhao, K. X. Yao, Y. Yang, Q. Zhang and Y. Han, J. Mater. Chem., 2012, 22, 19726–19731 RSC.
- Á. Sánchez-Sánchez, F. Suárez-García, A. Martínez-Alonso and J. M. D. Tascón, ACS Appl. Mater. Interfaces, 2014, 6, 21237–21247 CrossRef PubMed.
- M. Saleh, J. N. Tiwari, K. C. Kemp, M. Yousuf and K. S. Kim, Environ. Sci. Technol., 2013, 47, 5467–5473 CrossRef CAS PubMed.
- J. Wang, I. Senkovska, M. Oschatz, M. R. Lohe, L. Borchardt, A. Heerwig, Q. Liu and S. Kaskel, J. Mater. Chem. A, 2013, 1, 10951–10961 RSC.
- K. S. Lakhi, D.-H. Park, S. Joseph, S. N. Talapaneni, U. Ravon, K. Al-Bahily and A. Vinu, Chem. Asian J., 2017, 12, 595–604 CrossRef CAS PubMed.
- J. Yu, M. Guo, F. Muhammad, A. Wang, G. Yu, H. Ma and G. Zhu, Microporous Mesoporous Mater., 2014, 190, 117–127 CrossRef CAS.
- S. E. Dapurkar, S. K. Badamali and P. Selvam, Catal. Today, 2001, 68, 63–68 CrossRef CAS.
- P. Selvam and B. Kuppan, Catal. Today, 2012, 198, 85–91 CrossRef CAS.
- P. R. Murthy, N. V. Krishna, K. Devaki and P. Selvam, Adv. Porous Mater., 2014, 2, 124–129 CrossRef.
- N. V. Krishna and P. Selvam, Dalton Trans., 2017, 46, 770–779 RSC.
- N. V. Krishna and P. Selvam, Adv. Porous Mater., 2014, 2, 106–112 CrossRef.
- D. Zhao, J. Feng, Q. Huo, N. Melosh, G. H. Fredrickson, B. F. Chmelka and G. D. Stucky, Science, 1998, 279, 548 CrossRef CAS PubMed.
- J. M. Kim and G. D. Stucky, Chem. Commun., 2000, 1159–1160 RSC.
- T. V. R. Mohan, B. Kuppan and P. Selvam, Catal. Green Chem. Eng., 2018, 1, 235–246 CrossRef CAS.
- T. V. R. Mohan, S. Palla, B. Kuppan, N. S. Kaisare and P. Selvam, J. Chem. Eng. Data, 2018, 63, 4543–4551 CAS.
- B. Kuppan and P. Selvam, Prog. Nat. Sci.: Mater. Int., 2012, 22, 616–623 CrossRef.
- B. Kuppan, B. Viswanathan and P. Selvam, Prepr. Symp. - Am. Chem. Soc., Div. Fuel Chem., 2012, 57, 751–752 CrossRef CAS.
- P. Selvam and T. V. R. Mohan, IN Patent 410837, Indian Institute of Technology-Madras, 2022.
- F. Kleitz, S. Hei Choi and R. Ryoo, Chem. Commun., 2003, 2136–2137 RSC.
- P. R. Murthy, N. V. Krishna, K. Devaki and P. Selvam, Adv. Porous Mater., 2014, 2, 124–129 CrossRef.
- R. Ryoo, S. H. Joo and S. Jun, J. Phys. Chem. B, 1999, 103, 7743–7746 CrossRef CAS.
- A. Vinu, Adv. Funct. Mater., 2008, 18, 816–827 CrossRef CAS.
- B. Kuppan, B. Viswanathan and P. Selvam, Prepr. Symp. – Am. Chem. Soc., Div. Fuel Chem., 2012, 57, 751–752 CAS.
- N. Liu, L. Yin, C. Wang, L. Zhang, N. Lun, D. Xiang, Y. Qi and R. Gao, Carbon, 2010, 48, 3579–3591 CrossRef CAS.
- Z. Lei, L. An, L. Dang, M. Zhao, J. Shi, S. Bai and Y. Cao, Microporous Mesoporous Mater., 2009, 119, 30–38 CrossRef CAS.
- D. Zhang, Y. Hao, L. Zheng, Y. Ma, H. Feng and H. Luo, J. Mater. Chem. A, 2013, 1, 7584–7591 RSC.
- Z. Zhang, J. Sun, M. Dou, J. Ji and F. Wang, ACS Appl. Mater. Interfaces, 2017, 9, 16236–16242 CrossRef CAS PubMed.
- S. Khan, R. P. Raj, T. V. R. Mohan, S. Bhuvaneswari, U. V. Varadaraju and P. Selvam, J. Electroanal. Chem., 2019, 848, 113242 CrossRef CAS.
- X. Wang, J. S. Lee, Q. Zhu, J. Liu, Y. Wang and S. Dai, Chem. Mater., 2010, 22, 2178–2180 CrossRef CAS.
- A. P. Terzyk, J. Chatłas, P. A. Gauden, G. Rychlicki and P. Kowalczyk, J. Colloid Interface Sci., 2003, 266, 473–476 CrossRef CAS PubMed.
- D. Saha and S. Deng, J. Colloid Interface Sci., 2010, 345, 402–409 CrossRef CAS PubMed.
- B. Adeniran and R. Mokaya, Chem. Mater., 2016, 28, 994–1001 CrossRef CAS.
- K. V. Kumar, K. Preuss, L. Lu, Z. X. Guo and M. M. Titirici, J. Phys. Chem. C, 2015, 119, 22310–22321 CrossRef CAS.
- M. Ren, M. Sevilla, A. B. Fuertes, R. Mokaya, J. M. Tour and A. S. Jalilov, ACS Appl. Mater. Interfaces, 2019, 11, 44390–44398 CrossRef CAS PubMed.
- J. Shi, N. Yan, H. Cui, J. Xu, Y. Liu and S. Zhang, ACS Sustainable Chem. Eng., 2019, 7, 19513–19521 CrossRef CAS.
- O. H. P. Gunawardene, C. A. Gunathilake, K. Vikrant and S. M. Amaraweera, Atmosphere, 2022, 13, 397 CrossRef CAS.
Footnotes |
| † Dedicated to Professor Duong D. Do and Professor Suresh K. Bhatia, The University of Queensland, Brisbane, Australia. |
| ‡ Electronic supplementary information (ESI) available. See DOI: https://doi.org/10.1039/d2ra07171a |
| This journal is © The Royal Society of Chemistry 2023 |