 Open Access Article
Construction of a Bi2WO6/BiVO4 photocatalytic system for efficient visible light degradation of tetracycline drugs†
Yiyao Zhang‡
a,
Hongchen Song‡ab,
Jintai Hana,
Yunchao Liua,
Jing Sun*a,
Tingting Shen*a,
Xikui Wangc,
Zhen Wangb,
Weizhen Zhanga and
Xuerui Yaoa
aSchool of Environmental Science and Engineering, Qilu University of Technology (Shandong Academy of Sciences), Jinan 250353, PR China. E-mail: sunjing77@qlu.edu.cn; shentingting@qlu.edu.cn
bShangdong Haijingtian Environmental Protection Technology Stock Company, Binzhou 256600, PR China
cCollege of Environmental Science and Engineering, Shandong Agriculture and Engineering University, Jinan 251100, PR China
First published on 25th January 2023
Abstract
A Bi2WO6/BiVO4 composite photocatalytic material was synthesized by the hydrothermal method, and achieved the effective degradation of oxytetracycline (OTC) and tetracycline (TC) under visible light. The compositions, structures, chemical states and optoelectronic properties of Bi2WO6, BiVO4 and Bi2WO6/BiVO4 composites were characterized by systematic characterization. The results show that the existence of the heterojunction interface facilitates the separation of photogenerated carriers. Compared with the pure catalyst of Bi2WO6 and BiVO4, the Bi2WO6/BiVO4 composite material significantly improves the degradation efficiency of OTC and TC. The degradation rate is 6.22 and 3.02 times higher than that of Bi2WO6 and BiVO4, respectively. Through the free radical quenching experiments, it is known that photogenerated holes (h+) and superoxide anion free radicals (·O2−) are the main active substances in the degradation of OTC. By analyzing the process of photocatalytic degradation of OTC, there are mainly six intermediates during the process. Their possible degradation pathways are also inferred in this paper.
1. Introduction
Tetracyclines are the earliest broad-spectrum antibiotics and have been widely used in medical, animal husbandry and other industries since their invention in 1948.1,2 Their structures all contain the basic framework of tetracene, and the main types include tetracycline (TC), oxytetracycline (OTC), chlorotetracycline and semi synthetic derivative doxycycline.3,4 They have antibacterial effects on common rickettsia and anaerobic bacteria, mycoplasma and some protozoa.5 However, since they have been used for a long time and on a large scale, the concentration of residual tetracyclines in the environment has continued to rise, increasing the resistance of pathogenic microorganisms and causing serious harm to the ecological balance and human health.6,7 These negative effects are reflected in the production of resistant strains, which reduces the antibacterial performance of antibiotics.8,9 Residual antibiotics can enter the human body through the food chain and food web and affect the immune system.The traditional antibiotic removal methods have certain shortcomings. For example, the physical methods represented by adsorption and reverse osmosis only transfer antibiotics from the aqueous phase to another phase, thereby failing to solve the toxicity problem.10,11 This still cause secondary pollution in the environment. The biological treatment of antibiotic wastewater has strict requirements on the wastewater environment, such as nutrient composition, pH, temperature and others. The unqualified wastewater environment will lead to the inactivation of microorganisms and affect the degradation efficiency.12 The chemical method involves the addition of oxidant to produce strong oxidation group has high cost and can easily cause secondary pollution.13
Photocatalytic treatment technology uses sunlight,14,15 which is a renewable energy source, as its energy source to generate active free radicals in the catalytic system for decomposing pollutants into small molecules, such as carbon dioxide and water.16,17 In addition, photocatalytic technology also has the advantages of high mineralization, non-toxic and high stability.3,18 Therefore, photocatalytic treatment of antibiotics in wastewater is an effective method,19,20and this technology has a wide research potential in the environmental field.21,22
Bi2WO6 is a typical n-type semiconductor photocatalyst material with perovskite lamellar structure. Considering its convenient synthesis, unique photoelectric performance and catalysis, it has attracted extensive attention.23 Although Bi2WO6 can absorb visible light, it has the disadvantages of low quantum efficiency and high recombination rate of photogenerated carriers, which greatly limits its practical application.24,25 To improve the photocatalytic activity of Bi2WO6, various improvement strategies have been proposed, including metal and nonmetal element doping and heterostructure construction. However, it has been shown that elemental doping decreases the carrier migration and leads to doping energy level dispersion,26 and the dopant also acts as a complex center for carriers,27 which was not conducive to the improvement of photocatalytic activity. The preparation of heterojunctions has been shown to be an effective method to promote charge separation.28,29 Coupling Bi2WO6 with narrow bandgap semiconductors to form heterojunctions also can effectively extend the light absorption range.30 BiVO4 was reported to be a promising visible photocatalyst, which was widely used for the removal of organic pollutants from wastewater due to its excellent optical and electronic properties and narrow bandgap energy.31,32 In addition, BiVO4 has an energy band edge matching Bi2WO6, so BiVO4 was introduced to build heterostructures.33
In this study, Bi2WO6/BiVO4 heterojunction materials were constructed by hydrothermal method for the degradation of OTC and TC. The structure, composition, morphology and optoelectronic properties of the materials were investigated by systematic characterization. To understand the potential applications of the materials in real-world environments, the effects of common anions on the photocatalytic degradation of OTC were investigated. The degradation mechanism of Bi2WO6/BiVO4 composites was proposed by free radical burst experiments. The degradation intermediates were analyzed in combination with high performance liquid–liquid mass spectrometry (LC-MS) technique, and possible degradation pathways of OTC were proposed.
2. Experiment part
2.1 Experimental materials
Bismuth chloride (BiCl3,AR) was purchased from Shanghai Macklin Biochemical Technology Co. Ltd. Ammonium metavanadate (NH4VO3,AR) was purchased from Xilong Science Co. Ltd. Ethanolamine (C2H7NO, AR) was purchased from Shanghai Aladdin Biochemical Technology Co. Ltd. Formic acid (HCOOH) was purchased from Comio Chemical Reagent Co. Ltd. Cetyltrimethylammonium bromide (CTAB), sodium tungstate dihydrate (Na2WO4·2H2O, AR), absolute ethanol, tert-butanol (t-butanol), methanol, acetonitrile, bismuth nitrate pentahydrate (Bi(NO3)3·5H2O, AR) and sodium sulfate (Na2SO4) were all purchased from Sinopharm Chemical Reagents Co. Ltd.2.2 Material preparation
2.3 Characterization of Bi2WO6/BiVO4
The instrument used for XRD is X-ray diffractometer (SmartLab SE); it uses Kα ray at a scanning speed of 0.02° per s. The instrument used for SEM is field emission scanning electron microscope ZEISS GEMINI 500. The instrument used in XPS is an X-ray photoelectron spectrometer (ESCALABXi+) calibrated with C 1s = 284.8 eV. The instrument used for UV-Vis DRS is Shimadzu UV-3600 Plus, Japan, with a detection range of 200–800 nm. The instrument used for photoluminescence (PL) spectrum is Edinburgh FLS1000, and the excitation wavelength is 295 nm. The instrument used for photocurrent is Shanghai Chenhua Electrochemical Workstation CHI 600E.Measuring method of photocurrent: 10 mg of material was added to 1 mL of mixed solution (ethanol![[thin space (1/6-em)]](https://www.rsc.org/images/entities/char_2009.gif) :
:![[thin space (1/6-em)]](https://www.rsc.org/images/entities/char_2009.gif) Nafion = 9
Nafion = 9![[thin space (1/6-em)]](https://www.rsc.org/images/entities/char_2009.gif) :
:![[thin space (1/6-em)]](https://www.rsc.org/images/entities/char_2009.gif) 1) for ultrasonic dispersion for 1 h to obtain suspension. The suspension at 0.3 mL was slowly dropped to 2 × 2 cm2 of ITO conductive glass and dried at 50 °C for 6 h for standby. A three-electrode system was adopted. Ag/AgCl electrode was the reference electrode, ITO conductive glass coated with material was the working electrode, the electrolyte was 0.1 mol L−1 sodium sulfate solution.
1) for ultrasonic dispersion for 1 h to obtain suspension. The suspension at 0.3 mL was slowly dropped to 2 × 2 cm2 of ITO conductive glass and dried at 50 °C for 6 h for standby. A three-electrode system was adopted. Ag/AgCl electrode was the reference electrode, ITO conductive glass coated with material was the working electrode, the electrolyte was 0.1 mol L−1 sodium sulfate solution.
2.4 Study on the degradation of tetracyclines by Bi2WO6/BiVO4
Taking OTC and TC as target pollutants and by using filters (λ > 400 nm) as a visible light source, the catalytic activity of photocatalytic materials was studied.The specific experimental steps for the photocatalytic degradation of OTC (or TC) were as follows. Photocatalyst material (0.01 g) was added into the OTC (or TC) solution containing 100 mL (20 ppm) and stirred for 30 min under dark conditions. Then, a xenon lamp was used for irradiation. Samples were collected at fixed intervals and filtered using a 0.45 μm filter tip.
The liquid phase detection conditions of OTC (TC) are as follows. The chromatographic column was Hypersil GOLD C18, the detection wavelength was 360 nm (355 nm), the mobile phase were formic acid solution (concentration 0.2%) and methanol (V![[thin space (1/6-em)]](https://www.rsc.org/images/entities/char_2009.gif) :
:![[thin space (1/6-em)]](https://www.rsc.org/images/entities/char_2009.gif) V = 75
V = 75![[thin space (1/6-em)]](https://www.rsc.org/images/entities/char_2009.gif) :
:![[thin space (1/6-em)]](https://www.rsc.org/images/entities/char_2009.gif) 25), the flow rate set at 1.2 mL min−1, and the amount of sample injected each time was 20 μL. The temperature of the column temperature box was 35 °C. The degradation rate of OTC (TC) was calculated according to eqn S(1).†
25), the flow rate set at 1.2 mL min−1, and the amount of sample injected each time was 20 μL. The temperature of the column temperature box was 35 °C. The degradation rate of OTC (TC) was calculated according to eqn S(1).†
The degradation products of OTC were analyzed by Brooke's high resolution mass spectrometry. The liquid chromatographic column was ACQUITY UPLC HSS T3 1.8 μm. The mobile phases were formic acid solution (concentration 0.1%) and acetonitrile. The elution gradient started from 5% acetonitrile, rose to 100% at 20 min and was maintained for 5 min, and the percentage of acetonitrile decreased to 5% at 25.1 min and stabilized for 4.9 min before returning to the initial percentage.
3. Results and discussion
3.1 Characterization of catalysts
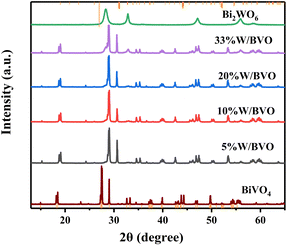
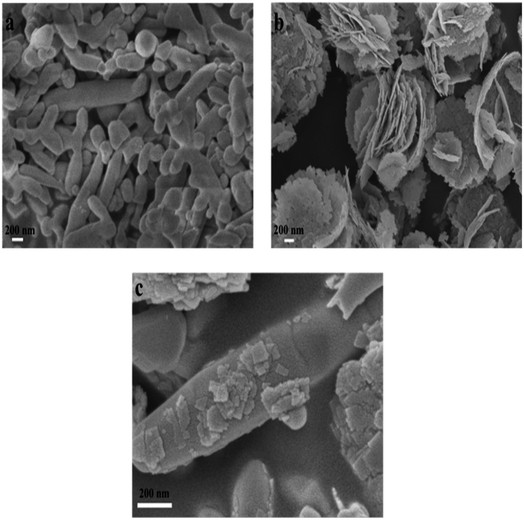
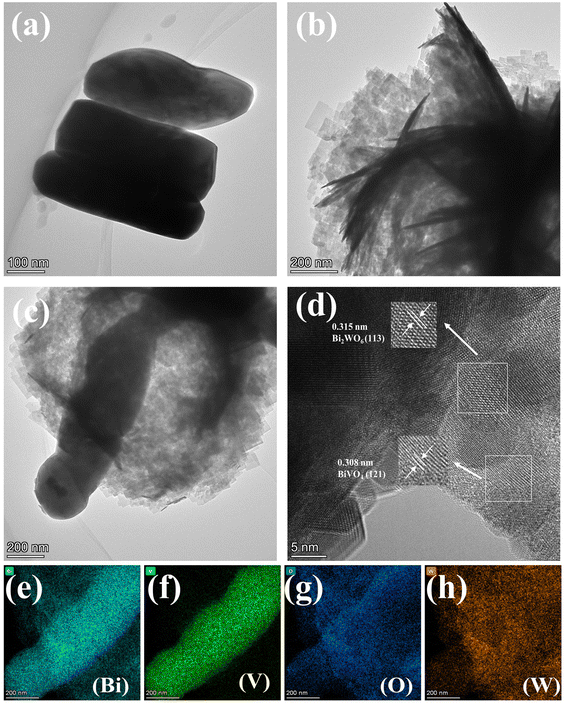
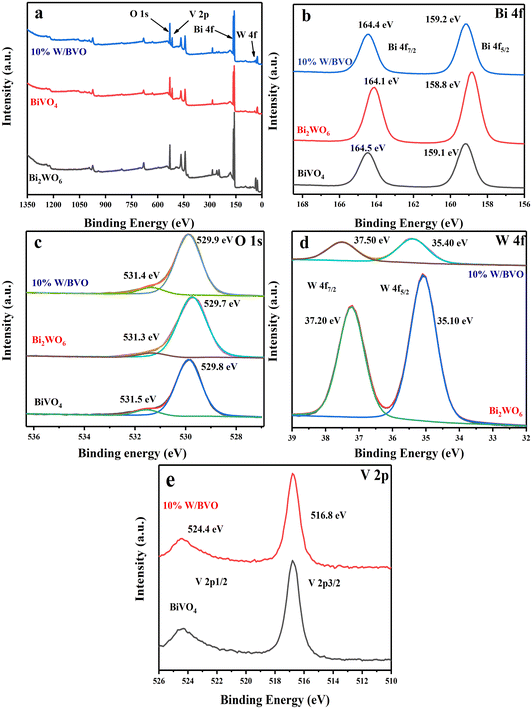
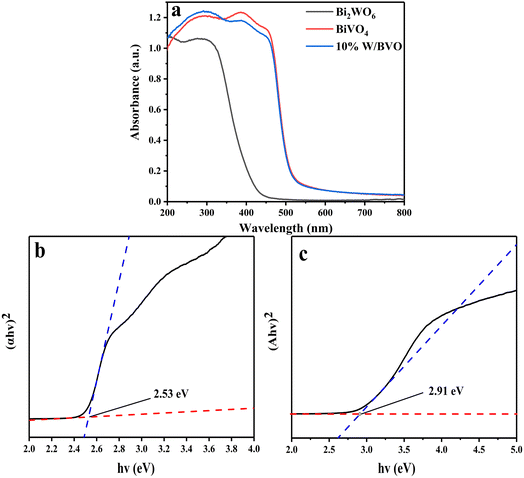
3.2 Study on degradation of OTC/TC
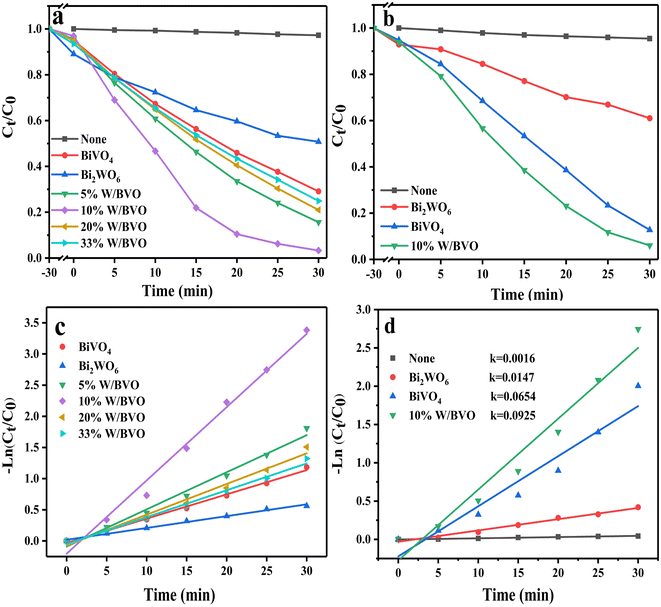
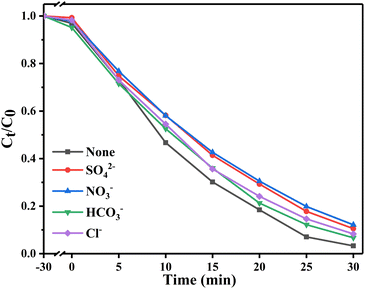
Fig. 6 shows the photocatalytic degradation ability of different materials for tetracyclines. Fig. 6a and b show that compared with the adsorption effect under light and dark conditions without a catalyst, the system with a catalyst had obvious degradation effects on OTC and TC. Among them, Bi2WO6/BiVO4 heterojunction significantly improved the degradation effect of OTC. When the proportion of Bi2WO6 was 10%, the degradation rate was the best, reaching 96.7%. When the proportion of Bi2WO6 continued to increase, the degradation rate started to decrease. This finding may be due to excessive Bi2WO6 hindered the response of BiVO4 to visible light, reducing the generation rate of photogenerated charge. The degradation of TC also followed this rule. Pseudo first-order kinetics of the degradation process (Fig. 6c and d) was conducted to calculate the degradation rate constant (k). The k values of OTC degraded by BiVO4, Bi2WO6 and 10% W/BVO were 0.0389, 0.0189 and 0.1176, respectively, and the k values of TC degraded by BiVO4, Bi2WO6 and 10% W/BVO were 0.0654, 0.0147 and 0.0925. This shows that the photocatalytic efficiency of Bi2WO6/BiVO4 composite was significantly better than those of the two materials alone.In order to investigate the application of the catalyst in the real water environment, Na2SO4, NaNO3, NaHCO3 and NaCl were added to investigate the effect of different anions on the photodegradation effect. As shown in Fig. 7, the degradation efficiency of OTC was slightly inhibited by the addition of anions, and the inhibition effect was NO3− > SO42− > Cl− > HCO3− in order. This may be due to the fact that anions can adsorb on the active sites on the material surface, thus reducing the contact between the material and the pollutant and affecting its degradation effect.51,52 Alternatively, the anions may directly consume the active groups produced by photocatalysis, leading to a decrease in OTC degradation efficiency.53–55
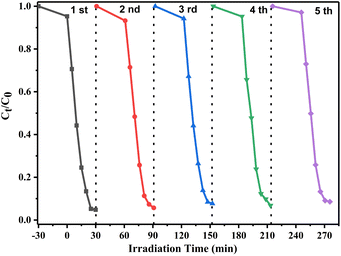
To study the stability and reuse performance of the photocatalyst, the recycling experiments of the 10% W/BVO composite were carried out. As shown in Fig. 8, after five repeated photocatalytic experiments, the degradation rate of 10% W/BVO composites for OTC under visible light did not decrease significantly, indicating that the Bi2WO6/BiVO4 composite catalyst has excellent stability and reusability, and is practical for wide use in the field of environmental remediation.
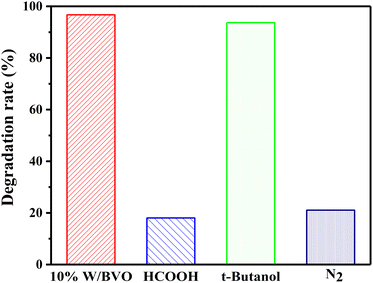
To explore the types of main active free radicals in the process of OTC/TC degradation, different quenching agents were added to the system to prevent the action of active groups. As shown in Fig. 9, in the process of OTC degradation, the addition of HCOOH (h+ quenching agent) or the reaction in N2 atmosphere (inhibition of ·O2− production)56 significantly inhibited the degradation effect, whereas the addition of isopropanol (t-butanol, ·OH inhibitor) achieved 93.7% of the degradation effect. This was only 3.0% lower than that without quenching agent. This finding showed that h+ and ·O2− played a major role in the photocatalytic degradation of OTC, whereas ·OH did not play a significant role.
The active species in the photocatalytic reaction was further demonstrated by the ESR spin trap technique using 5,5-dimethyl-1-pyrroline-N-oxide (DMPO) as the active species trap to produce stable DMPO-·O2− and DMPO-·OH in methanol and aqueous humor, respectively. As shown in Fig. 10a, the characteristic peak of DMPO-·O2− appears under visible light irradiation, indicating the generation of ·O2−, and the highest intensity of DMPO-·O2− peak generated by 10% W/BVO was due to the formation of heterojunction to promote charge separation and the photogenerated electron reduction of O2 to produce more ·O2−.57 In addition, the characteristic peaks of DMPO-·OH were shown in Fig. 10b, and the intensity of DMPO-·OH peaks generated by 10% W/BVO was significantly higher than that of pure Bi2WO6 and BiVO4, indicating that 10% W/BVO can generate more ·OH.
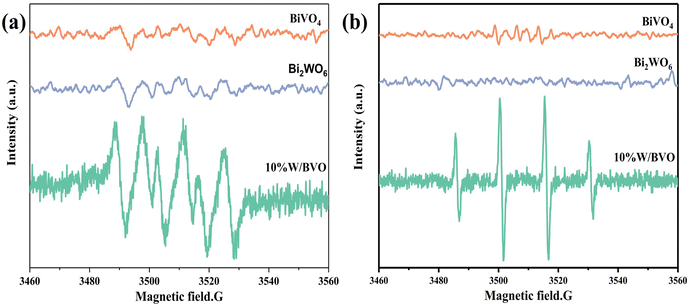 | ||
| Fig. 10 DMPO ESR spectra under visible light for 10 min: (a) in methanol dispersion for DMPO-·O2− and (b) in aqueous dispersion for DMPO-·OH. | ||
The system had an obvious degradation effect on OTC and TC, and the key was the ability of electron migration between the system interfaces. To verify the separation efficiency of photogenerated carriers, PL spectra and transient photocurrent at 295 nm were measured. Fig. 11a shows that the relative intensity of PL spectrum was in the following order: Bi2WO6 > BiVO4 > 10% W/BVO, which suggested that the recombination efficiency of photogenerated carriers of 10% W/BVO was lower. The transient photocurrent response spectrum (Fig. 11b) showed that the relative photocurrent intensity of 10% W/BVO was higher than that of Bi2WO6 and BiVO4 after the lamp was turned on, indicating that the carrier migration efficiency in 10% W/BVO was better, which was also consistent with the PL spectral analysis results.
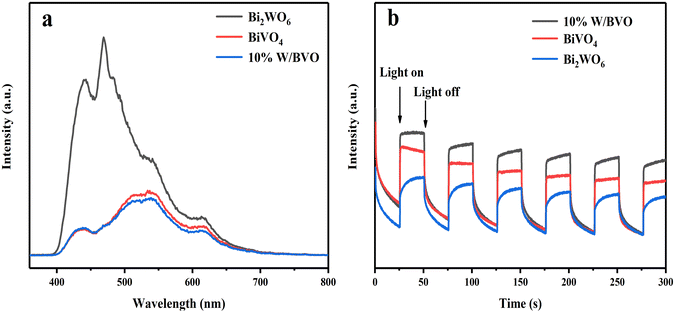 | ||
| Fig. 11 (a) Photoluminescence spectra of different materials and (b) transient photocurrent response spectra. | ||
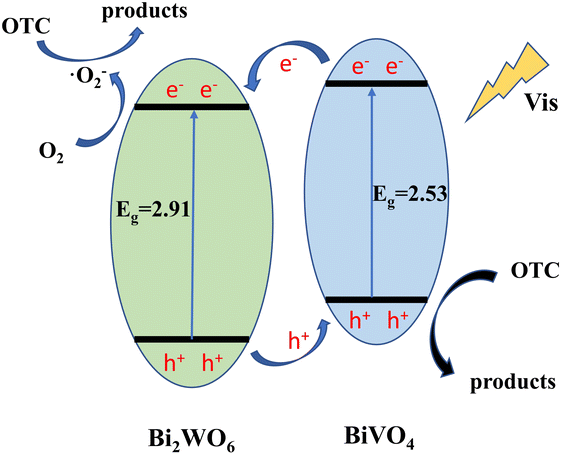
Through the above characterization analysis and radical trapping experiments, the mechanism of efficient OTC removal by Bi2WO6/BiVO4 was proposed. The energy band structure of Bi2WO6 and BiVO4 formed a type II heterojunction structure, which facilitates the separation rate of photogenerated charges. As shown in Fig. 12, both BiVO4 and Bi2WO6 produce photogenerated holes (h+) and photogenerated electrons (e−) with charge redistribution when visible light was irradiated onto the composite surface. Considering that the ECB of Bi2WO6 (+0.41 V vs. NHE) was lower than that of BiVO4 (+0.39 V vs. NHE), the e− of BiVO4 can be transferred to the surface of Bi2WO6 under thermodynamic driving force. The e− on the conduction band of Bi2WO6 can react with the oxygen molecules adsorbed on the surface to form ·O2− in a reduction reaction.58 Similarly, the EVB of BiVO4 (+2.91 V vs. NHE) was higher than that of Bi2WO6 (+3.32 V vs. NHE), and the h+ formed by Bi2WO6 can be transferred to the BiVO4 surface. The formed ·O2− and h+ reacted with the OTC adsorbed on the surface of the material by oxidation, and the OTC degrades to form small molecules. Since the e− and h+ at the interface of Bi2WO6 and BiVO4 were effectively separated, it was conducive to reducing the compounding chance and thus improving the photocatalytic activity of the system.
3.3 Analysis of OTC degradation path
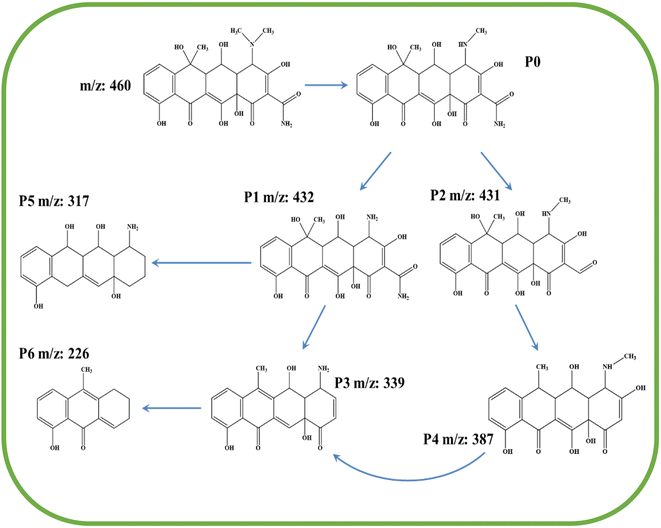
The paper further explored the degradation path of OTC by 10% W/BVO by analyzing the intermediates produced in the degradation process. The original LC-MS plot of OTC degradation intermediates was shown in Fig. S1.† Table S2† shows the specific substances detected. Fig. 13 shows the possible degradation pathway of OTC based on LC-MS analysis results. P1 (m/z = 432) was the product of the removal of two methyl groups from the C–N bond in N–CH3 due to the attack of active free radicals, and the removal of one methyl group was P0. P2 (m/z = 431) was the product of C–N deamination in P0.59 P4 (m/z = 387) was the product of decarbonylation and hydroxylation of P2. Two production paths for P3 (m/z = 339) existed. One was the product of P1 dehydroxylation and amide, and the other was the product of P4 demethylation and hydroxyl. P5 (m/z = 317) may be the product of P1 demethylation, amide, and hydroxyl that can destroy the carbonyl group. P6 (m/z = 226) may be the intermediate obtained from the dehydroxylation of P3.60 The base peak in the mass spectrum of P6 was excimer ion (2M + H).4. Conclusions
Bi2WO6/BiVO4 composites were synthesized for the photocatalytic degradation of OTC/TC. XRD, SEM, XPS, UV-Vis DRS, PL and photocurrent were used to study the structure, morphology, surface chemical state and photoelectric properties of the materials. The influence of common anions in water on OTC degradation was investigated. The reaction mechanism and OTC degradation path were also preliminarily explored, and the following conclusions were obtained:(1) Compared with single BiVO4 and Bi2WO6, the construction of Bi2WO6/BiVO4 heterojunction system significantly improved the efficiency of photocatalytic removal of OTC/TC. The removal rate of OTC by 10% W/BVO photocatalyst reached 96.7%, and the degradation rate were 6.22 and 3.02 times that of Bi2WO6 and BiVO4 respectively.
(2) Common anions can inhibit the degradation efficiency of OTC to varying degrees in the following order: NO3− > SO42− > Cl− > HCO3−.
(3) The formation of heterojunctions promoted the separation rate of photogenerated charges and improved the photocatalytic activity.
(4) The free radical quenching experiment showed that ·O2− and h+ play a major role in the process of OTC degradation. High resolution mass spectrometry analysis showed that there were six intermediates in the reaction process, and the possible degradation path was speculated.
Author contributions
Yiyao Zhang: resources, software, methodology, writing – original draft. Hongchen Song: resources, data curation, software, writing – original draft. Jintai Han: formal analysis, supervision. Yunchao Liu: visualization. Jing Sun: resources, funding acquisition, formal analysis, supervision. Tingting Shen: funding acquisition, validation, data curation. Xikui Wang: project administration, investigation. Zhen Wang: formal analysis. Weizhen Zhang: investigation. Xuerui Yao: data curation.Conflicts of interest
The authors declare no conflict of interest.Acknowledgements
This research was supported by the Qilu University of Technology (Shandong Academy of Sciences) Basic Research Project of Science, Education and Industry Integration Pilot Project (2022PY047).Notes and references
- J. Wu, J. Hu, H. Qian, J. Li, R. Yang and L. Qu, Diamond Relat. Mater., 2022, 121, 108738 CrossRef CAS.
- M. Wang, C. Jin, J. Kang, J. Liu, Y. Tang, Z. Li and S. Li, Chem. Eng. J., 2021, 416, 128118 CrossRef CAS.
- Y. Dai, Y. Liu, J. Kong, J. Yuan, C. Sun, Q. Xian, S. Yang and H. He, Solid State Sci., 2019, 96, 105946 CrossRef CAS.
- W. Wang, Q. Han, Z. Zhu, L. Zhang, S. Zhong and B. Liu, Advanced Powder Technology, 2019, 30, 1882–1896 CrossRef CAS.
- S. Wang, J. Li, C. Wang, J. Ma, Z. Li, Z. Zheng and J. Zhang, Bioresour. Technol., 2022, 348, 126756 CrossRef CAS PubMed.
- C. Zhao, Y. Zhou, D. J. d. Ridder, J. Zhai, Y. Wei and H. Deng, Chem. Eng. J., 2014, 248, 280–289 CrossRef CAS.
- K. Zhou, X.-D. Xie and C.-T. Chang, Appl. Surf. Sci., 2017, 416, 248–258 CrossRef CAS.
- Z. Lu, J. Peng, M. Song, Y. Liu, X. Liu, P. Huo, H. Dong, S. Yuan, Z. Ma and S. Han, Chem. Eng. J., 2019, 360, 1262–1276 CrossRef CAS.
- V. K. Sharma, N. Johnson, L. Cizmas, T. J. McDonald and H. Kim, Chemosphere, 2016, 150, 702–714 CrossRef CAS PubMed.
- L. Chen, C. W. Chen, C. P. Huang, Y. Chuang, T. B. Nguyen and C. D. Dong, J. Colloid Interface Sci., 2022, 616, 67–80 CrossRef CAS PubMed.
- S. Zhang, S. Zhao, S. Huang, B. Hu, M. Wang, Z. Zhang, L. He and M. Du, Chem. Eng. J., 2021, 420, 130516 CrossRef CAS.
- A. S. Oberoi, Y. Jia, H. Zhang, S. K. Khanal and H. Lu, Environ. Sci. Technol., 2019, 53, 7234–7264 CrossRef CAS PubMed.
- M. B. Ahmed, J. L. Zhou, H. H. Ngo, W. Guo, N. S. Thomaidis and J. Xu, J. Hazard. Mater., 2017, 323, 274–298 CrossRef CAS PubMed.
- G. Liao, Y. Gong, L. Zhang, H. Gao, G.-J. Yang and B. Fang, Energy Environ. Sci., 2019, 12, 2080–2147 RSC.
- G. Liao, C. Li, X. Li and B. Fang, Cell Rep. Phys. Sci., 2021, 2, 100355 CrossRef CAS.
- Z. Du, L. Feng, Z. Guo, T. Yan, Q. Hu, J. Lin, Y. Huang, C. Tang and Y. Fang, J. Colloid Interface Sci., 2021, 589, 545–555 CrossRef CAS PubMed.
- Y. Li, Z. Lai, Z. Huang, H. Wang, C. Zhao, G. Ruan and F. Du, Appl. Surf. Sci., 2021, 550, 149342 CrossRef CAS.
- H. Tang, W. Zhang, Y. Meng and S. Xia, Appl. Catal., B, 2021, 285, 119851 CrossRef CAS.
- Q. Zhang, L. Jiang, J. Wang, Y. Zhu, Y. Pu and W. Dai, Appl. Catal., B, 2020, 277, 119122 CrossRef CAS.
- C. Zhao, H. Deng, Y. Li and Z. Liu, J. Hazard. Mater., 2010, 176, 884–892 CrossRef CAS PubMed.
- F. Chang, J. Zhang, Y. Xie, J. Chen, C. Li, J. Wang, J. Luo, B. Deng and X. Hu, Appl. Surf. Sci., 2014, 311, 574–581 CrossRef CAS.
- F. Chang, Y. Xie, C. Li, J. Chen, J. Luo, X. Hu and J. Shen, Appl. Surf. Sci., 2013, 280, 967–974 CrossRef CAS.
- N. Dang Phu, L. Huy Hoang, P.-C. Guo, X.-B. Chen and W. Ching Chou, J. Sol-Gel Sci. Technol., 2017, 83, 640–646 CrossRef.
- M. Zhang, J. Lu, C. Zhu, Y. Xiang, L. Xu and T. Chen, Solid State Sci., 2019, 90, 76–85 CrossRef CAS.
- Y. L. Geng, P. Zhang and S. P. Kuang, RSC Adv., 2014, 4, 46054–46059 RSC.
- X. Zhang, Y. Gong, X. Dong, X. Zhang, C. Ma and F. Shi, Mater. Chem. Phys., 2012, 136, 472–476 CrossRef CAS.
- T. Saison, N. Chemin, C. Chanéac, O. Durupthy, V. Ruaux, L. Mariey, F. Maugé, P. Beaunier and J.-P. Jolivet, J. Phys. Chem. C, 2011, 115, 5657–5666 CrossRef CAS.
- C. Chen, J. Hu, X. Yang, T. Yang, J. Qu, C. Guo and C. M. Li, ACS Appl. Mater. Interfaces, 2021, 13, 20162–20173 CrossRef CAS PubMed.
- T. Yang, Y. Shao, J. Hu, J. Qu, X. Yang, F. Yang and C. Ming Li, Chem. Eng. J., 2022, 448, 137613 CrossRef CAS.
- P. Ju, P. Wang, B. Li, H. Fan, S. Ai, D. Zhang and Y. Wang, Chem. Eng. J., 2014, 236, 430–437 CrossRef CAS.
- J. Hu, C. Chen, Y. Zheng, G. Zhang, C. Guo and C. M. Li, Small, 2020, 16, e2002988 CrossRef PubMed.
- W. Wang, L. Lin, D. Yu and B. Liu, J. Nanosci. Nanotechnol., 2018, 18, 7691–7702 CrossRef CAS.
- Y. Geng, P. Zhang and S. Kuang, RSC Adv., 2014, 4, 46054–46059 RSC.
- S. Chaiwichian, B. Inceesungvorn, K. Wetchakun, S. Phanichphant, W. Kangwansupamonkon and N. Wetchakun, Mater. Res. Bull., 2014, 54, 28–33 CrossRef CAS.
- S. Luo, J. Ke, M. Yuan, Q. Zhang, P. Xie, L. Deng and S. Wang, Appl. Catal., B, 2018, 221, 215–222 CrossRef CAS.
- Q. Chi, G. Zhu, D. Jia, W. Ye, Y. Wang, J. Wang, T. Tao, F. Xu, G. Jia, W. Li and P. Gao, Nanoscale, 2021, 13, 4496–4504 RSC.
- K. Shahzad, M. B. Tahir and M. Sagir, Appl. Nanosci., 2020, 10, 2037–2043 CrossRef CAS.
- P. Ju, Y. Wang, Y. Sun and D. Zhang, Dalton Trans., 2016, 45, 4588–4602 RSC.
- L. Chen, D. Meng, X. Wu, A. Wang, J. Wang, M. Yu and Y. Liang, RSC Adv., 2016, 6, 52300–52309 RSC.
- Z. Liu, X. Liu, L. Wei, C. Yu, J. Yi and H. Ji, Appl. Surf. Sci., 2020, 508, 145309 CrossRef CAS.
- S. Chaiwichian, K. Wetchakun, S. Phanichphant, W. Kangwansupamonkon and N. Wetchakun, RSC Adv., 2016, 6, 54060–54068 RSC.
- L. Ji, L. Lin, D. Yu, P. Gao, W. Wang and B. Liu, Mater. Lett., 2018, 220, 94–98 CrossRef CAS.
- S. Jonjana, A. Phuruangrat, S. Thongtem and T. Thongtem, Mater. Lett., 2018, 216, 92–96 CrossRef CAS.
- X. Yuan, D. Shen, Q. Zhang, H. Zou, Z. Liu and F. Peng, Chem. Eng. J., 2019, 369, 292–301 CrossRef CAS.
- J. Zhang, H. Cui, B. Wang, C. Li, J. Zhai and Q. Li, Appl. Surf. Sci., 2014, 300, 51–57 CrossRef CAS.
- Y. Liu, L. Huang, Y. Fang, X. Zhu and S. Dong, Nano Res., 2021, 14, 2711–2716 CrossRef CAS.
- H. Hu, W. Kong, J. Wang, C. Liu, Q. Cai, Y. Kong, S. Zhou and Z. Yang, Appl. Surf. Sci., 2021, 557, 149796 CrossRef CAS.
- H.-b. Li, J. Zhang, G.-y. Huang, S.-h. Fu, C. Ma, B.-y. Wang, Q.-r. Huang and H.-w. Liao, Trans. Nonferrous Met. Soc. China, 2017, 27, 868–875 CrossRef CAS.
- J. Hu, X. Li, J. Qu, X. Yang, Y. Cai, T. Yang, F. Yang and C. M. Li, Chem. Eng. J., 2023, 453, 139957 CrossRef CAS.
- J. Hu, C. Chen, H. Yang, F. Yang, J. Qu, X. Yang, W. Sun, L. Dai and C. M. Li, Appl. Catal., B, 2022, 317, 121723 CrossRef CAS.
- Y. Li, J. Wang, H. Yao, L. Dang and Z. Li, J. Mol. Catal. A: Chem., 2011, 334, 116–122 CrossRef CAS.
- C. Chang, H. Yang, L. Kan, W. Mu, Q. Wang, S.-Y. Lu and B. Deng, J. Taiwan Inst. Chem. Eng., 2021, 125, 176–185 CrossRef CAS.
- C. Lai, F. Huang, G. Zeng, D. Huang, L. Qin, M. Cheng, C. Zhang, B. Li, H. Yi, S. Liu, L. Li and L. Chen, Chemosphere, 2019, 224, 910–921 CrossRef CAS PubMed.
- C. Hu, J. C. Yu, Z. Hao and P. K. Wong, Appl. Catal., B, 2003, 46, 35–47 CrossRef CAS.
- B. Ma, S. Xin, X. Ma, C. Zhang and M. Gao, Appl. Surf. Sci., 2021, 551, 149480 CrossRef CAS.
- Y. Zhu, Y. Wang, W. Yao, R. Zong and Y. Zhu, RSC Adv., 2015, 5, 29201–29208 RSC.
- X. a. Dong, W. Zhang, Y. Sun, J. Li, W. Cen, Z. Cui, H. Huang and F. Dong, J. Catal., 2018, 357, 41–50 CrossRef.
- Y. Zhou, Y. Zhang, M. Lin, J. Long, Z. Zhang, H. Lin, J. C. Wu and X. Wang, Nat. Commun., 2015, 6, 8340 CrossRef PubMed.
- Q. Chen, S. Wu and Y. Xin, Chem. Eng. J., 2016, 302, 377–387 CrossRef CAS.
- J. Xu, Z. Bian, X. Xin, A. Chen and H. Wang, Chem. Eng. J., 2018, 337, 684–696 CrossRef CAS.
Footnotes |
| † Electronic supplementary information (ESI) available. See DOI: https://doi.org/10.1039/d2ra07460e |
| ‡ These authors contributed equally to the work. |
| This journal is © The Royal Society of Chemistry 2023 |

