 Open Access Article
Creative Commons Attribution 3.0 Unported Licence
Vibrational spectra of neutral and doped oligothiophenes and polythiophene†
Stewart F. Parker *,
Jessica E. Trevelyan
 and
Hamish Cavaye
ISIS Neutron and Muon Source, STFC Rutherford Appleton Laboratory, Chilton, Didcot, OX11 0QX, UK. E-mail: stewart.parker@stfc.ac.uk
First published on 13th February 2023
Abstract
We have measured the infrared, Raman and inelastic neutron scattering (INS) spectra of a series of oligothiophenes (bithiophene, terthiophene, quarterthiophene, sexithiophene and octithiophene) and polythiophene, both pristine and after doping with iodine. The spectra of the pristine (i.e. neutral) systems show a rapid convergence towards the spectrum of polythiophene, such that the spectra of sexithiophene and octithiophene are almost indistinguishable from that of polythiophene. The spectra, in combination with periodic density functional theory calculations, have also provided the first complete assignment of polythiophene. In contrast to the infrared and Raman spectra that show dramatic changes on doping, the INS spectra show only small changes. Isolated molecule DFT calculations show that the molecular structures are not greatly modified on doping and since the INS spectrum largely depends on the structure, this does not change much. In contrast, as shown by others, the electronic structure is greatly modified and this accounts for the major changes in the infrared and Raman spectra.
1. Introduction
Since the discovery1 of the first conducting polymer (Br doped polyacetylene), the field has rapidly expanded.2 The interest in conducting polymers arises from their attractive properties. These include favourable electronic properties and component versatility, and potentially, low production and installation costs because they are lightweight and solution processable.3 This makes large area and flexible devices possible and enables them to be used in a range of electronic applications, including solar cells,4 organic light-emitting diodes (OLEDs)5 and sensors.6 There are a wide range of materials available, however, the oligothiophenes7 and polythiophene8 have attracted intense interest due to their chemical stability6 and electrical conductivity, in particular when doped with iodine.9The oligothiophenes have long been used as model compounds to understand the spectroscopy of polythiophene, both in the pristine10–18 and doped state.10,19 There are also many studies of doped polythiophene itself e.g.10,19–24 The spectral assignments have been supported by computational studies at levels of theory ranging from empirical force field25 to semi-empirical13 to Hartree–Fock15 to density functional theory (DFT).17,24,26–31
Most of the spectroscopic studies have used infrared and Raman spectroscopy. In these, the intensity of a mode is determined by the electro-optical response of the material (dipole moment derivative and polarisability derivative respectively). These properties are drastically altered on doping, which makes determining structural information from the spectra very difficult. In contrast, the intensity of a mode in inelastic neutron scattering (INS) spectroscopy is determined by the amplitude of motion of the atoms in a mode and the incoherent scattering cross section.32 Neither of these depend on the electronic structure: the former depends on the molecular structure and the latter is a fundamental property of the scattering atom(s). This means that INS spectroscopy is sensitive to the local structure in the material. There have been several studies of the oligothiophenes that included INS data15,17,26,27 but none have directly made the link to polythiophene. The INS spectrum of polythiophene has only been reported twice,33,34 one of which was low resolution and of limited energy transfer range.33
In this paper we show how the INS spectra of the oligothiophenes evolve into that of polythiophene and then use DFT calculations of the unit cell of polythiophene to provide a complete assignment of the material. We then investigate how doping changes the spectra and compare DFT calculated INS spectra of doped materials with the experimental spectra to determine both the degree of doping and gain insight into the structural changes caused by doping.
2. Experimental
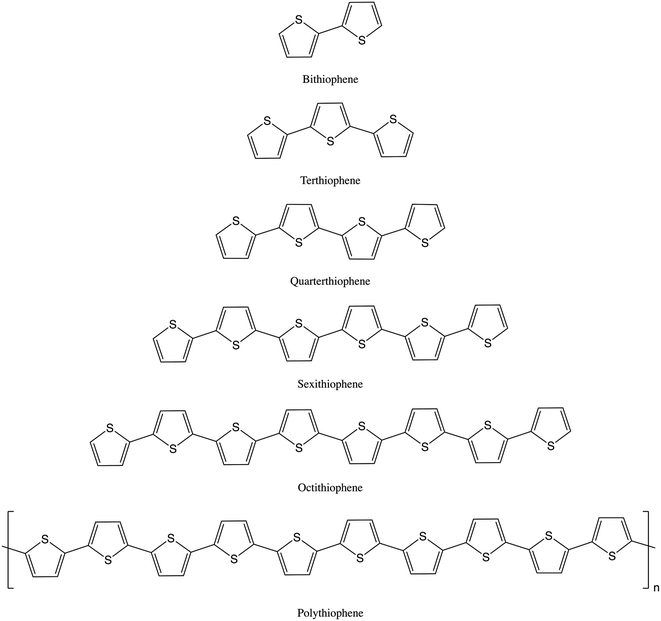
2,2′-Bithiophene (2T), 2,2′:5′,2′′-terthiophene (3T), 2,2′:5′:2′′:5′′,2′′′-quarterthiophene (4T) and 2,2′:5′:2′′:5′′,2′′′:5′′′,2′′′′:5′′′′,2′′′′′-sexithiophene (α-sexithiophene, 6T) were purchased from Aldrich, 2,2′:5′:2′′:5′′,2′′′:5′′′,2′′′′:5′′′′,2′′′′′:5′′′′′,2′′′′′′:5′′′′′′,2′′′′′′′-octithiophene (α-octithiophene, 8T) was purchased from Tokyo Chemical Industry and polythiophene (PT) was purchased from Rieke Metals. The characterisation of the PT sample is presented in the ESI.† All were used as received. The structures are shown in Fig. 1. Iodine doping was attempted by using a KI-I2 aqueous solution but was unsuccessful except for 6T. The materials were doped by exposure to I2 vapour in a desiccator. Iodine content was determined from the weight gain. The final loadings of iodine-per-thiophene ring were: 3T 1.19, 4T 1.38, 6T 0.20, PT 0.46. We were unable to dope 2T by either method.Infrared spectra (4 cm−1 resolution, 256 scans, 8 times zerofilling) were recorded at room temperature with a Bruker Vertex 70 Fourier transform infrared spectrometer using a Bruker Diamond single reflection total internal reflection (ATR) accessory. The spectra were corrected for the wavelength dependent pathlength using the Bruker software. Raman spectra were recorded with a Bruker FT-Raman spectrometer (64 scans at 4 cm−1 resolution with 10–200 mW laser power at 1064 nm, 8 times zerofilling). INS spectra were recorded at <10 K using the TOSCA35,36 spectrometer at ISIS. TOSCA provides excellent quality spectra in the 0–1800 cm−1 region. At higher energy transfer, the spectra suffer from both resolution broadening (the resolution degrades with increasing energy transfer32) and are dominated by combination modes of the fundamentals and the lattice modes. This is particularly the case in the C–H stretch region, such that the spectra do not offer any useful information in this region. This is explained in more detail elsewhere.37
Isolated molecule DFT calculations were carried out with Gaussian 09.38 The 6-311g(d) basis set with the B3LYP functional was used. Infrared and Raman spectra were generated from the Gaussian output using GaussSum.39 Dispersion corrected (DFT-D) periodic calculations were carried out using the plane wave pseudopotential method as implemented in the CASTEP code.40,41 Exchange and correlation were approximated using the PBE42 functional with the Tkatchenko–Scheffler (TS) dispersion correction scheme43 within the generalized gradient approximation (GGA). The plane-wave cut-off energy was 1000 eV. Brillouin zone sampling of electronic states was performed on 10 × 10 × 4 Monkhorst–Pack grid (30 k-points). The equilibrium structure, an essential prerequisite for lattice dynamics calculations was obtained by BFGS geometry optimization after which the residual forces were converged to ±0.00755 eV Å−1. Phonon frequencies were obtained by diagonalization of dynamical matrices computed using density-functional perturbation theory44 and also to compute the dielectric response and the Born effective charges, and from these the mode oscillator strength tensor and infrared absorptivity were calculated. In addition to the calculation of transition energies and intensities at zero wavevector, phonon dispersion was also calculated along high symmetry directions throughout the Brillouin zone. For this purpose, dynamical matrices were computed on a regular grid of wavevectors throughout the Brillouin zone and Fourier interpolation was used to extend the computed grid to the desired fine set of points along the high-symmetry paths.45 The atomic displacements in each mode that are part of the Gaussian and CASTEP outputs, enable visualization of the modes to aid assignments and are also all that is required to generate the INS spectrum using the program AbINS.46 It is emphasised that for all the calculated spectra shown the transition energies have not been scaled.
3. Results and discussion
3.1 Assignment of the spectrum of polythiophene
The structures of the oligothiophenes have all been determined by single crystal X-ray diffraction (2T,47,48 3T,49,50 4T,51 6T,52 8T![[thin space (1/6-em)]](https://www.rsc.org/images/entities/char_2009.gif) 53) and that of polythiophene itself by X-ray powder diffraction.54 All of the oligothiophenes are planar with either C2v (odd-T) or C2h (even-T) symmetry. PT itself is also planar.54 All of the oligothiophenes and polythiophene adopt the alternating structure (“S-up, S-down, S-up…”) shown in Fig. 1.
53) and that of polythiophene itself by X-ray powder diffraction.54 All of the oligothiophenes are planar with either C2v (odd-T) or C2h (even-T) symmetry. PT itself is also planar.54 All of the oligothiophenes and polythiophene adopt the alternating structure (“S-up, S-down, S-up…”) shown in Fig. 1.
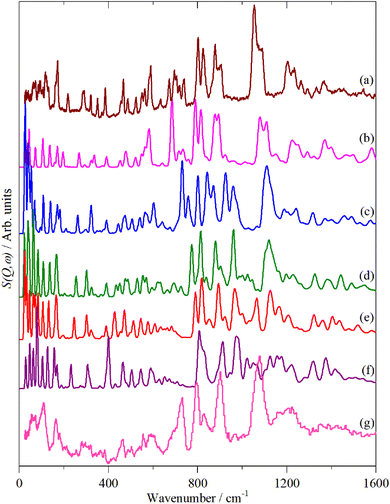
Fig. 2–4 shows the infrared FT-Raman and INS spectra of the materials. The evolution of the spectra of the oligothiophenes to that of polythiophene is readily apparent. As might be expected, the spectra of bithiophene are the most different from that of polythiophene: the former is essentially only the chain termination and the latter is largely composed of linking thiophenes. The spectra of the oligothiophenes have been assigned previously (2T,10,15,17,26 3T,10 4T,10,14,15,27 6T,14,15,27,55 8T![[thin space (1/6-em)]](https://www.rsc.org/images/entities/char_2009.gif) 14).
14).
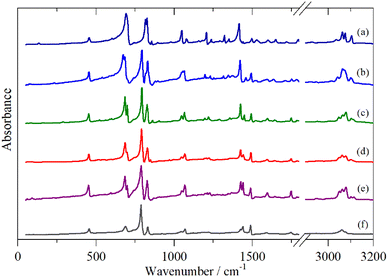 | ||
| Fig. 2 Infrared spectra of the oligothiophenes and polythiophene. (a) 2T, (b) 3T, (c) 4T, (d) 6T, (e) 8T and (f) PT. | ||
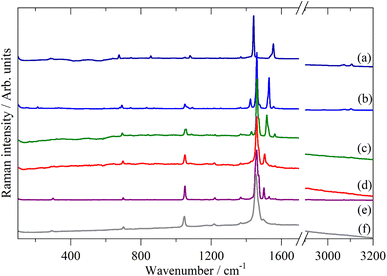 | ||
| Fig. 3 FT-Raman spectra of the oligothiophenes and polythiophene. (a) 2T, (b) 3T, (c) 4T, (d) 6T, (e) 8T and (f) PT. | ||
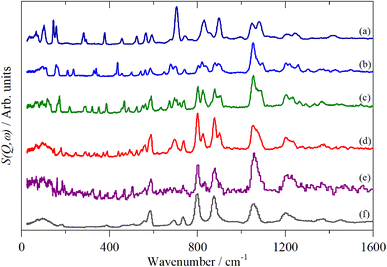 | ||
| Fig. 4 INS spectra of the oligothiophenes and polythiophene. (a) 2T, (b) 3T, (c) 4T, (d) 6T, (e) 8T and (f) PT. | ||
The structure of polythiophene contains two chains (four rings) per unit cell.54,56 The crystallography shows that the space group is probably Pna21 (no. 33) with the “molecules” on a C1 site. However, the bond distances in all four rings are the same (to three decimal places), thus the structure can be described in the higher symmetry space group Pnma (no. 62) with the mid-point of the inter-ring bond on a site of Ci symmetry. The additional symmetry significantly simplifies the lattice dynamic calculations. The factor group is D2h and the modes at the Γ-point (k = 0) in the Brillouin zone comprise:
| 11Ag + 10B1g + 11B2g + 10B3g + 10Au + 11B1u + 10B2u + 11B3u |
The presence of two chains in the unit cell means that each mode in the crystal consists of an in-phase and out-of-phase pair, hence the total representation can be simplified to:
| 11(Ag + B2g) + 10(B1g + B3g) + 10(Au + B2u) + 11(B1u + B3u) |
The symmetry does not permit in-plane and out-of-plane modes to mix, so the representation can be divided into:
| In-plane = 7(Ag + B2g) + 7(B1g + B3g) + 6(Au + B2u) + 6(B1u + B3u) |
| Out-of-plane = 2(Ag + B2g) + 3(B1g + B3g) + 2(Au + B2u) + 3(B1u + B3u) |
The remaining modes (2(Ag + B2g) + 2(Au + B2u) + 2(B1u + B3u)) are translations and librations of the entire chain.
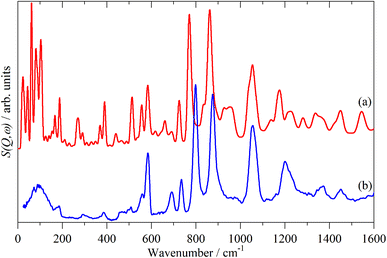
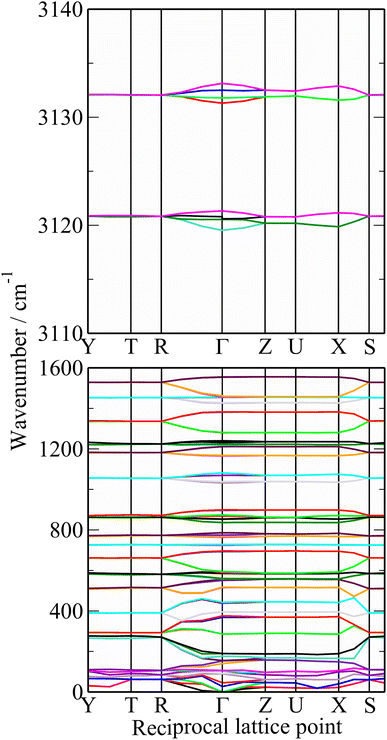
A comparison of a DFT calculation of the INS spectrum for the vibrational modes across the entire Brillouin zone with the experimental INS spectrum is shown in Fig. 5 (INS spectroscopy is sensitive to modes at all wavevectors, k, not just those at k = 0 as for infrared and Raman spectroscopy32). The dispersion curves are shown in Fig. 6. The agreement in Fig. 5 is generally good, particularly in the 500–1600 cm−1 region, where both the transition energy and intensity are well-reproduced. In the region below 500 cm−1, the transition energies are accurately reproduced but the intensities are somewhat over-estimated. Most of the modes in this region are out-of-plane modes (see Table 1) and if there were some degree of orientation in the sample, this would affect the intensities. (For an INS transition to have any intensity, the momentum transfer vector,  , must be parallel to the direction of motion). In the 0–200 cm−1 region the whole-body translations and librations occur. The lack of structure in the experimental spectrum suggests that the sample is poorly crystalline.
| Observeda/cm−1 | CASTEPb/cm−1 | Description | |||
|---|---|---|---|---|---|
| Infrared | Raman | INS | Averagec | Ranged | |
| a s = strong, m = medium, w = weak, br = broad, sh = shoulder, v = very.b Transition energies at the Γ-point of the complete unit cell containing two chains.c Average of the factor group split transition energies at the Γ-point.d Difference between the highest and lowest transition energy of the factor group at the Γ-point. | |||||
| 58 w | Translation | ||||
| 72 w | Translation | ||||
| 100 w | 100 br, m | Translation/libration | |||
| 185 w | 189 | 0 | Inter-ring in-plane deformation | ||
| 293 vw | 293 w | 286 | 0 | Inter-ring in-plane deformation | |
| 386 w | 395 | 0 | Inter-ring in-plane deformation | ||
| 456 m | 458 w | 440 | 5 | Intra-ring torsion | |
| 509 w | 517 | 1 | Inter-ring in-plane deformation | ||
| 558 w | 555 | 9 | Intra-ring torsion | ||
| 584 w | 585 m | 584 | 0 | Inter-ring in-plane deformation | |
| 701 m | 701 vw | 692 m | 695 | 3 | Intra-ring in-plane deformation |
| 737 vw | 735 m | 727 | 2 | Intra-ring in-plane deformation | |
| 786 s | 799 s | 780 | 12 | Out-of-plane C–H bend | |
| 830 m | 836 | 1 | Intra-ring in-plane deformation | ||
| 876 s | 871 | 5 | Out-of-plane C–H bend | ||
| 1044 w, 1070 w | 1047 vw | 1055 m | 1075 | 13 | In-plane C–H bend |
| 1200 m | 1167 | 2 | In-plane C–H bend | ||
| 1368 vw | 1372 w | 1382 | 1 | Ring stretch | |
| 1425 vw, 1439 w | 1430 w | 1455 | 1 | Ring stretch | |
| 1456 vs | 1451 w | Ring stretch | |||
| 3047 sh | C–H stretch | ||||
| 3061 w | C–H stretch | ||||
| 3074 w | C–H stretch | ||||
The dispersion curves in Fig. 6 are largely flat, showing that little dispersion (variation of transition energy with wavevector) is present. This is somewhat surprising as the polymer chain provides an ideal mechanism (connection between neighbouring unit cells) for dispersion to occur, as seen in polyethylene.57
Table 1 lists the observed and calculated modes, together with assignments based on the mode visualisation. A more detailed description for each mode is given in Table S1.† It can be seen that the factor group splitting is small for the internal modes: the largest is 13 cm−1 and for most of them it is 5 cm−1 or less.
3.2 The effect of doping on the oligothiophenes and polythiophene
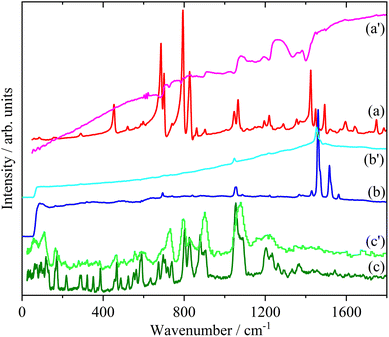
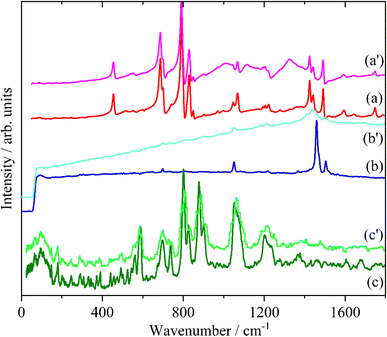
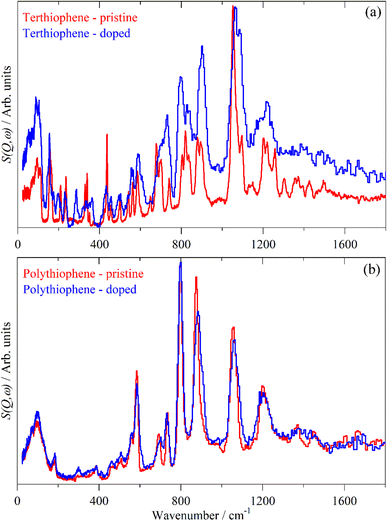
Doping of the oligothiophenes or polythiophene with either electron donors or acceptors produces large increases in conductivity.8 The changes in the electronic structure caused by doping result in dramatic changes in the infrared and Raman spectra as shown for pristine and I2 doped 4T and 6T in Fig. 7 and 8 respectively. These represent a heavily doped (4T: 1.38 I per T ring) and a lightly doped (6T: 0.20 I per T ring) system. In contrast, the INS spectra of the same systems (Fig. 7c, c’ and 8c, c’) and those of 3T and PT (Fig. 9) show relatively minor changes in the spectra. 4T shows the largest changes but these are more like a loss of resolution than new bands appearing. The INS spectrum of doped PT only shows changes in relative intensity of the modes. The band shifts are only a few cm−1 at most.There are a number of possible reasons why the INS spectra are relatively insensitive to doping. It may be that doping results in a core–shell particle structure with a thin layer of doped material while the bulk is untouched. As neutrons are highly penetrating, the spectra will be an average of the shell and the core, with the latter dominating owing to its greater proportion. We do not consider this likely as PT is poorly crystalline: values of 35![[thin space (1/6-em)]](https://www.rsc.org/images/entities/char_2009.gif) 56 to 66%58 crystallinity are quoted and halogens readily permeate amorphous regions of polymers, as seen for polyethylene59 and polyisoprene.60
56 to 66%58 crystallinity are quoted and halogens readily permeate amorphous regions of polymers, as seen for polyethylene59 and polyisoprene.60
The most likely reason is that the INS intensities do not depend on the electronic structure in the same way that infrared and Raman spectroscopy do. The mode intensity for the latter two depends on changes in electronic properties (dipole moment and polarizability respectively) whereas for INS it is determined by the amplitude of motion of the atoms in the mode and their cross section. The former is a function of the molecular structure, if this is largely unchanged on doping, then the INS spectrum will also be largely unchanged. This is exemplified in the series C60, K3C60 and Rb6C60 which contain C60, [C60]3− and [C60]6− entities that all exhibit very similar INS spectra.61
From Fig. 2–4, it is apparent that the spectra of the oligothiophenes quickly evolve towards that of polythiophene, such that 6T and 8T strongly resemble that of PT. To investigate the effect of doping on the INS spectrum of PT, we have used 4T and 6T as model compounds to make the calculations as function of doping level feasible in a reasonable time. These were also chosen because our experimental data represent a heavily doped and a lightly doped (4T: 1.38, 6T: 0.20 iodine per thiophene ring) system. We have calculated 4T with charges from 0 to +4 (denoted 4T0, 4T + 1, 4T + 2 etc…) and 6T from 0 to +6 (denoted 6T0, 6T + 1, 6T + 2 etc…).
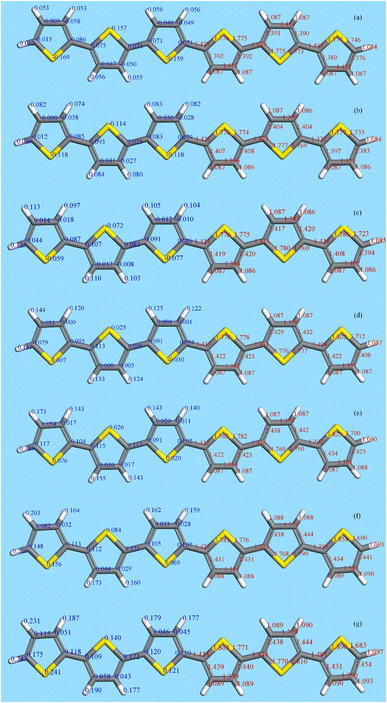
Fig. 10 shows the results for 6T (4T is similar). The left side shows the Mulliken charges (in blue) and the right the bond distances (in red). Note that 6T is centrosymmetric. Concerning the charges, in the neutral molecule, 6T0, the carbon and hydrogen atoms are slightly positive and the sulfur atoms are slightly negative. As the charge increases, all the atoms become more positive with the endmost atoms being the most positive. However, the charge is distributed across all of the atoms, it is not localised, although the endmost atoms experience the largest increase. This is mirrored in the bond lengths; all of the C–C and C–S distances increase on doping, except for the C2–C3 bond (see Fig. 11) which shrinks, although the change is small (∼+0.01 Å) for the C–H bondlengths.
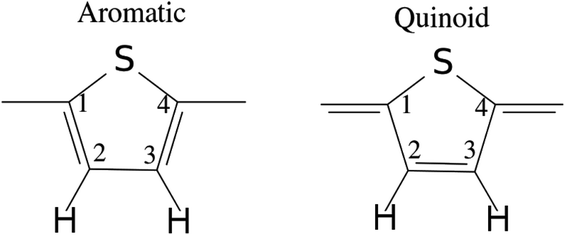 | ||
| Fig. 11 Illustration of the benzenoid and quinoid structures in PT. Adapted from ref. 66 under a Creative Commons Attribution 4.0 International License. | ||
There have been many calculations of the effect of doping on the structure of the oligothiophenes, PT and related materials e.g.62–66 There is general agreement that doping induces the quinoid-type structure from the aromatic structure of the neutral systems (see Fig. 11 for an illustration of the structures) and our results are consistent with this picture. However, most of the discussion has been in terms of localised defects and we do not see this, rather the charge is distributed across the entire molecule.
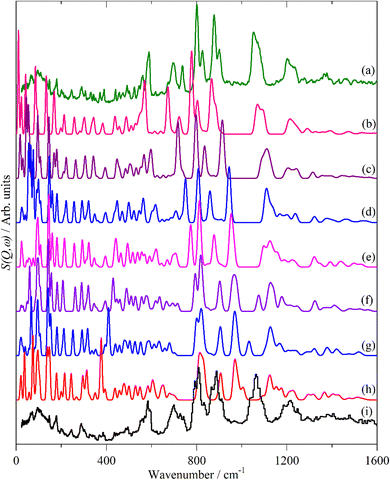
Fig. 12 and 13 compare the experimental INS spectra (neutral and doped) with those calculated for 6T and its ions and 4T and its ions, respectively. The first point to note is that the experimental and calculated spectra of the neutral ions (Fig. 12a, b and 13a, b) are in good agreement, which provides confidence that the calculations are reliable. In both systems, it can be seen that the modes around 700 cm−1 shift to higher energy and merge into those around 800 cm−1. Visualisation of the modes shows that those near 700 cm−1 are in-plane ring deformations and those around 800 cm−1 are out-of-plane C–H bending modes. The increase in the in-plane modes suggests that the quinoid structure is stiffer than the parent aromatic structure. The constancy of the C–H bending modes (and also of the C–H stretch) modes is consistent with the very small changes in C–H bond length that occur on doping.
6T represents a lightly doped system (0.2 iodine-per-thiophene ring) and inspection of Fig. 12 shows that the best match for the doped spectrum (Fig. 12i) is intermediate between the neutral system (6T0, Fig. 12b) and the +1 system (6T + 1, Fig. 12c). 4T is a much more highly doped system (1.38 iodine-per-thiophene ring) and the change in the INS spectrum is more marked (c.f. Fig. 13a and g). By inspection, the best match is intermediate between the +1 and +2 systems (Fig. 13c and d). This represents 0.25–0.5 iodine-per-thiophene ring, which indicates that not all of the dopant has been effective. We examined the Raman spectra of the doped materials for evidence of polyiodide anions or unreacted I2 but did not find any.
4. Conclusions
In this paper we have measured the vibrational spectra (infrared, Raman and INS) of a series of oligothiophenes and polythiophene, both pristine and after doping with iodine. The pristine (i.e. neutral) systems show a rapid convergence towards the spectrum of PT, such that the spectra of 6T and 8T are almost indistinguishable from that of polythiophene.In contrast to the infrared and Raman spectra that show dramatic changes on doping, the INS spectra show only small changes. Isolated molecule DFT calculations show that the molecular structures are not greatly modified on doping and since the INS spectrum largely depends on the structure, this does not change much. In contrast, as shown by others,62–66 the electronic structure is greatly modified and this accounts for the major changes in the infrared and Raman spectra.
Conflicts of interest
There are no conflicts of interest to declare.Acknowledgements
The authors thank the STFC Rutherford Appleton Laboratory for access to neutron beam facilities via beam time proposal RB1720055,67 and STFC's e-Science facility for computing resources (time on the SCARF compute cluster for the CASTEP calculations). The Research Complex at Harwell is thanked for access to, and support of, their facilities and equipment, including the FT-Raman spectrometer.References
- H. Shirakawa, E. J. Louis, A. G. MacDiarmid, C. K. Chiang and A. J. Heeger, J. Chem. Soc., Chem. Commun., 1977, 578–580 RSC.
- N. Hall, Chem. Commun., 2003, 1–4 Search PubMed.
- K. A. Mazzio and C. K. Luscombe, Chem. Soc. Rev., 2015, 44, 78–90 RSC.
- Y.-J. Cheng, S.-H. Yang and C.-S. Hsu, Chem. Rev., 2009, 109, 5868–5923 CrossRef CAS PubMed.
- C. Wang, H. Dong, L. Jiang and W. Hu, Chem. Soc. Rev., 2018, 47, 422–500 RSC.
- J. G. Ibanez, M. E. Rincón, S. Gutierrez-Granados, M. Chahma, O. A. Jaramillo-Quintero and B. A. Frontana-Uribe, Chem. Rev., 2018, 118, 4731–4816 CrossRef CAS PubMed.
- G. Horowitz, P. Delannoy, H. Bouchriha, F. Deloffre, J. L. Fave, F. Garnier, R. Hajilaoui, M. Heyman, F. Kouki, P. Valat, V. Wintgens and A. Yassar, Adv. Mater., 1994, 6, 752–755 CrossRef CAS.
- T. P. Kaloni, P. K. Giesbrecht, G. Schreckenbach and M. S. Freund, Chem. Mater., 2017, 29, 10248–10283 CrossRef CAS.
- T. Yamamoto, K.-I. Sanechika and A. Yamamoto, Bull. Chem. Soc. Jpn., 1983, 56, 1503–1507 CrossRef CAS.
- M. Akimoto, Y. Furukawa, H. Takeuchi, I. Harada, Y. Soma and M. Soma, Synth. Met., 1986, 15, 353–360 CrossRef CAS.
- Y. Furukawa, M. Akimoto and I. Harada, Synth. Met., 1987, 18, 151–156 CrossRef CAS.
- Y. Cao, D. Guo, M. Pang and R. Quian, Synth. Met., 1987, 18, 189–194 CrossRef CAS.
- J. T. Lopez Navarrete and G. Zerbi, J. Chem. Phys., 1991, 94, 957–964 CrossRef CAS.
- G. Louarn, J. P. Buisson, S. Lefran and D. Fichou, J. Phys. Chem., 1995, 99, 11399–11404 CrossRef CAS.
- A. D. Esposti, O. Moze, C. Taliani, J. T. Tomkinson, R. Zamboni and F. Zerbetto, J. Phys. Chem. A, 1996, 104, 9704–9718 CrossRef.
- E. Agosti, M. Rivola, V. Hernandez, M. Del Zoppo and G. Zerbi, Synth. Met., 1999, 100, 101–112 CrossRef CAS.
- L. van Eijck, M. R. Johnson and G. J. Kearley, J. Phys. Chem. A, 2003, 107, 8980–8984 CrossRef CAS.
- P. Hermet, N. Izzard, A. Rahmani and Ph. Ghosez, J. Phys. Chem. B, 2006, 110, 24869–24875 CrossRef CAS.
- Y. Cao and R. Quian, Solid State Commun., 1985, 54, 211–213 CrossRef CAS.
- D. Komarudin, A. Morita, K. Osakada and T. Yamamoto, Polym. J., 1998, 30, 860–862 CrossRef.
- S. Nejati and K. K. S. Lau, Langmuir, 2011, 27, 15223–15229 CrossRef CAS.
- J. Yamamoto and Y. Furukawa, J. Phys. Chem. B, 2015, 119, 4788–4794 CrossRef CAS.
- D. Kumar, R. Tiwari, D. K. Verma, S. Yadav, P. Adhikarya and S. Krishnamoorthi, Soft Matter, 2021, 17, 9697–9707 RSC.
- T. F. Harrelson, Y. Q. Cheng, J. Li, I. E. Jacobs, A. J. Ramirez-Cuesta, R. Faller and A. J. Moulé, Macromol., 2017, 50, 2424–2435 CrossRef CAS.
- G. Louarn, J.-Y. Mevellec, J. P. Buisson and S. Lefrant, Synth. Met., 1993, 55–57, 587–592 CrossRef.
- P. Hermet, J.-L. Bantignies, A. Rahmani, J.-L. Sauvajol and M. R. Johnson, J. Phys. Condens. Matter, 2004, 16, 7385–7396 CrossRef CAS.
- P. Hermet, J.-L. Bantignies, A. Rahmani, J.-L. Sauvajol and M. R. Johnson, J. Phys. Chem. A, 2005, 109, 4202–4207 CrossRef CAS.
- S. S. Zade and M. Bendikov, J. Phys. Chem. C, 2007, 111, 10662–10672 CrossRef CAS.
- S. C. Pop and T. A. Beu, Comput. Theor. Chem., 2012, 995, 66–74 CrossRef CAS.
- T. P. Kaloni, G. Schreckenbach and M. S. Freund, J. Phys. Chem. C, 2015, 119, 3979–3989 CrossRef CAS.
- W. J. M. J. Saumya, R. Jayasundara and G. Schreckenbach, J. Phys. Chem. C, 2020, 124, 17528–17537 CrossRef.
- P. C. H. Mitchell, S. F. Parker, A. J. Ramirez-Cuesta and J. Tomkinson, Vibrational spectroscopy with neutrons, with applications in chemistry, biology, materials science and catalysis, World Scientific, Singapore, 2005 Search PubMed.
- J. L. Sauvajol, D. Bormann, M. Palpacuer, J. P. Lère-Porte, J. J. E. Moreau and A. J. Dianoux, Synth. Met., 1997, 84, 569–570 CrossRef CAS.
- S. F. Parker, J. L. Parker and M. Jura, J. Phys. Chem. C, 2017, 121, 12636–12642 CrossRef CAS.
- S. F. Parker, F. Fernandez-Alonso, A. J. Ramirez-Cuesta, J. Tomkinson, S. Rudić, R. S. Pinna, G. Gorini and J. Fernández Castañon, J. Phys. Conf. Ser., 2014, 554, 012003 CrossRef.
- R. S. Pinna, S. Rudić, S. F. Parker, J. Armstrong, M. Zanetti, G. Škoro, S. P. Waller, D. Zacek, C. A. Smith, M. J. Capstick, D. J. McPhail, D. E. Pooley, G. D. Howells, G. Gorini and F. Fernandez-Alonso, Nucl. Instrum. Methods Phys. Res., 2018, 896, 68–74 CrossRef CAS.
- S. F. Parker, D. Lennon and P. W. Albers, Appl. Spectrosc., 2011, 65, 1325–1341 CrossRef CAS.
- M. J. Frisch, G. W. Trucks, H. B. Schlegel, G. E. Scuseria, M. A. Robb, J. R. Cheeseman, G. Scalmani, V. Barone, G. A. Petersson, H. Nakatsuji, X. Li, M. Caricato, A. Marenich, J. Bloino, B. G. Janesko, R. Gomperts, B. Mennucci, H. P. Hratchian, J. V. Ortiz, A. F. Izmaylov, J. L. Sonnenberg, D. Williams-Young, F. Ding, F. Lipparini, F. Egidi, J. Goings, B. Peng, A. Petrone, T. Henderson, D. Ranasinghe, V. G. Zakrzewski, J. Gao, N. Rega, G. Zheng, W. Liang, M. Hada, M. Ehara, K. Toyota, R. Fukuda, J. Hasegawa, M. Ishida, T. Nakajima, Y. Honda, O. Kitao, H. Nakai, T. Vreven, K. Throssell, J. A. Montgomery Jr., J. E. Peralta, F. Ogliaro, M. Bearpark, J. J. Heyd, E. Brothers, K. N. Kudin, V. N. Staroverov, T. Keith, R. Kobayashi, J. Normand, K. Raghavachari, A. Rendell, J. C. Burant, S. S. Iyengar, J. Tomasi, M. Cossi, J. M. Millam, M. Klene, C. Adamo, R. Cammi, J. W. Ochterski, R. L. Martin, K. Morokuma, O. Farkas, J. B. Foresman and D. J. Fox, Gaussian 09, Revision A.02, Gaussian, Inc., Wallingford CT, 2016 Search PubMed.
- N. M. O'Boyle, A. L. Tenderholt and K. M. Langner, J. Comput. Chem., 2008, 29, 839–845 CrossRef PubMed.
- S. J. Clark, M. D. Segall, C. J. Pickard, P. J. Hasnip, M. J. Probert, K. Refson and M. C. Payne, Z. Krystallog., 2005, 220, 567–570 CAS.
- K. Refson, P. R. Tulip and S. J. Clark, Phys. Rev. B, 2006, 73, 155114 CrossRef.
- J. Perdew, K. Burke and M. Ernzerhof, Phys. Rev. Lett., 1996, 77, 3865 CrossRef CAS.
- A. Tkatchenko and M. Scheffler, Phys. Rev. Lett., 2009, 102, 073005 CrossRef PubMed.
- V. Milman, A. Perlov, K. Refson, S. J. Clark, J. Gavartin and B. Winkler, J. Phys.: Condens. Matter, 2009, 21, 485404 CrossRef PubMed.
- X. Gonze, J.-C. Charlier and M. P. Teter, Phys. Rev. B: Condens. Matter Mater. Phys., 1994, 50, 13035–13038 CrossRef CAS.
- K. Dymkowski, S. F. Parker, F. Fernandez-Alonso and S. Mukhopadhyay, Physica B Condens. Matter, 2018, 551, 443–448 CrossRef CAS.
- P. A. Chaloner, S. R. Gunatunga and P. B. Hitchcock, Acta Crystallogr., 1994, C50, 1941–1942 CAS.
- M. Pelletier and F. Brisse, Acta Crystallogr., 1994, C50, 1942–1945 CAS.
- F. van Bolhuis, H. Wynberg, E. E. Havinga, E. W. Meijer and E. G. J. Staring, Synth. Met., 1989, 30, 381–389 CrossRef CAS.
- R. Azumi, M. Goto, K. Honda and M. Matsumoto, Bull. Chem. Soc. Jpn., 2003, 76, 1561–1567 CrossRef CAS.
- T. Siegrist, C. Kloc, R. A. Laudise, H. E. Katz and R. C. Haddon, Adv. Mater., 1998, 10, 379–382 CrossRef CAS.
- G. Horowitz, B. Bachet, A. Yassar, P. Lang, F. Demanze, J.-L. Fave and F. Garnier, Chem. Mater., 1995, 7, 1337–1341 CrossRef CAS.
- D. Fichou, B. Bachet, F. Demanze, I. Billy, G. Horowitz and F. Garnier, Adv. Mater., 1996, 8, 500–504 CrossRef CAS.
- S. Brückner and W. Porzio, Makromol. Chem., 1988, 189, 961–967 CrossRef.
- A. D. Esposti, M. Fanti, M. Muccini, C. Taliani and G. Ruani, J. Chem. Phys., 2000, 112, 5957–5969 CrossRef.
- Z. Mo, K.-B. Lee, Y. B. Moon, M. Kobayashi, A. J. Heeger and F. Wudl, Macromol, 1985, 18, 1972–1977 CrossRef CAS.
- G. D. Barrera, S. F. Parker, A. J. Ramirez-Cuesta and P. C. H. Mitchell, Macromol, 2006, 39, 2683–2690 CrossRef CAS.
- D. S. Kelkar and A. B. Chourasia, Indian J. Phys., 2012, 86, 101–107 CrossRef CAS.
- K. P. J. Williams and S. F. Parker, Polym. Commun., 1988, 29, 314–316 CAS.
- E. D. Owen and H. S. M. Al-Moh’d, Polymer, 1997, 38, 3533–3538 CrossRef CAS.
- K. Prassides, H. W. Kroto, R. Taylor, D. R. M. Walton, W. I. F. David, J. Tomkinson, R. C. Haddon, M. J. Rosseinsky and D. W. Murphy, Carbon, 1992, 30, 1277–1286 CrossRef CAS.
- Ch. Ehrendorfer and A. Karpfen, J. Phys. Chem., 1995, 99, 5341–5353 CrossRef CAS.
- J. Casado, V. Hernández, S. Hotta and J. T. López Navarrete, J. Chem. Phys., 1998, 109, 10419–10429 CrossRef CAS.
- S. S. Zade and M. Bendikov, J. Phys. Chem. C, 2007, 111, 10662–10672 CrossRef CAS.
- T. P. Kaloni, G. Schreckenbach and M. S. Freund, J. Phys. Chem. C, 2015, 119, 3979–3989 CrossRef CAS.
- A. Mirsakiyeva, H. W. Hugosson, X. Crispin and A. Delin, J. Electron. Mater., 2017, 46, 3071–3075 CrossRef CAS.
- S. F. Parker, INS studies of conducting polymers: oligothiophenes and polythiophene, STFC ISIS Facility, 2017, DOI:10.5286/ISIS.E.RB1720055.
Footnote |
| † Electronic supplementary information (ESI) available. See DOI: https://doi.org/10.1039/d2ra07625j |
| This journal is © The Royal Society of Chemistry 2023 |

