 Open Access Article
Real time monitoring of generation and decomposition of degradation products in lithium oxygen batteries during discharge/charge cycles by an online cold trap pre-concentrator-gas chromatography/mass spectroscopy system†
Yanan Gao ab,
Hidenori Noguchi
 ab and
Kohei Uosaki
 *c
*c
aGraduate School of Chemical Sciences and Engineering, Hokkaido University, Sapporo 060-8628, Japan
bCenter for Green Research on Energy and Environmental Materials, National Institute for Materials Science (NIMS), Tsukuba 305-0044, Japan
cSoftBank-NIMS Advanced Technologies Development Center, National Institute for Materials Science (NIMS), Tsukuba 305-0044, Japan. E-mail: uosaki.kohei@nims.go.jp
First published on 14th February 2023
Abstract
Degradation products of lithium oxygen batteries with a tetraethylene glycol dimethyl ether (TEGDME) electrolyte solution during discharge/charge cycles were monitored by an online cold trap pre-concentrator-gas chromatography/mass spectroscopy system in real time. A total of 37 peaks were detected and 27 of them were assigned to specific molecules. Degradation compounds were generated and decomposed in very complex manners during discharge/charge cycles. Most molecules were generated during charge as a result of the degradation of TEGDME by active oxygen species and/or electrochemical oxidation. These molecules generated during charge were decomposed during discharge by active oxygen species.
Introduction
There are worldwide efforts to develop next generation batteries to meet the strong demands for fossil fuel free transportation by electric vehicles and as energy storage devices for stabilizing the fluctuations of power generated renewable/natural energy sources such as solar cells and windmills. Requirements for next generation batteries are very diverse including higher energy density, higher power density, higher safety, longer cycle/calendar life, lower cost, lower resource constraints, and higher recyclability.Lithium-air batteries (LAB) have been considered as some of the most promising next generation batteries because of their very high theoretical energy density and transition-metal-free cathodes.1–10 There are, however, many issues to be solved before LAB can become practical.7–12 Water, CO2, and even N2 in air are harmful to LAB operation and, therefore, most of the fundamental researches were carried out using pure oxygen as an active material (lithium–oxygen battery; LOB). Even the cyclability of LOB is, however, still low mainly due to the degradation of positive electrode (carbon) and electrolyte solution and degradation of and dendrite formation at Li metal negative electrode.11–13 To improve the cyclability, it is essential to clarify the LOB degradation mechanism by analysing reaction products and intermediates produced during the discharge/charge processes.13–20 Among many techniques to examine these reaction products and intermediates such as X-ray diffraction,14,15 Raman spectroscopy,16,17 and mass spectroscopy (MS),18–20 MS provides the most direct information of the products and intermediates in real time.
We investigated the degradation mechanism of LOB with tetraethylene glycol dimethyl ether (TEGDME) electrolyte by using online quadrupole MS during charge and by post-analysis of organic compounds, which were collected by adsorption in small columns during the discharge and charge, by using thermal separation probe (TSP)-gas chromatography (GC)/MS.20 We have detected several molecules derived from TEGDME including mono- (G1), di- (G2), and tri- (G3) ethylene glycol dimethyl ether, methoxy acetaldehyde, (2-methoxyethoxy)ethene, 1-methoxy-2-(methoxymethoxy)ethane, 2-methoxy ethanol, acetic acid, and formic acid and showed their time dependencies during discharge/charge cycles. As far as the analysis of organic compounds by TSP-GC/MS are concerned, however, there are possibilities that the detected variety and quantity of molecules do not reflect those in the cell. The most serious concern is that some molecules did not remain in columns. Because the samples were collected in columns by adsorption and the quantity of each component should be determined by the adsorption/desorption equilibrium, molecules with low adsorption equilibrium constants might be replaced by molecules with high adsorption equilibrium constants during a rather long collection (adsorption) time (1 h).
Recently, we have developed an online cold trap pre-concentrator (CTPC)-GC/MS system, which was originally developed to detect organic molecules released from human skin,21 for the real time continuous detection of organic molecules generated in the cell and demonstrated its usefulness in detecting the reaction products of LOB during constant current discharge and voltage scan charge.22
Here, the CTPC-GC/MS system was applied to monitor products variation of LOB with 1 M lithium bis(trifluoromethanesulfonyl)imide (LiTFSI) TEGDME electrolyte solution during discharge/charge cycles periodically in real time and it was found that degradation compounds were generated and decomposed in very complex manners during discharge/charge cycles. Most molecules were generated during charge as a results of the degradation of TEGDME by active oxygen species and/or electrochemical oxidation. These molecules generated during charge were decomposed during discharge by active oxygen species.
Experimental methods
Materials
A CNT based carbon sheet (KJCNT donated by KJ Specialty Paper) was used as a cathode after baking treatment as it has more uniform and simpler pore structures than Ketjenblack and carbon nanotube-based cathodes, which we used for more practical cells. The KJCNT sheets were cut to 16 mm in diameter and baked in a tube furnace for 3 h at 900 °C under Ar atmosphere to increase porosity. The BET measurement showed that the distribution of pore size was in the ranges between 0.01 and 0.2 μm. Li metal foil (16 mm diameter and 200 μm thick; Honjo Metal) was used as received. TEGDME from Kishida Chemical (Li battery grade: ∼98%, BG-TEGDME) or from Sigma-Aldrich (≥99%, HP-TEGDME) and LiTFSI (Li battery grade from Kishida Chemical) were used to prepare electrolyte solutions. TEGDME and LiTFSI from Kishida Chemical (Li battery grade with relatively small amount of water) were used as received. TEGDME from Sigma-Aldrich contained higher amount of water and was dried by molecular sieve before use. 1 M LiTFSI TEGDME solution prepared in the dry room was used as an electrolyte solution and its water content was ca. 45 ppm as determined by Karl Fischer titration (Model: CA-21; Mitsubishi Chemical Analytech). A polyethylene (PE) membrane (20 μm thick, W-SCOPE) was cut to 19.5 mm in diameter and then dried in a vacuum oven (DP300; Yamato Scientific) for 10 h at 40 °C before use as a separator.Cell assembly
Details of cell assembly was reported in our previous paper.20 Briefly, a custom-made test cell (stainless steel; 45 mm inner diameter and 15 mm inner height) equipped with a gas inlet and outlet was assembled in a dry-booth (dew point less than −90 °C) in a dry-room (dew point less than −60 °C) by stacking a Li metal foil, a polyethylene membrane separator, on top of which 15 μL of the 1 M LiTFSI TEGDME solution was placed as uniformly as possible, a KJCNT sheet (50 μm thick), and a stainless steel mesh (16.7 mm diameter, 200 μm thick, and aperture ratio of 73%: Hohsen), and a conductive spring to provide the cell assembly with a pressure of 35 kPa.Operation of CTPC-GC/MS system
Fig. 1 shows (a) a schematic diagram of the online CTPC-GC/MS system and (b) sequence of CTPC operation. The system comprised a cell, a CTPC, a GC/MS, and their controllers. After the cell was assembled, it was connected to a dry O2 line (1 atm), a charge/discharge system (HJ1020mSD8, Hokuto Denko) and the CTPC (NIT-P-3R: Pico-Device). To initiate the sampling and GC/MS analysis, a small cryostat in the CTPC was cooled to the temperature of a pre-set value (−50 °C in this study) by liquid nitrogen by opening V3 (pre-cooling). At the same time, V5 is open to release the evaporated nitrogen. After the pre-cooling, e.g., 5 min, the head-space gas of the cell is pumped to the CTPC by setting V2 (three-way valve) to cell-CTPC flow for 15 s and collected in the cooled cryostat in the CTPC. To transfer the sample to GC/MS, V3 and V5 is closed and the temperature of the cryostat is raised to 120 °C so that trapped molecules are evaporated, and V1, V2, and V4 are set to He-V2, V1-CTPC, and open, respectively, so that He flows to the CTPC and carries the evaporated molecules to the GC/MS (GCMS-QP2010 Ultra; Shimadzu), which was equipped with a 20 m VF-WAX column (Agilent Technologies). After the completion of the sample transfer, the GC/MS analysis is initiated by a start signal from the CTPC controller. At the same time, V1, V4, and V5 are set to N2-V2, closed, and open, respectively, so that N2 flows to the CTPC to clean the cryostat. The column temperature of the GC is raised from 35 °C to 230 °C according to the pre-set program for the analysis. After the GC/MS analysis is completed, the column temperature is cooled down to 35 °C and V1, V2, and V5 are closed so that the system is ready for the next sampling.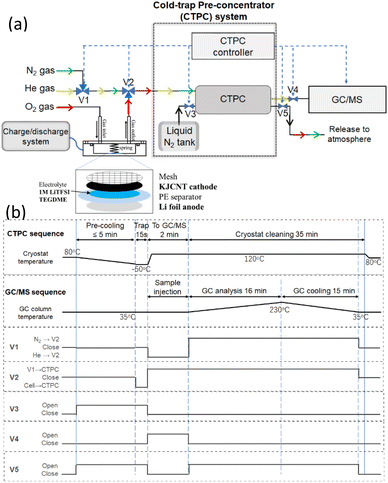 | ||
| Fig. 1 (a) Schematic diagram of online CTPC-GC/MS system and a cell. V1, V2, V3, V4, and V5 are solenoid valves controlled by the CTPC controller. (b) Sequences of CTPC-GC/MS operation. | ||
Results and discussion
Results obtained using TEGDME (BG) are mainly discussed here unless otherwise stated.CTPC-GC/MS analysis during the first discharge and charge
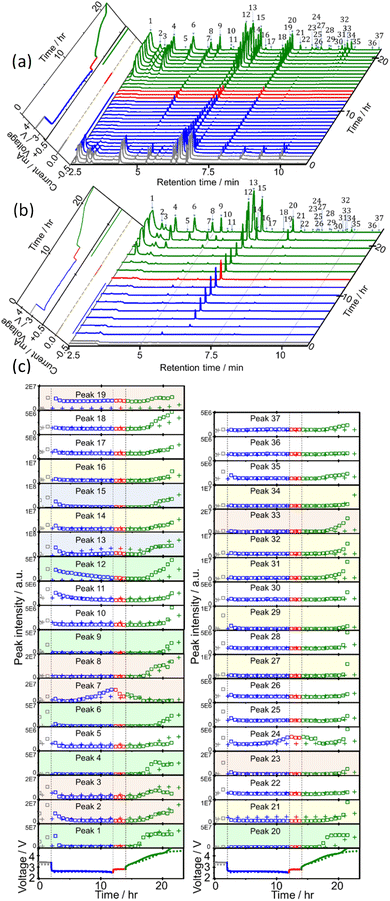
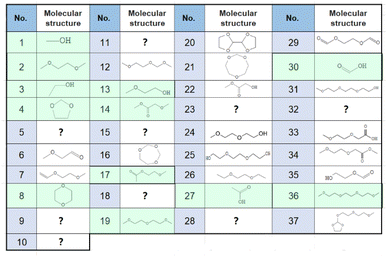
Sampling and analysis were started immediately after the cell was connected to the charge/discharge system and filled with O2 gas. Fig. 2(a) shows the total ion current gas chromatograms obtained every 40 min during the 1st discharge/charge cycle, i.e., OCP (2 h), constant-current (0.4 mA, 10 h) discharge, OCP (2 h), and constant-current (0.4 mA, 4.66 V cut off) charging. A total of 37 peaks were observed and 27 of them were assigned to specific molecules as reported before (Table 1).22 Time dependencies of voltage (bottom panels; solid line) and the peak intensities of all 37 peaks (□) during OCP, discharge, OCP, and charge are shown in Fig. 2(c). Many peaks were detected even before discharge started, showing the presence of impurity molecules in TEGDME.22When discharge was started, intensities of most peaks decreased. Intensities of only a few peaks such as peaks 7 ((2-methoxyethoxy)ethene), 13 (2-methoxy ethanol), 22 (methyl 2-hydroxyl acetate), and 24 ((2-(2-methoxyethoxy)ethanol)) increased at the later stage of discharge.
Many more peaks were detected during charge as shown in Fig. 2(a). It must be noted that peaks corresponding to the molecules, which were not detected in our previous TSP-GC/MS study20 such as methanol (peak 1) and ethanol (peak 3), were observed. The peak corresponding to G1 (peak 2) was stronger than that of G2 (peak 19) in the present study, while the G2 peak was stronger than G1 peak in the TSP-GS/MS analysis, although the conditions of GC operation were the same in both cases. These results confirmed that molecules of low adsorption strength were replaced by those of high adsorption strength during sample collection by column adsorption in the TSP-GC/MS analysis20 and showed the advantage of the present CTPC-GC/MS system over the previous method, i.e., the collection by column followed by post TSP-GC/MS analysis.
Although the intensities of most peaks increased during charge, the onset voltage for the peak increase varied with the peaks. Intensities of several peaks such as 1, 2 and 3 corresponding to relatively small and simple fragments of TEGDME increased from the early stage of charge but most other peaks increased from the middle or the last stage of charge when the voltage was relatively high. Peaks 7, 13, and 24, which increased at the last stage of discharge, behaved differently as they decreased at the early stage of charge but increased again at the later stage of charge as other peaks. Intensity increase in the middle and last stages of charge suggests the involvement of electrochemical oxidation at high voltage in the degradation process and/or the requirement of the accumulation of precursor molecules for the generation of complex molecules.
CTPC-GC/MS analysis during the discharge/charge cycles
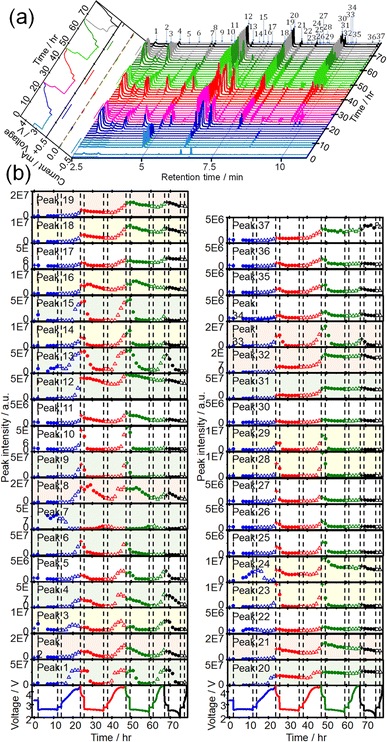
CTPC-GC/MS analysis was then carried out during discharge/charge cycles. Sampling was started immediately after the cell assembly, 5 h after discharge, and then every 90 min to minimize the sampling effect on the cell performance. Fig. 3(a) shows time dependencies of voltage and current (left panel) and GCs of head space gas of the LOB, sampled during 4 cycles of OCP (2 h), constant current (0.4 mA) discharge (10 h or 2 V cut off), OCP (2 h), constant current (0.4 mA) charge (10 h or 4.5 V cut off). Time dependencies of voltage (bottom panels) and the peak intensities of all 37 peaks during 4 cycles are shown in Fig. 3(b). The full capacity (10 h) discharge was possible in the first 3 discharge but the 4th discharge was terminated by cut off at 2 V (6.1 h). On the other hand, charge was terminated by cut off at 4.5 V even from the 1st charge (9.7 h) and charge duration (capacity) decreased as cycle number increased (2nd: 9.4 h, 3rd: 5.9 h, and 4th: 1.6 h). One reason for rather low cycle number is the lean electrolyte condition (15 μL/2 cm2) for the present cell operation.Peak intensities varied in very complex manners during discharge/charge cycles. Intensities of most peaks decreased during discharge and increased during charge repeatedly as cycles but the rate and quantity of increase and decrease during discharge and charge, respectively, depending on peak.
Intensities of most peaks decreased during the discharge in the following cycles; some peak, e.g., 6 (2-methoxy acetaldehyde), 13, and 14 (methyl 2-methoxyacetate), started to decrease immediately and some peaks, e.g., 1, 3, and 4 (1,3-dioxolane), started to decrease with delay. Peaks such as 8 (1,4-dioxane) and 16 (1,3,5-trioxepane) slightly increased at the initial stage of discharge before decrease. Peaks 7, 13, 22, and 24 increased at the last stage of the 1st discharge but only peak 7 increased during discharge in the following cycles. Peaks 13, 22 and 24 increased and decreased during charge and discharge, respectively, from the 2nd cycle as same as most other peaks behaved. Decay rates of some peaks such as 1, 2, 3, 4, and 29 (ethylene glycol diformate) were high and these peaks became nearly zero at the end of discharge and those of some other peaks such as 12 (1-methoxy-2-(methoxymethoxy)ethane), 16, 19, 20 (2,2′-bis(1,3-dioxolane)) and 37 (2-[2-(2-methoxyethoxy)ethoxy]-1,3-dioxolane) were low and these peaks remained at the end of discharge. Peak intensities increased again during the 2nd charge even more than those during the 1st charge and, therefore, intensities of most peaks were higher at the end of the 2nd cycle than those at the end of the 1st cycle.
Similar trends were observed during the 3rd discharge/charge cycles but the increases of peak intensities during charge were generally less than those in the 2nd charge with exceptions for some peaks such as 1, 3, and 4, which increased as much as during the 2nd charge. In the 4th cycle, while behaviours during the discharge were almost the same as those in the previous cycles, almost no changes were observed during charge as it was terminated only in 1.6 h and only one sampling was made during the charge.
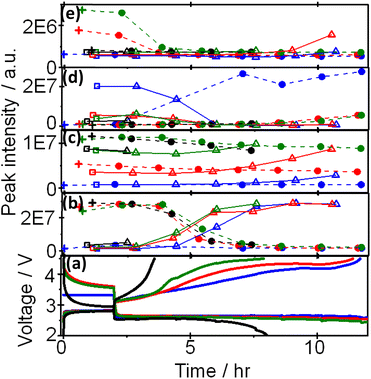
Based on the above results, peaks can be categorized into at least four groups represented by peaks 1 (methanol), 19 (G2), 7((2-methoxyethoxy)ethene), and 25 (triethylene glycol) as shown Fig. 4, in which voltage and intensities of these peaks are plotted as a function of time during OCP and discharge, and OCP and charge for the 1st, 2nd, 3rd, and 4th cycle. Peak 1 increased and decreased during charge and discharge, respectively, by almost the same amount up to the 4th discharge. Peak 19 increased and decreased during charge and discharge, respectively, as peak 1 but the amount of decrease during discharge was less than that of increase during charge and, therefore, the peak intensity gradually increased as cycle was repeated. Peak 25 increased and decreased during charge and discharge, respectively, as other peaks but it increased at the very last stage of charge and decreased and disappeared at the very early stage of discharge. Peak 7 was the only peak that increased during discharge and decreased during charge, repeatedly, while other peaks increased during charge and decreased during discharge.
Comparison of the results of LOBs prepared using TEGDME (BG) and TEGDME (HP)
CTPC-GC/MS analysis was also carried out for the LOB prepared by using TEGDME (HP). Sampling was started immediately after the cell was connected to the charge/discharge system, 30 min after O2 gas flow, and then every 90 min. Time dependencies of voltage and current (left panel) and GCs of head space gas of the LOB, sampled during 4 cycles of OCP (2 h), constant current (0.4 mA) discharge (10 h or 2 V cut off), OCP (2 h), constant current (0.4 mA) charge (10 h or 4.5 V cut off) are shown in Fig. S1(a)† and time dependencies of voltage and the peak intensities of all 37 peaks during 4 cycles are shown in Fig. S1(b).†Results for the 1st cycle of the LOB prepared by using TEGDME (HP) taken from Fig. S1† are shown in Fig. 2 for (b) time dependencies of voltage and current (left panel) and GCs and (c) time dependencies of voltage and the peak intensities of all 37 peaks together with the results of the LOB prepared by using TEGDME (BG). It is clear that initial impurity levels were much less in the LOB with TEGDME (HP) than in the LOB with TEGDME (BG) and, therefore, the decrease of peak intensities during the 1st discharge observed in the LOB with TEGDME (BG) was not observed in the LOB with TEGDME (HP). Increase of intensities at the last stage of charge observed for many peaks in the LOB with TEGDME (BG) were much less in the LOB with TEGDME (HP), reflecting smaller voltage rise in this cell than in the LOB with TEGDME (BG). Other features were essentially the same in the both cells, although the absolute amount intensity changes were different.
Cycle performance of the LOB with TEGDME (HP) was lower than that with TEGDME (BG) but the essential features presented in Fig. 4 for the LOB with TEGDME (BG) were similar in the LOB with TEGDME (HP) as shown in Fig. S2.† The increases of peaks during the 2nd, 3rd, and 4th charge in the LOB with TEGDME (HP) were generally less significant than in the LOB with TEGDME (BG), may be because of the short charge time.
Degradation during discharge and charge
Although active oxygen species such as super oxide and singlet oxygen are considered to play key roles in the degradation of electrolyte in LOB4,7–10 and these species were generated during both discharge and charge, degradation processes during discharge and charge were found to be quite different. During the charge, many molecules were generated particularly at the middle and last stage of charge. During discharge, only a few molecules were generated and most molecules generated during charge were decomposed. Thus, TEGDME was decomposed and many fragments and their reacted products were formed during the 1st charge. While small/simple fragments such as methanol, ethanol, and G1 were formed at relatively low voltage induced by active oxygen, which is released from Li2O2, more complex molecules were formed at the middle and last stages of charge possibly because of the involvement of electrochemical oxidation partly or fully (aldehyde and acid formation) and reactions of accumulated precursor molecules. In the 2nd discharge, almost all molecules generated during the 1st charge were decomposed. Delay in the decrease or even increase of the some peaks mainly due to small/simple molecules may be caused by the decomposition of more complex molecules. Small molecules were generated as degraded products of more complex molecules and decomposed by active oxygen species at the same time. As the decomposition of larger molecules became slower with time, the decomposition of small molecules, which seemed to proceed faster, became dominant and they were totally decomposed. Degradation of complex molecules led to the generation of smaller molecules and also the formation of oligomers of ethylene glycol dimethyl ethers as reported before.20 Increase of the peak intensities during the 2nd charge was more than during the 1st charge in the LOB with TEGDME (BG) but less in the LOB with TEGDME (HP). Behaviours of molecules during 3rd discharge and charge and 4th discharge were essentially the same as those in the previous cycles but peak changes were less significant.Conclusions
Degradation of TEGDME in LOB during discharge/charge cycles was investigated by monitoring the generation and decomposition molecules in real time using online CTPC-GC/MS system. A total of 37 GC/MS peaks was detected and 27 of them were assigned to specific molecules. Most molecules were generated during charge as a results of the degradation of TEGDME by active oxygen species and/or electrochemical oxidation. These molecules generated during charge were decomposed during discharge by active oxygen species. Effects of initial impurity levels in TEGDME on degradation behaviour were found but the cause for the difference is not clear at this stage. We are currently working for more detailed degradation mechanism by assigning more molecules and theoretical calculations.Conflicts of interest
There are no conflicts to declare.Acknowledgements
YG is a NIMS Junior Research Fellow of Center for Advanced Battery Collaboration supported by JST Grant (JPMJPF2016). KJCNT sheets were donated by KJCNT Specialty Paper. Materials characterizations and cell assembly were carried out in NIMS Battery Research Platform. We are grateful to Dr T. Tsuda of Pico-Device for the technical support in the development of CTPC system to be used in battery analysis.Notes and references
- K. M. Abraham and Z. Jiang, J. Electrochem. Soc., 1996, 143, 1–5 CrossRef CAS.
- W. Xu, K. Xu, V. V. Viswanathan, S. A. Towne, J. S. Hardy, J. Xiao, Z. Nie, D. Hu, D. Wang and J.-G. Zhang, J. Power Sources, 2011, 196, 9631–9639 CrossRef CAS.
- S. A. Freunberger, Y. Chen, Z. Peng, J. M. Griffin, L. J. Hardwick, F. Bardé, P. Novák and P. G. Bruce, J. Am. Chem. Soc., 2011, 133, 8040–8047 CrossRef CAS PubMed.
- H.-G. Jung, J. Hassoun, J.-B. Park, Y.-K. Sun and B. Scrosati, Nat. Chem., 2012, 4, 579–585 CrossRef CAS PubMed.
- Z. Peng, S. A. Freunberger, Y. Chen and P. G. Bruce, Science, 2012, 337, 563–566 CrossRef CAS PubMed.
- B. D. McCloskey, D. S. Bethune, R. M. Shelby, T. Mori, R. Scheffler, A. Speidel, M. Sherwood and A. C. Luntz, J. Phys. Chem. Lett., 2012, 3, 3043–3047 CrossRef CAS PubMed.
- D. Aurbach, B. D. McCloskey, L. F. Nazar and P. G. Bruce, Nat. Energy, 2016, 1, 16128 CrossRef CAS.
- T. Liu, J. P. Vivek, E. W. Zhao, J. Lei, N. Garcia-Araez and C. P. Grey, Chem. Rev., 2020, 120, 6558–6625 CrossRef CAS PubMed.
- W.-J. Kwak, Rosy, D. Sharon, C. Xia, H. Kim, L. R. Johnson, P. G. Bruce, L. F. Nazar, Y.-K. Sun, A. A. Frimer, M. Noked, S. A. Freunberger and D. Aurbach, Chem. Rev., 2020, 120, 6626–6683 CrossRef CAS PubMed.
- Z. Wu, Y. Tian, H. Chen, L. Wang, S. Qian, T. Wu, S. Zhang and J. Lu, Chem. Soc. Rev., 2022, 51, 8045–8101 RSC.
- S. Matsuda, M. Ono, S. Yamaguchi and K. Uosaki, Mater. Horiz., 2022, 9, 856–863 RSC.
- X. Yao, Q. Dong, Q. Cheng and D. Wang, Angew. Chem., Int. Ed., 2016, 55, 11344–11353 CrossRef CAS PubMed.
- Y.-C. Lu, B. M. Gallant, D. G. Kwabi, J. R. Harding, R. R. Mitchell, M. S. Whittingham and Y. Shao-Horn, Energy Environ. Sci., 2013, 6, 750–768 RSC.
- C. Song, K. Ito, O. Sakata and Y. Kubo, RSC Adv., 2018, 8, 26293–26299 RSC.
- K. P. C. Yao, D. G. Kwabi, R. A. Quinlan, A. N. Mansour, A. Grimaud, Y.-L. Lee, Y.-C. Lu and Y. Shao-Horn, J. Electrochem. Soc., 2013, 160, A824 CrossRef CAS.
- F. S. Gittleson, K. P. C. Yao, D. G. Kwabi, S. Y. Sayed, W.-H. Ryu, Y. Shao-Horn and A. D. Taylor, ChemElectroChem, 2015, 2, 1446–1457 CrossRef CAS.
- K. Tomita, H. Noguchi and K. Uosaki, ACS Appl. Energy Mater., 2018, 1, 3434–3442 CrossRef CAS.
- B. D. McCloskey, D. S. Bethune, R. M. Shelby, G. Girishkumar and A. C. Luntz, J. Phys. Chem. Lett., 2011, 2, 1161–1166 CrossRef CAS PubMed.
- F. Marchini, S. Herrera, W. Torres, A. Y. Tesio, F. J. Williams and E. J. Calvo, Langmuir, 2015, 31, 9236–9245 CrossRef CAS PubMed.
- M. Ue, H. Asahina, S. Matsuda and K. Uosaki, RSC Adv., 2020, 10, 42971–42982 RSC.
- K. Naitoh, Y. Inai, T. Hirabayashi and T. Tsuda, Anal. Chem., 2000, 72, 2797–2801 CrossRef CAS PubMed.
- Y. Gao, H. Noguchi and K. Uosaki, ACS Energy Lett. Search PubMed , submitted.
Footnote |
| † Electronic supplementary information (ESI) available. See DOI: https://doi.org/10.1039/d2ra07670e |
| This journal is © The Royal Society of Chemistry 2023 |

