DOI:
10.1039/D2RA07727B
(Paper)
RSC Adv., 2023,
13, 4138-4149
First-principles calculations to investigate physical properties of orthorhombic perovskite YBO3 (B = Ti & Fe) for high energy applications
Received
4th December 2022
, Accepted 23rd January 2023
First published on 31st January 2023
Abstract
Orthorhombic oxide perovskite compounds are very promising materials for the applications of optoelectronics and thermal barrier coating. This work represents a numerical simulation of YBO3 compounds through the first-principles ab initio approach. The electronic and magnetic properties are investigated employing the general gradient approximation (GGA) coupled to the integration of the Hubbard U-term which is the GGA + U. The Ti and Fe-based YBO3 perovskite compounds are found to be actively promising within the ferromagnetic configuration and their lattice parameters are consistent with the previous studies. The calculations of formation energy signify that the compounds YBO3 are stable thermodynamically. The electronic properties are computed and evaluated by the band structure and density of states for both compounds and the results depict that these materials are ferromagnetic half-metallic. Mechanically these compounds are stable, ductile, anisotropic, and hard to scratch. The thermal properties are evaluated for YBO3 (B = Ti and Fe) compounds up to a temperature range of 2000 K. This work can open new opportunities for further exploration in this field.
1. Introduction
Nowadays, the scientific community is searching for ductile, stiff, non-corrosive, and strong materials at higher temperatures and pressure regarding their use in modern technological applications. These industrial and technological applications include the medical, automobile, aerospace, defense, sensors, nuclear industry, portable electronic devices, electrical contacts, protective coatings, high-temperature structural applications, and thermal barrier coatings.1–4 Recently, ABO3 perovskite oxide compounds have achieved greater attention owing to an appropriate grouping of thermo-mechanical properties at high temperatures and pressure.5–7 However, the paucity of research examining the mechanical and thermal properties at high pressure of perovskite compounds hampers endeavors toward the recognition of improved high-energy applications. Understanding the property conveyance in the perovskite compounds family, as well as the creation of a suitable screening mechanism, are critical for accelerating the design and disclosure of perovskite-based high-energy applications.6–8
The properties and applications of the perovskite have been growing in interest in the scientific community over the past years.9–11 Consequently, some exceptional hydraulic stress perovskite, it has proven to be an alternative to chemical pressure. In this continuation, very recently, arnab majumdar et al. investegated four novel perovskites AZrS3 where A = Mg, Ca, Sr and Ba. Upon being compressed, the direct band gaps decrease to desired values which can render this class of zirconium based chalcogenide perovskites to be used in tandem solar cells. They found that when pressure is applied, the direct band gaps decrease to desired values which can render this class of zirconium based chalcogenide perovskites to be used in tandem solar cells.12 And the same search group has explored on the physical properties and defect processes of cubic and tetragonal BaSrN3 at 100 GPa using an ab initio structure search method, and informed that these results predicted to be the design of cleaner and environmentally friendly high energy density materials.13 The ternary oxides perovskites compounds possess a large family of atomically layered materials having the same crystalline structure and the general chemical formula of ABX3 (A is a rare earth or alkaline or alkaline earth materials, B is a transition metal, and X is mostly oxygen).14,15 Due to various widespread uses in numerous technologies, the quest for novel materials for specific purposes is getting popular. Machine learning approaches and ab-initio computations employing DFT allowed for the screening of enormous sets of materials. Several systems comprising oxides perovskites are being studied, and the results have been published in recent years using machine learning and DFT.16,17 Wakil Hasan et al.18 recently reported indium-based oxides perovskites TlBO3 (B = Cr, Mn) employing DFT within WIEN2K and have shown that lower values of thermal conductivity and high values of Debye temperature in the TlBO3 (B = Cr, Mn) compounds may be applied as a promising material for thermoelectric and unfriendly environments. Furthermore, the ground-state physical properties of Pb(Mg1/3Nb2/3)O3 compounds are predicted to be the most tolerant material for thermal barrier coating.19 Numerous studies reported the halides and oxides perovskites and MAX phase which possesses the physical, mechanical, and chemical properties because of the potential applications in various fields,4–7,20–22 and it is observed that our investigated results, show consistency with the available results in the literature. So, this class of materials perovskite oxides promising applications for enlightening properties for various technologically equipped societies.
2. Computational method
The investigated data presented in this work is obtained by employing all electrons FP-LAPW (full-potential linearized augmented plane wave) technique within the WIEN2K code.23–25 This method is grounded on DFT (density functional theory) in which PBE-GGA (Perdew–Burke–Ernzerhof generalized gradient approximations),26,27 is employed for magnetic and electronic properties. The GGA + U approximation is utilized here28–31 for the investigations of interesting physical properties. The Ueff = U − J (effective on-site Coulomb exchange correlations) is adopted, whereas “U” is the Coulomb U parameter and “J” represent an exchange parameter. Since Ueff is known for transition metal elements and its value is from 2 and 6 eV32,33 and in our work, the value of Ueff is selected to be 2 eV for transition metal atoms selected and reported.34–36 The parameter muffin-tin (MT) radii picked is 2.1, 1.92, and 1.74 Bohr for Y, B = (Ti and Fe) and “O” atoms respectively. The lmax = 10 is the maximum value for charge density inside the atomic spheres selected and the charge density Fourier expansion of the magnitude of the largest vector Gmax = 14 is chosen. For better convergence, the convergence has been reached to the energy and the charge are less than 0.00001 Ry and 0.0001 e/a.u.3, respectively. And an 11 × 11 × 4 Monkhorst–Pack k-point grid is used for integration over the Brillouin zone (BZ).
3. Results and discussion
In this part, the investigated results of the various physical properties of the orthorhombic oxides perovskite YBO3 (B = Ti & Fe) is presented and discussed in detail.
3.1. Structural properties
The structure of perovskite oxide YBO3 is orthorhombic having the space group of Pbnm (No. 62) as depicted in Fig. 1a. The YBO3 type structure consists of Y, B, O1 and O2 atoms that occur at positions 4c, 4b, 4c and 8d respectively. To investigate the equilibrium crystal structural parameters of the two selected compounds for different magnetic configurations, we have considered spin orientation for antiferromagnetic (AFM) as shown in Fig. 1b. The total energy vs. the volume of the two compounds for different magnetic configurations is computed and the results are fitted using Murnaghan's EOS (equation of states) and presented in Fig. 2.
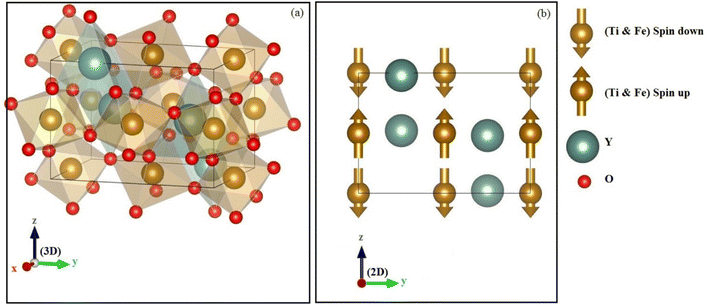 |
| | Fig. 1 The (a) crystal structure and (b) antiferromagnetic configuration within orthorhombic oxides perovskite YBO3 (B = Ti, Fe). | |
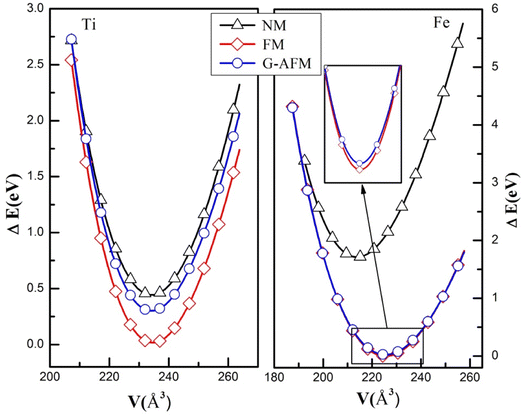 |
| | Fig. 2 The energy versus volume fit for NM, FM, and G-AFM scheme of YBO3 (B = Ti, Fe) compounds. | |
The FM (ferromagnetic) state has the lowest energy than other states for both compounds. Therefore, one can assert that YBO3 (B = Ti, Fe) compounds are stable in the FM phase. The calculated structural parameters and other theoretical results are listed in Table 1. It is noted here that our computed results settle well with existing experimental and theoretical data. These parameters are very important for calculating other properties like ductility, hardness, thermal and magnetic properties, etc.
Table 1 Computed lattice parameters (a, b, and c), volume (V), bulk modulus (B), and total energy of YBO3 (B = Ti, Fe) compounds
| Compounds |
Phase |
Cell parameters (Å) |
V (Å3) |
B (GPa) |
Total energy (Ry) |
| a |
b |
c |
| Ref. 37. Ref. 38. |
| YTiO3 |
NM |
5.7030 |
7.7050 |
5.3398 |
234.6668 |
194.0980 |
−35725.356614 |
| FM |
5.7107 |
7.6973 |
5.3376 |
234.6491 |
195.3640 |
−35725.38919 |
| G-AFM |
5.7070 |
7.6919 |
5.3342 |
234.1637 |
194.2559 |
−35725.367055 |
| YFeO3 |
NM |
5.5009 |
7.4103 |
5.2463 |
213.8634 |
205.6982 |
−39075.958642 |
| FM |
5.6356 |
7.5663 |
5.2888 |
225.5225 |
159.5047 |
−39076.084552 |
| G-AFM |
5.6348 |
7.5648 |
5.2877 |
225.3998 |
156.0757 |
−39076.084531 |
| |
5.5907a |
7.6082a |
5.2849a |
224.79a |
— |
— |
| |
5.5961b |
7.6098b |
5.2855b |
225.08b |
— |
— |
To examine the material ability and stability, we estimated the formation energy (Ef) of the YBO3 orthorhombic perovskite using the following expression.39–43
| | |
ΔHf(YBO3) = Etot(YBO3) − (aE(Y) + bE(B) + cE(O)); B = Ti, Fe
| (1) |
Here,
a,
b and
c represent the number of atoms of “Y”, (Ti/Fe), and O, respectively inside the unit cell, the formation energy is represented by Δ
Hf(YBO
3) for YBO
3 (B = Ti and Fe), the total energy per unit cell is depicted by
Etot(YBO
3) for the bulk YBO
3 compounds and
E(Y),
E(B) and
E(O) are the total energies of Y, Ti/Fe, and O, respectively within the crystalline structure. The negative formation energies are obtained for both compounds, indicating the stability against disintegration into their constituent elements. The present value of formation energy for YTiO
3 and YFeO
3 is −0.580 eV per atom, and −0.521 eV per atom, respectively.
3.2. Phonon dispersion
To confirm the thermodynamically stabilities of the compounds, we evaluate the dynamic stability by calculating the phonon band structure using the finite displacement method implemented in the WIEN2K package within the frequency range from 0 THz up to 30 THz, as depicted in Fig. 3. It can be seen from Fig. 3 that the phonon dispersion curves for both materials are positive and there are no negative values of dispersion curves (imaginary phonon frequencies). The positive dispersion curves confirm the phonon dynamical stability of both compounds.
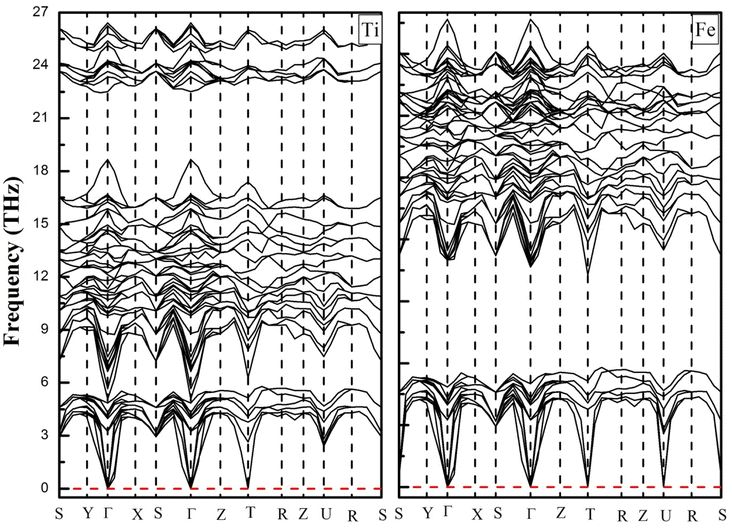 |
| | Fig. 3 Phonon dispersion curves of YTiO3 and YFeO3 compounds. | |
3.3. Electronic structure and magnetic moment
The electronic structure (ES) can support to elucidate us information to understand the behavior of electrons within materials, it is used in electrical industries, electronics, and microelectronics. The electronic structure investigated for the YBO3 compounds is considered in the stable phase by investigating the electronic band structure (EBS) and density of states (DOS) for the spins up and down within the framework of GGA + U using U = 2 eV in these investigations for transition metals-3d states. Fig. 4, depicts the spin-resolved EBS and TDOS of our compounds. The computation shows that both the two materials in the spin-up channel cross at the EF (Fermi level), whereas those in the spin-down channel have semiconductor characteristics, indicating that the compounds of interest exhibit a ferromagnetic half-metallic (FM-HM) nature. The TDOS findings demonstrated full agreement with EBS.
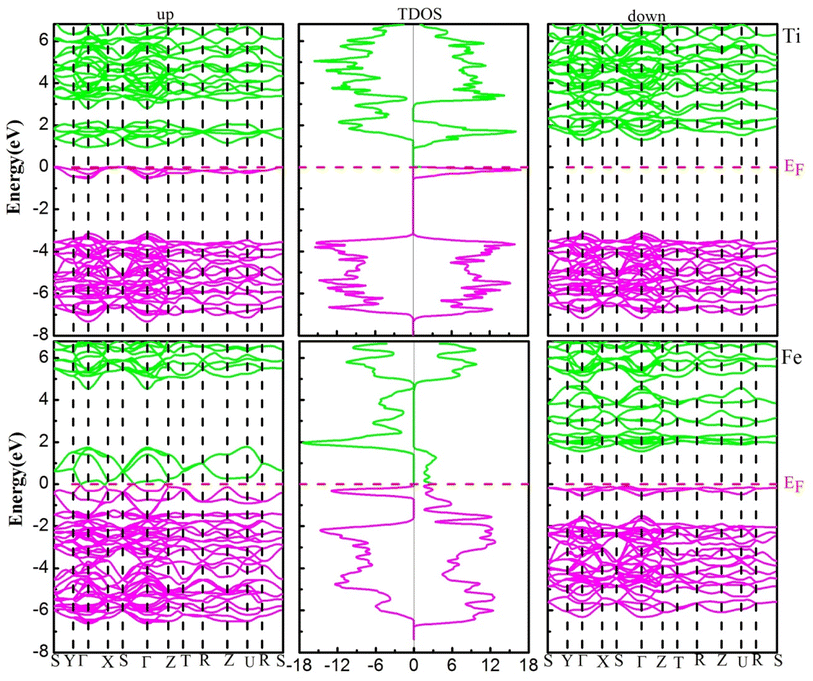 |
| | Fig. 4 The electronic band structure (left-up and right-down) and total density of states (middle) of YBO3 perovskites. The Fermi level (EF = 0.0 eV) is indicated by the horizontal dashed red line. | |
To further understand the nature of the EBS, we estimated the PDOS for both channels, which are shown in Fig. 5. TDOS along with PDOS are plotted within the −8 eV to 7 eV energy range, in which the contribution of the total density of the constituent element and the partial contribution from the state of the concerning element is shown and described. The elemental and states contribution to the valence band and conduction band are depicted, and it is very clear that the major contribution to the electronic states within the valence band is occur from the In-p state, (Fe, Ti)-d state, and O-p state. In discussing the conduction band from 0 eV to 7 eV energy level, we see that the dominant part possesses the (Fe, Ti)-d state with little contribution from the “Y” element.
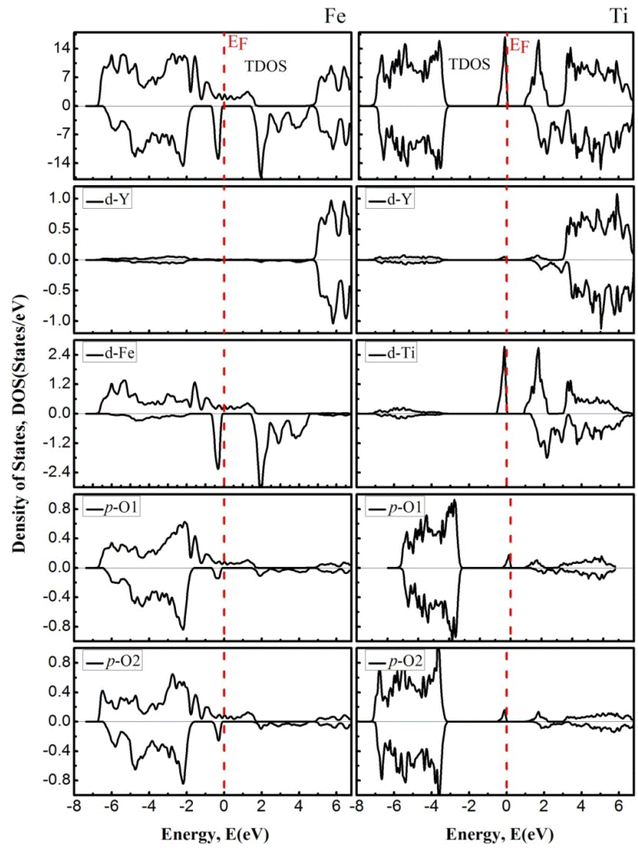 |
| | Fig. 5 The density of states of YFeO3 perovskites (left) and YTiO3 perovskites (right). The Fermi level (EF = 0.0 eV) is indicated by the vertical dashed red line. | |
In this paragraph, we highlight the magnetic properties, because these properties are related to numerous electronic applications such as radiation shielding, sensors, and induction heating. The total and atomic magnetic moments of YBO3 (B = Ti, Fe) compounds are calculated and summarized in Table 2. It is worth noting that the overall magnetic moments of YTiO3 and YFeO3 compounds are carried by Ti/Fe atoms which give 4 μB and 12 μB in total, respectively.
Table 2 The computed total and partial magnetic moments and the interstitial site in μB (Bohr magneton)
| Compound |
Total (μB) |
Y (μB) |
Fe/Ti (μB) |
O (μB) |
O (μB) |
Interstitial (μB) |
| YTiO3 |
4.00 |
0.01 |
0.73 |
0.00 |
0.00 |
0.92 |
| YFeO3 |
12.00 |
0.00 |
2.81 |
0.01 |
−0.01 |
0.69 |
3.4. Mechanical properties
It is essential to study the mechanical properties of materials for the possibilities of their application in a particular technical field, where they are closely related to its elastic constants, which can provide us with information including the bonding character, the ductility, hardness, or brittleness of the materials. There are nine independent elastic constants, namely C11, C22, C33, C44, C55, C66, C12, C13, and C23 characterize the elastic properties of an orthorhombic system, where C11, C22, and C33 are associated with linear resistance to compression along the axes a, b, and c respectively and the others C44, C55, C66, C12, C13, and C23 are related to the crystal shape. Pressure can affect the mechanical properties of a material such as hardness, stability, and even the phase structure of the material, and thus can limit its possibilities to use in industrial applications. In addition, for an orthodontic system to be mechanically stable, under pressure, it must meet the following criteria18,44| |
![[C with combining tilde]](https://www.rsc.org/images/entities/i_char_0043_0303.gif) ii > 0; i = (1–6) ii > 0; i = (1–6)
| (2) |
| |
![[C with combining tilde]](https://www.rsc.org/images/entities/i_char_0043_0303.gif) 11 + 11 + ![[C with combining tilde]](https://www.rsc.org/images/entities/i_char_0043_0303.gif) 22 + 22 + ![[C with combining tilde]](https://www.rsc.org/images/entities/i_char_0043_0303.gif) 33 + 2 33 + 2![[C with combining tilde]](https://www.rsc.org/images/entities/i_char_0043_0303.gif) 12 + 12 + ![[C with combining tilde]](https://www.rsc.org/images/entities/i_char_0043_0303.gif) 13 + 13 + ![[C with combining tilde]](https://www.rsc.org/images/entities/i_char_0043_0303.gif) 23 > 0 23 > 0
| (3) |
The elastic constants (Cij) of the two compounds have been calculated under P = 0, 5, 10, and 15 GPa constant pressure and displayed in Table 3 and represented in Fig. 6. It is clear that all the mechanical stability requirements are met, thus both compounds investigated are stable mechanically up to 15 GPa pressures. Moreover, it is worth noting that all the ECs (elastic constants) of both compounds increase in a nonlinear way, and also, the C11, C22 and C33 are always higher than the rest of the other ECs, which means that the resistance to deformation along of the axial directions is stronger than that in the non-axial directions of the two compounds, in the pressure range studied.
Table 3 The evaluated elastic constants (Cij in GPa)
| |
Pressure |
C11 |
C22 |
C33 |
C44 |
C55 |
C66 |
C12 |
C13 |
C23 |
| Ref. 38. |
| YTiO3 |
0 |
297 |
239 |
295 |
72 |
84 |
93 |
125 |
135 |
104 |
| 5 |
360 |
319 |
353 |
107 |
127 |
123 |
131 |
137 |
113 |
| 10 |
428 |
387 |
421 |
109 |
134 |
127 |
154 |
161 |
145 |
| 15 |
430 |
384 |
426 |
124 |
150 |
141 |
147 |
159 |
129 |
| YFeO3 |
0 |
174 |
280 |
315 |
88 |
33 |
49 |
106 |
95 |
85 |
| 0a |
243a |
169a |
232a |
113a |
75a |
78a |
113a |
99a |
117a |
| 5 |
274 |
240 |
305 |
92 |
89 |
104 |
142 |
100 |
101 |
| 10 |
323 |
285 |
349 |
97 |
109 |
118 |
145 |
129 |
110 |
| 15 |
352 |
358 |
394 |
117 |
126 |
143 |
136 |
126 |
129 |
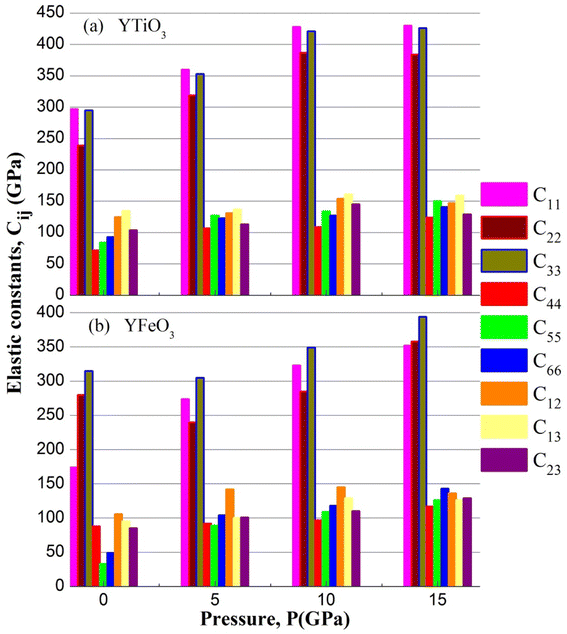 |
| | Fig. 6 The elastic constants of YBO3 versus pressure. | |
Using the Voigt–Reuss–Hill approximation, some mechanical properties including Young's modulus E, bulk modulus B, shear modulus G, Pugh's coefficient G/B, Poisson's ratio ν, and Cauchy pressure CP are calculated through the elastic constants. The details of these parameters are available in a recent paper.18
The values of B, G, E, G/B, and ν computed for orthorhombic compounds YTiO3 and YFeO3 under pressure up to 15 GPa are presented in Table 4. Each of B, G, and E increases almost linearly for two compounds at different pressure, except for the 15 GPa, at which the bulk modulus of YTiO3 loses little of its acquired value. Conversely, the Poisson's ratio “ν” decreases with increasing pressure. Moreover, for the entire range of pressure, the bulk modulus always exceeds the shear modulus, demonstrating the limiting factor for the mechanical stability of YTiO3 and YFeO3 compounds. Furthermore, the B and G values of the YTiO3 remain higher than those of the YFeO3, and thus the YTiO3 has a greater ability to resist deformation compared to the YFeO3. Poisson's ratio “ν” is a significant parameter that provides us with some key properties of crystalline solids which are often utilized to infer the types of bonding. If the value of “ν” is less than 0.25, the character of the chemical bonding is covalent whereas, its value greater than 0.25 usually shows the ionic bonding character. The values of the Poisson's ratio computed for both the oxides perovskite materials are higher than 0.25, which indicates the ionic bonding character in the range of 0 GPa to 15 GPa pressure. The ductile or brittle nature of materials can be classified by G/B (Pugh's ratio) as well as by “ν” (Poisson's ratio), which is of great importance in determining the integrity of structures and industrial applications. According to Pugh, the critical value for separating brittle from ductile materials is G/B = 0.57. Brittle materials have a Pugh ratio higher than the critical value while ductile materials have a lower value than 0.57. Conversely, when the “ν” (Poisson's ratio) is higher than 0.26, the material shows ductility, and if the opposite, it becomes brittle. The values of the Pugh ratio (G/B) and the Poisson's ratio “ν” at 0 GPa pressure confirm that the two compounds studied are ductile materials. And with increasing pressure up to 15 GPa, the Pugh ratio values increase to reach 0.58 and 0.59 for YTiO3 and YFeO3 respectively, and conversely the values of Poisson's ratio decrease up to a value of 0.25 for both compounds, which means that both compounds tend to lose ductility with increasing pressure.
Table 4 The elastic modulus (B, G, and E in GPa), Poisson's ratio (ν), Pugh ratio (G/B), and Vickers hardness (HV in GPa) computed for orthorhombic oxides perovskite YBO3 (B = Ti & Fe)
| Compounds |
Pressure |
B |
G |
E |
G/B |
μM |
ν |
Hv |
| YTiO3 |
0 |
172 |
80 |
209 |
0.46 |
2.38 |
0.29 |
7.60 |
| 5 |
199 |
114 |
288 |
0.57 |
1.85 |
0.28 |
10.64 |
| 10 |
239 |
125 |
320 |
0.53 |
2.19 |
0.27 |
12.78 |
| 15 |
234 |
136 |
342 |
0.58 |
1.88 |
0.25 |
15.76 |
| YFeO3 |
0 |
145 |
61 |
160 |
0.42 |
1.64 |
0.31 |
5.04 |
| 5 |
167 |
86 |
221 |
0.51 |
0.81 |
0.28 |
9.45 |
| 10 |
191 |
102 |
260 |
0.53 |
1.96 |
0.27 |
11.36 |
| 15 |
209 |
124 |
311 |
0.59 |
1.78 |
0.25 |
15.21 |
The “μM” is the machinability index that characterizes the cutting ability of a material, the maximum financial level of the plastic strain machine operation, and that is crucial for industrial zones19 and is investigated using the following expression.
| |
 | (7) |
For both compounds, the calculated values of μM are displayed in Table 5, denoting enhanced lubricating characters and lesser frictions, which indicates the suitability of this material for industrial applications.
Table 5 The evaluated A1, A2, and A3 (shear anisotropic) parameters for the three different shear planes
| Compounds |
Pressure |
A1 |
A2 |
A3 |
| YTiO3 |
0 |
0.89 |
1.03 |
1.30 |
| 5 |
0.97 |
1.13 |
1.17 |
| 10 |
0.82 |
1.03 |
1.00 |
| 15 |
0.92 |
1.08 |
1.08 |
| YFeO3 |
0 |
1.17 |
0.31 |
0.80 |
| 5 |
0.97 |
1.03 |
1.80 |
| 10 |
0.93 |
1.05 |
1.48 |
| 15 |
0.94 |
1.02 |
1.30 |
Hardness is a very important parameter in the world of mechanics which expresses the resistance of a material to corrosion. The most corrosion-resistant materials are the materials that have the highest hardness value. The Vickers hardness of a polycrystalline material can be calculated based on the bulk and shear moduli by following Chin's formula.21,32
| |
 | (8) |
The Vickers hardness results under increasing pressures up to 15 GPa are presented in Table 4, and it is worth noting that under the same pressure, YTiO3 has a higher Vicker hardness value than YFeO3, so it can be said that the YTiO3 compound is harder than YFeO3 compound, and the hardness of both compounds increases with increasing pressure within the pressure limits studied. The hardness of the studied compounds are similar to those of MAX phases, which are well-known damage-tolerant.19 For the orthorhombic system, there are three shear anisotropic factors A1, A2, and A3 (ref. 18 and 44) which are;
| |
 | (9) |
| |
 | (10) |
| |
 | (11) |
Whereas, the
A1 is along the {1 0 0} plane within the directions of [011] and [010]. The
A2 is along the {0 1 0} plane within the [101] and [001] directions and within the [110] and [010] directions the
A3 is along the {0 0 1} plane. As known, if the anisotropy factor
Ai is equal to 1, then it reveals that the compound is completely isotopic, otherwise, it measures the degree of variability in the elasticity of the crystal. The calculations of the values of the shear anisotropic factors for YTiO
3 and YFeO
3 were performed under pressures of 0 to 15 GPa, and the results are in
Table 5. All the values of the shear anisotropy factors deviate from “1”, confirming that the YTiO
3 and YFeO
3 compounds are anisotropic materials in different directions and that this anisotropy remains present under the applied pressures.
3.5. Thermal properties
In the context of scientific and technological research, the determination of the thermal properties of materials plays an important role. Debye temperature (θD) is a significant parameter in determining the thermodynamic property of solid crystalline materials, as it relates to many physical properties, including the melting point, elastic constants, lattice thermal conductivity, and specific heat. According to Anderson, the value of Debye temperature θD can be deduced from the sound velocities via the below equations.45,46| |
 | (12) |
| |
 | (13) |
| |
 | (14) |
| |
 | (15) |
where h is Plank's constant, n is the number of atoms in the unit cell, NA represents Avogadro's number, ρ is the density, kB depicts the Boltzmann's constant, M shows the molecular weight, vl, vm, and vt is the longitudinal, average sound velocity, and transverse sound velocity respectively. Using the previously calculated results for the elastic constants, we have calculated the vt, vl, vm and θD for each YTiO3 and YFeO3 compound under pressure up to 15 GPa, and the outcomes are listed in Table 6, and the evolutions of (θD) change with pressure are represented in the Fig. 7c. It is obvious that all sound velocities vt, vl, vm, and Debye temperature are larger in YTiO3 than in YFeO3 at the same pressure, and all these values increase linearly with the increase in pressure. The high Debye temperature of both tested compounds makes them good candidates used in harsh environments.47 Moreover, the Tm (melting temperature) is employed to know the purity of organic and inorganic materials. It also allows us to know the applicability of the material at high temperatures since solids can be used at temperatures below “Tm” unless oxidized by chemical change or excessive distortion causing mechanical/elastic failure. For both YTiO3 and YFeO3 compounds the Tm (melting temperature) is calculated using the following expression.18,19,21,22,48| |
 | (16) |
Table 6 Investigated density (ρ in g cm−3), longitudinal, transverse, and average elastic wave velocities (vt, vl, vm in m s−1), Debye temperature (θD in K), Melting temperature (Tm in K), minimum thermal conductivity and lattice thermal conductivities (kmin, kph in W m−1 K−1)
| Compounds |
Pressure |
ρ (g cm−3) |
vl |
vt |
vm |
θD |
Tm |
kmin |
kph |
| Ref. 38. |
| YTiO3 |
0 |
5.23 |
7312 |
3928 |
4386 |
574 |
1687 |
0.40 |
53.44 |
| 5 |
5.35 |
8108 |
4629 |
5144 |
679 |
1963 |
0.47 |
72.83 |
| 10 |
5.47 |
8623 |
4789 |
5334 |
709 |
2269 |
0.50 |
116.02 |
| 15 |
5.58 |
8645 |
4945 |
5494 |
735 |
2283 |
0.52 |
148.27 |
| YFeO3 |
0 |
5.67 |
6324 |
3278 |
3669 |
487 |
1348 |
0.34 |
29.00 |
| 0a |
… |
… |
… |
3381a |
449a |
… |
… |
… |
| 5 |
5.84 |
6958 |
3850 |
4290 |
575 |
1633 |
0.41 |
62.18 |
| 10 |
6.00 |
7390 |
4126 |
4594 |
621 |
1846 |
0.44 |
81.72 |
| 15 |
6.15 |
7813 |
4495 |
4992 |
680 |
2001 |
0.49 |
123.65 |
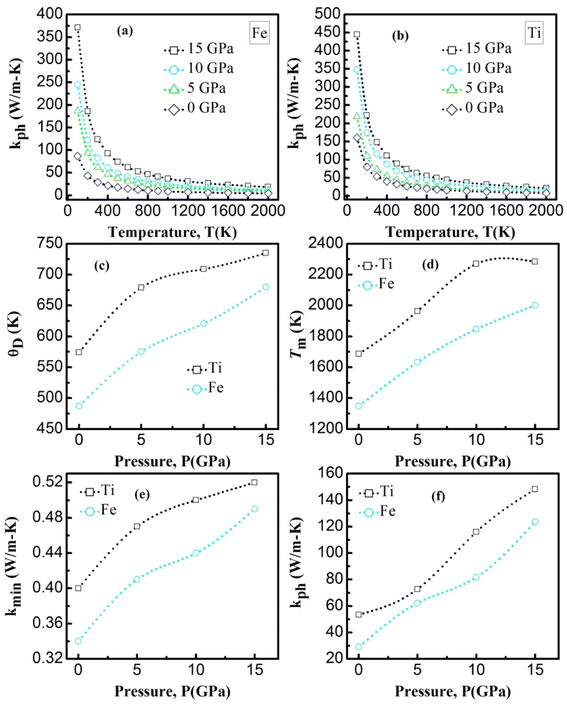 |
| | Fig. 7 The (a) and (b) is the temperature dependence of the lattice thermal conductivity of YBO3. The (c) and (d) is the Debye temperature and melting temperature for YBO3 as a function of different pressure. The (e) and (f) is the minimum and lattice thermal conductivity for YBO3 as a function of different pressure. | |
The calculated melting point values at certain fixed pressures for the investigated compounds are presented in Table 5 and shown in Fig. 7d. It is worth noting that all the compounds have a high Tm with an advantage always in favor of YTiO3 at the same pressure. Tm increases almost linearly for both compounds. Upon reaching 10 GPa, the intensity of the increase for YTiO3 decreases. The general trend is that a higher melting temperature is associated with the higher elastic constants that indicate the strength of underlying bonding between atoms in a solid. These results confirm that these compounds are suitable in the thermally strict zone.
The lattice thermal conductivity is an essential property of solids. Here we have investigated the variation of the lattice thermal conductivity Kph of our compounds with temperature using the Slack model:49
| |
 | (17) |
where
Mav represents the average atomic mass of a crystal in kg mol
−1,
δ defines the cubic root of average atomic volume in m, and
γ mentions the Grüneisen constant and it can be calculated by the following formula;
| |
 | (18) |
where factor
A is calculated as:
| |
 | (19) |
Fig. 7a, b represents the variation of Kph with temperature under a certain pressure of the YTiO3 and YFeO3. It is noted that the Kph of YTiO3 is mostly greater than that of YFeO3 at the same pressure and temperature. The Kph values gradually decrease with increasing temperature at certain constant pressures. Otherwise, at a constant temperature, the values of Kph increase with increasing pressure almost linearly of the two compounds studied. Additionally, another important parameter is the minimum thermal conductivity κmin which is defined as the theoretical minimum thermal conductivity at elevated temperatures with Debye temperatures and was estimated using the Clarke model given by the following expression.50,51
| |
 | (20) |
Fig. 7e plotted the variation of κmin with the pressure of the YTiO3 and YFeO3. From Fig. 7e, it is observed that κmin rises with the increase in pressure of both compounds, and like all time YTiO3 has higher values than YFeO3 at the same pressure. It is recognized that an optimum limit of κmin <1.25 W mK−1 is suitable for TBC materials.52 Therefore, we can say that both compounds demonstrates can be an optimum material for TBC applications.
4. Conclusion
In this work, the WIEN2K simulation code is utilized for investigating several physical properties comprising the structural, mechanical, thermal, magnetic, and electronic properties of orthorhombic oxides perovskite YBO3 (B = Ti & Fe) through the FP-LAPW incorporated within the WIEN2K. The YBO3 is recognized to be a potential half-metallic ferromagnetic material. The computed formation energy signifies the thermodynamic and structural stability of the investigated compounds. The ductility and mechanical stability of both materials are confirmed from the investigations of elastic properties and these compounds possess ionic bonding character dominantly. The values for thermal parameters (high melting temperature and low minimum thermal conductivity) for these compounds were estimated as a promising material for TBC and hostile environments applications. These results demonstrate the possibility of using YBO3 materials in modern technology and mechanical applications.
Conflicts of interest
There are no conflict to declare.
Acknowledgements
The authors extend their appreciation to the Deanship of Scientific Research at King Khalid University for funding this work support through the research groups program under grant number (RGP.2/145/43). The authors are also thankful to the Taif University Researchers Supporting Project number (TURSP-2020/03), Taif University, Taif, Saudi Arabia.
References
- A. Azzouz-Rached, M. A. Hadi, H. Rached, T. Hadji, D. Rached and A. Bouhemadou, J. Alloys Compd., 2021, 885, 160998, DOI:10.1016/j.jallcom.2021.160998.
- M. Mehl, J. Osburn, D. Papaconstantopoulos and B. Klein, Phys. Rev. B, 1990, 41, 10311, DOI:10.1103/PhysRevB.41.10311.
- N. P. Padture, Nat. Mater., 2016, 15, 804–809, DOI:10.1038/nmat4687.
- W. Pan, S. R. Phillpot, C. L. Wan and et al, ., MRS Bull., 2012, 37, 917–922, DOI:10.1557/mrs.2012.234.
- J. Y. Yuan, J. B. Sun, J. S. Wang and et al, ., J. Alloys Compd., 2018, 740, 519–528, DOI:10.1016/j.jallcom.2018.01.021.
- Y. C. Liu, V. R. Cooper, B. H. Wang and et al, ., Mater. Res. Lett., 2019, 7, 145–151, DOI:10.1080/21663831.2019.1566183.
- Y. Liu, K. Chu, Y. Zhou, Y. Li, W. Li and B. Liu, J. Adv. Ceram., 2022, 11, 1596–1603, DOI:10.1007/s40145-022-0632-0.
- X. J. Wang, Y. Huan, Y. X. Zhu and et al, ., J. Adv. Ceram., 2022, 11, 184–195, DOI:10.1007/s40145-021-0526-6.
- A. A. Adeleke, S. A. Bonev, C. J. Wu, E. E. Jossou, and E. R. Johnson. arXiv preprint arXiv, 2022, 2209-05652. DOI:10.48550/arXiv.2209.05652.
- A. A. Adeleke, A. O. Adeniyi, H. Tang, H. Gou and Y. Yao, J. Phys.: Condens. Matter, 2020, 32, 395401, DOI:10.1088/1361-648X/ab96f1.
- A. A. Adeleke and Y. Yao, Phys. Chem. Chem. Phys., 2019, 21, 7508–7517, 10.1039/C8CP07288D.
- A. Majumdar, A. A. Adeleke, S. Chakraborty and R. Ahuja, J. Mater. Chem. C, 2020, 8, 16392–16403, 10.1039/D0TC04516K.
- A. A. Adeleke, E. E. Jossou, N. U. Ukoji, A. O. Adeniyi and P. O. Egbele, ACS Omega, 2020, 5, 26786–26794, DOI:10.1021/acsomega.0c03880.
- Y. Wang, Z. Lv, L. Zhou, X. Chen, J. Chen, Y. Zhou and S. T. Han, J. Mater. Chem. C, 2018, 6, 1600–1617, 10.1039/C7TC05326F.
- M. Johnsson and P. Lemmens, J. Phys.: Condens. Matter, 2008, 20, 264001, DOI:10.1088/0953-8984/20/26/264001.
- G. Pilania, P. V. Balachandran, C. Kim and T. Lookman, Front. Mater., 2016, 3, 19, DOI:10.3389/fmats.2016.00019.
- I. Petousis, Density functional theory and machine learning methods for dielectric materials discovery, Doctoral dissertation, Stanford University, 2016.
- W. Hasan, A. M. Hossain, M. Rasheduzzaman, M. A. Rahman, M. M. Hossain, K. R. Mohammad and M. Z. Hasan, RSC Adv., 2022, 12, 27492–27507, 10.1039/D2RA04273H.
- M. A. Hadi, M. N. Islam and M. H. Babu, Z. Naturforsch., A: Phys. Sci., 2019, 74, 71–81, DOI:10.1515/zna-2018-0334.
- A. Azzouz-Rached, M. W. Qureshi, I. Ouadha, H. Rached, T. Hadji and H. Rekab-Djabri, Comput. Condens. Matter, 2022, 33, e00748, DOI:10.1016/j.cocom.2022.e00748.
- A. Azzouz-Rached, Md. M. H. Babu, H. Rached, T. Hadji and D. Rached, Mater. Today Commun., 2021, 27, 102233, DOI:10.1016/j.mtcomm.2021.102233.
- A. Azzouz-Rached, H. Rached, M. H. Babu, T. Hadji and D. Rached, Int. J. Quantum Chem., 2021, 121, e26770, DOI:10.1002/qua.26770.
- P. Hohenberg and W. Kohn, Phys. Rev., 1964, 136, B864, DOI:10.1103/PhysRev.136.B864.
- P. Blaha, K. Schwarz, F. Tran, R. Laskowski, G. K. H. Madsen and L. D. Marks, J. Chem. Phys., 2020, 152, 074101, DOI:10.1063/1.5143061.
- T. Hadji, H. Khalfoun, H. Rached, Y. Guermit, A. Azzouz-Rached and D. Rached, Eur. Phys. J. B, 2020, 93, 214, DOI:10.1140/epjb/e2020-10204-5.
- J. P. Perdew, K. Burke and M. Ernzerhof, Phys. Rev. Lett., 1996, 77, 3865 CrossRef CAS PubMed.
- J. P. Perdew, K. Burke and M. Ernzerhof, Phys. Rev. Lett., 1997, 78, 1396 CrossRef CAS.
- V. I. Anisimov and O. Gunnarsson, Phys. Rev. B, 1991, 43, 7570, DOI:10.1103/PhysRevB.43.7570.
- V. I. Anisimov, J. Zaanen and O. K. Andersen, Phys. Rev. B, 1991, 44, 943, DOI:10.1103/PhysRevB.44.943.
- V. I. Anisimov, I. V. Solovyev, M. A. Korotin, M. T. Czyżyk and G. A. Sawatzky, Phys. Rev. B, 1993, 48, 16929, DOI:10.1103/PhysRevB.48.16929.
- I. Khan, I. Ahmad, I. U. Haq, A. Ali, Z. Ali and I. Ahmad, J. Electron. Mater., 2020, 49, 3357–3366, DOI:10.1007/s11664-020-08048-3.
- H. Rached, S. Bendaoudia and D. Rached, Mater. Chem. Phys., 2017, 193, 453–469, DOI:10.1016/j.matchemphys.2017.03.006.
- A. Ali, I. Khan, Z. Ali, F. Khan and I. Ahmad, Int. J. Mod. Phys. B, 2019, 33, 1950231, DOI:10.1142/S021797921950231X.
- H. C. Kandpal, G. H. Fecher, C. Felser and G. Schönhense, Phys. Rev. B, 2006, 73, 094422, DOI:10.1103/PhysRevB.73.094422.
- B. Balke, G. H. Fecher, H. C. Kandpal, C. Felser, K. Kobayashi, E. Ikenaga and S. Ueda, Phys. Rev. B, 2006, 74, 104405, DOI:10.1103/PhysRevB.74.104405.
- I. Khan, I. Ahmad, I. U. Haq, A. Ali, Z. Ali and I. Ahmad, J. Electron. Mater., 2020, 49, 3357–3366, DOI:10.1007/s11664-020-08048-3.
- L. Suthar, V. K. Jha, F. Bhadala, M. Roy, S. Sahu and S. K. Barbar, Appl. Phys. A, 2017, 123, 1–9, DOI:10.1007/s00339-017-1272-z.
- M. Romero, R. Escamilla, V. Marquina and R. Gómez, Eur. Phys. J. D, 2015, 69, 1–6, DOI:10.1140/epjd/e2015-60186-4.
- I. Ouadha, H. Rached, A. Azzouz-Rached, A. Reggad and D. Rached, Comput. Condens. Matter, 2020, 23, e00468, DOI:10.1016/j.cocom.2020.e00468.
- A. Azzouz-Rached, H. Rached, I. Ouadha, D. Rached and A. Reggad, Mater. Chem. Phys., 2021, 260, 124189, DOI:10.1016/j.matchemphys.2020.124189.
- T. Hadji, H. Khalfoun, H. Rached and A. Azzouz-Rached, Mater. Res. Bull., 2021, 143, 111461, DOI:10.1016/j.materresbull.2021.111461.
- T. Hadji, H. Khalfoun, H. Rached and A. Azzouz-Rached, Comput. Condens. Matter, 2021, 27, e00557, DOI:10.1016/j.cocom.2021.e00557.
- K. Bendriss, H. Rached, I. Ouadha and et al, ., Indian J. Phys., 2022, 1–11, DOI:10.1007/s12648-022-02482-1.
- D. Segall, P. J. D. Lindan, M. J. Probert, C. J. Pickard, P. J. Hasnip, S. J. Clark and M. C. Payne, J. Phys.: Condens. Matter, 2002, 14, 2717–2744, DOI:10.1088/0953-8984/14/11/301.
- T. Rackl, L. Eisenburger, R. Niklaus and D. Johrendt, Phys. Rev. Mater., 2019, 3, 054001, DOI:10.1103/PhysRevMaterials.3.054001.
- O. L. Anderson, J. Phys. Chem. Solids, 1963, 24, 909–917, DOI:10.1016/0022-3697(63)90067-2.
- D. R. Clarke and S. R. Phillpot, Mater. Today, 2005, 8, 22–29, DOI:10.1016/S1369-7021(05)70934-2.
- M. E. Fine, L. D. Brown and H. L. Mercus, Scr. Metall., 1984, 18, 951–956, DOI:10.1016/0036-9748(84)90267-9.
- D. T. Morelli and G. A. Slack, High Thermal Conductivity Materials, ed. S. L. Shindé and J. S. Goela, Springer, New York, 2006. DOI:10.1007/b106785.
- D. R. Clarke, Surf. Coat. Technol., 2003, 163–164, 67–74, DOI:10.1016/S0257-8972(02)00593-5.
- Y. Liu, V. R. Cooper, B. Wang, H. Xiang, L. Qian, Y. Gao, J. Yang, Y. Zhou and B. Liu, Mater. Res. Lett., 2019, 7, 145–151, DOI:10.1080/21663831.2019.1566183.
- Y. Liu, V. R. Cooper, B. Wang, H. Xiang, L. Qian, Y. Gao, J. Yang, Y. Zhou and B. Liu, Mater. Res. Lett., 2019, 7, 145–151, DOI:10.1080/21663831.2019.1566183.
|
| This journal is © The Royal Society of Chemistry 2023 |
Click here to see how this site uses Cookies. View our privacy policy here.  Open Access Article
 *a,
Ismail Ouadhaa,
Mudasser Husainb,
Habib Rached
 ac,
Hamza Rekab-Djabride,
Ali Bentouaf
 fg,
Tariq Hadjic,
Nourreddine Sfinahi,
Hind Albawalij,
Vineet Tirth
 kl,
Mohammed A. Aminm and
Nasir Rahman
 *b
*b


![[C with combining tilde]](https://www.rsc.org/images/entities/i_char_0043_0303.gif) ii > 0; i = (1–6)
ii > 0; i = (1–6)
![[C with combining tilde]](https://www.rsc.org/images/entities/i_char_0043_0303.gif) 11 +
11 + ![[C with combining tilde]](https://www.rsc.org/images/entities/i_char_0043_0303.gif) 22 +
22 + ![[C with combining tilde]](https://www.rsc.org/images/entities/i_char_0043_0303.gif) 33 + 2
33 + 2![[C with combining tilde]](https://www.rsc.org/images/entities/i_char_0043_0303.gif) 12 +
12 + ![[C with combining tilde]](https://www.rsc.org/images/entities/i_char_0043_0303.gif) 13 +
13 + ![[C with combining tilde]](https://www.rsc.org/images/entities/i_char_0043_0303.gif) 23 > 0
23 > 0
![[C with combining tilde]](https://www.rsc.org/images/entities/i_char_0043_0303.gif) 11 +
11 + ![[C with combining tilde]](https://www.rsc.org/images/entities/i_char_0043_0303.gif) 22 − 2
22 − 2![[C with combining tilde]](https://www.rsc.org/images/entities/i_char_0043_0303.gif) 12 > 0
12 > 0
![[C with combining tilde]](https://www.rsc.org/images/entities/i_char_0043_0303.gif) 11 +
11 + ![[C with combining tilde]](https://www.rsc.org/images/entities/i_char_0043_0303.gif) 33 − 2
33 − 2![[C with combining tilde]](https://www.rsc.org/images/entities/i_char_0043_0303.gif) 13 > 0
13 > 0
![[C with combining tilde]](https://www.rsc.org/images/entities/i_char_0043_0303.gif) 22 +
22 + ![[C with combining tilde]](https://www.rsc.org/images/entities/i_char_0043_0303.gif) 33 − 2
33 − 2![[C with combining tilde]](https://www.rsc.org/images/entities/i_char_0043_0303.gif) 23 > 0
23 > 0


