 Open Access Article
Temperature switch of electrochemical Seebeck coefficient of Fe2+/Fe3+ via formation of [FeCl4]2−/[FeCl4]−†
Yunika Nomuraa,
Dai Inouea and
Yutaka Moritomo *abc
*abc
aGraduate School of Pure & Applied Science, University of Tsukuba, Tennodai 1-1-1, Tsukuba, Ibaraki 305-8571, Japan. E-mail: moritomo.yutaka.gf@u.tsukba.ac.jp
bFaculty of Pure & Applied Science, University of Tsukuba, Tennodai 1-1-1, Tsukuba, Ibaraki 305-8571, Japan
cTsukuba Research Center for Energy Materials Science (TREMS), University of Tsukuba, Tsukuba, Ibaraki 305-8571, Japan
First published on 27th January 2023
Abstract
The electrochemical Seebeck coefficient (α = dV/dT; V and T are the redox potential and temperature, respectively) is important parameter for thermoelectric conversion. Here, we found that α of Fe2+/Fe3+ in dimethyl sulfoxide (DMSO) with small amount of 19 M LiCl aqueous solution exhibits a crossover behavior from 1.4 mV K−1 (20 °C ≤ T ≤ 40 °C) to ≈0 mV K−1 (50 °C ≤ T ≤ 80 °C). The molar absorption (ε) spectra revealed that the crossover is ascribed to the transformation of the dominant Fe3+ complex from [FeL6]3+ (L is solvent molecule) to [FeCl4]−.
1 Introduction
Electrochemical Seebeck coefficient (α = dV/dT, V and T are the redox potential and temperature, respectively) is significant parameter for energy harvesting device, such as liquid thermoelectric conversion cell (LTE).1–7 In this sense, the deep understanding of α in solute–solvent system is scientifically and technologically important. α(V) is equivalent to , where ΔS (ΔG) and e are the variation in the entropy (Gibbs free energy) and elementary charge (≥0), respectively. Then, the complex state of redox pair significantly influences α as well as V. For example, the V value of Fe2+/Fe3+ in methanol (MeOH) significantly decreases by 200 mV when the Fe complex state changes from [FeL6]2+/[FeL6]3+ (L is solvent molecule) to [FeCl4]2−/[FeCl4]−.8 In addition, the α value of Fe2+/Fe3+ significantly depends on the solvent and ranges from 0.14 mV K−1 in glycerine to 3.60 mV K−1 in acetone.9 Addition of water alters the α value of [Fe(CN)6]4−/[Fe(CN)6]3− in organic solvent.10 In a technological point of view, temperature switch of the electrochemically-active redox pair is important because it not only can control of the α value but also change the V value discontinuously. The discontinuous change in V causes a substantially large α to realize a high performance LTE.
The Fe ion in solution is usually octahedrally coordinated by six Ls forming [FeL6]2+ and/or [FeL6]3+. Inada et al.11 reported that Fe2+ is coordinated by six Ls in aqueous, MeOH, ethanol (EtOH), dimethyl sulfoxide (DMSO) solutions. Inoue et al.12 reported that Fe3+ is also coordinated by six Ls in many organic solutions in which Fe(ClO4)3 is dissolved. Importantly, Fe3+ in many organic solutions forms [FeCl4]− if the solution contains Cl−.13 Nomura et al.8 reported that the complex state of Fe3+ in MeOH can be controlled by addition of Cl−; [FeCl4]− is formed above [Cl−] = 60 mM. Our idea to control the complex state is to bring the two complexes, e.g., [FeL6]3+ and [FeCl4]−, into competition and to unbalance them with heating and/or cooling.
In this work, we found that the α value of Fe2+/Fe3+ in DMSO with small amount of 19 M LiCl aqueous solution exhibits a crossover behavior from 1.4 mV K−1 (20 °C ≤ T ≤ 40 °C) to ≈0 mV K−1 (50 °C ≤ T ≤ 80 °C). The molar absorption (ε) spectra suggest that the crossover behavior of α can be ascribed to the temperature switch of the electrochemically-active redox pair from [FeL6]2+/[FeL6]3+ to [FeCl4]2−/[FeCl4]−. We further investigate the distribution of the redox potential against temperature and observed variation of the distribution.
2 Experimental methods
2.1 Solution
The solvent (DMSO) and solutes (dehydrated FeCl2, dehydrated FeCl3 and LiCl) were purchased from FUJIFILM Wako corp. and used as received. The solutions contain 0.5(1 − nFe3+) mM FeCl2 and 0.5nFe3+ mM FeCl3, where is the molar ratio of Fe3+. The sum of [Fe2+] and [Fe3+] was fixed at 0.5 mM. The [Cl−] value was controlled by adding small amount (0.1–0.4 vol%) of 19 M LiCl aqueous solution. We investigated DMSO solution containing 300 mM LiCl at nFe3+ = 0.5 as a prototypical solution of [FeCl4]2−/[FeCl4]−. We further investigate Cl−-free DMSO solution containing 0.25 mM Fe(ClO4)2·6.0H2O (FUJIFILM Wako corp.) and 0.25 mM Fe(ClO4)3·7.1H2O (FUJIFILM Wako corp.) as a prototypical solution of [FeL6]2+/[FeL6]3+.
2.2 UV-vis spectra
The ultraviolet-visible (UV-vis) absorption spectroscopy is a sensitive probe for the complex state, because Fe3+ complex exhibits characteristic absorption bands.8,12–15 The absorption spectra were investigated with a spectrometer (V750, Jasco) equipped with a temperature control unit. The molar absorption coefficient (ε) was defined by −ln(I/I0)/cd, where c, d (= 1 cm), I, and I0 are [Fe3+], the thickness of the optical cell, transmission intensity of the solution, and that without cell.2.3 Electrochemical properties
The thermal potential (VT) at temperature difference (ΔT = TH − TL; TH and TL are the temperatures of hot and cold electrodes, respectively) was evaluated with use of a specially-designed thermocell.16 The electrolyte was filled in a 0.73 mm ϕ polytetrafluoroethylene (PTFE) cylinder. Both ends were sealed with Pt disks with an area of 0.42 cm2. The two Pt electrodes were placed at a distance of 1.0 cm. TH and TL are monitored with T-type thermocouples and are independently controlled with Peltier modules. TL was fixed at 22 °C TH was manually controlled by stepwise variation of the input current to the Peltier device at intervals of ∼5 minutes.To investigate the distribution of the redox potential, the redox potentials of Fe2+/Fe3+ in DMSO solution containing 0.3 vol% 19 M LiCl aqueous solution were investigated against nFe3+. The solutions contain 0.5(1 − nFe3+) mM FeCl2 and 0.5nFe3+ mM FeCl3. We prepared the sample cell at nFe3+ and reference cell at nFe3+ = 0.1. A Pt collecting electrode was inserted in each cell. The temperatures of the cells were the same in a constant temperature water bath. The two cells were connected with a salt bridge, which was prepared as follows. NaClO4 (10 g per 100 mL) and agar (4 g per 100 mL) were added to water. Then, the solution was heated, dissolved, poured into a U-shaped tube, and cooled to harden. The relative potential between the sample and reference cells were measured every five minutes. The mean values and standard deviations were evaluated from nine data (Table S1†).
3 Results and discussion
3.1 Properties of the two Fe complex states
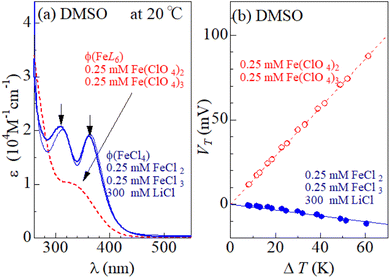
Fig. 1(a) shows molar absorption coefficient (ε) spectra of DMSO solution containing 0.25 mM FeCl2, 0.25 mM FeCl3, and 300 mM LiCl (solid curve) and that containing 0.25 mM Fe(ClO4)26.0H2O and 0.25 mM Fe(ClO4)37.1H2O (broken curve) at 20 °C. In the latter solution, [FeL6]2+/[FeL6]3+ is stable because there is no Cl− in the solution. The ε spectra (broken curve) of the latter solution shows broad absorption at 340 nm due to electron transfer L and Fe3+. The ε spectra (solid curve) of the former solution that contains 300 mM Cl− shows rather sharp absorption bands at 310 nm and 360 nm, which are ascribed to electronic transitions within [FeCl4]−.8,14 The intensities of the 310 nm and 360 nm bands are almost independent of T, as exemplified by the 80 °C spectrum (thin solid curve). Thus, [FeL6]3+ and [FeCl4]− dominates the latter and former solutions, respectively. Hereafter, we refer the respective ε spectra as ϕ(FeL6) and ϕ(FeCl4). Fig. 1(b) shows the thermal voltage (VT) against ΔT in each solution. In both the solutions, VT changes in proportion to ΔT. In the solution of [FeL6]2+/[FeL6]3+ (open circles), α (= 1.4 mV K−1) is positive and large. In the solution of [FeCl4]2−/[FeCl4]− (closed circles), α (= −0.2 mV K−1) is negative and small.3.2 Temperature control of Fe complex state
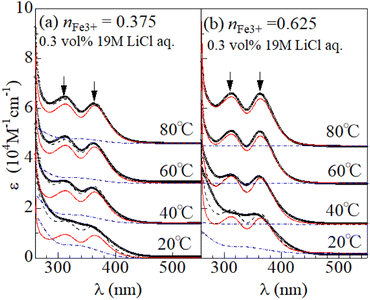
Fig. 2(a) shows temperature variation of the ε spectra (open circles) of DMSO solution containing 0.3 vol% 19 M LiCl aqueous solution ([Cl−] = 57 mM) at nFe3+ = 0.375. The spectrum at 20 °C shows broad absorption around 360 nm. The spectrum at 40 °C shows two sharp absorption bands at 310 nm and 360 nm (downward arrow), which can be ascribed to optical transitions within [FeCl4]−.8,14 The intensities of the 310 and 360 nm bands increases with further increase in T. A similar temperature variation is observed in the ε spectra at nFe3+ = 0.675 [Fig. 2(b)].To evaluate the [FeCl4]− ratio  , we decomposed the spectra into ϕ(FeL6) and ϕ(FeCl4) as (1 − nFeCl4)ϕ(FeL6) + nFeCl4ϕ(FeCl4). Red, dashed blue, and broken black curves in Fig. 2 are (1 − nFeCl4)ϕ(FeL6), nFeCl4ϕ(FeCl4), and (1 − nFeCl4)ϕ(FeL6) + nFeCl4ϕ(FeCl4), respectively. Fig. 3 shows the nFeCl4 values against T. We tried to reproduce the nFeCl4–T plot based on the equilibrium equation, [FeL6]3+ + 4Cl− ↔ [FeCl4]− + 6L. The equilibrium constant K is represented as
  , where ΔG, R, and ai is, the standard reaction Gibbs energy, the gas constant, and activity of i, respectively. aFeCl4, aL, aFeL6, and aCl are 0.0005nFe3+nFeCl4, 1, 0.0005nFe3+(1 − nFeCl4), and 0.057, respectively. The calculation fails to reproduce the experimental data, because
  for any positive ΔG (Fig. S1†). We suspect that the significant T dependence of nFeCl4 is ascribed to change in the solution state possibly due to (1) 0.3 vol% water and/or (2) high melting point (= 19 °C) of DMSO.
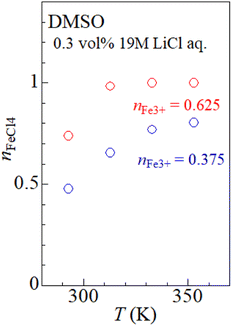 | ||
| Fig. 3 [FeCl4]− ratio (nFeCl4) against temperature (T) at nFe3+ = 0.375 and 0.625. The nFeCl4 values are evaluated by decomposition of the ε spectra (see text). | ||
3.3 Distribution of redox potential
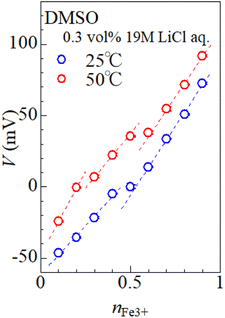
Fig. 4 shows relative potential (V) against nFe3+ in DMSO solution containing 0.3 vol% 19 M LiCl aqueous solution. The potential at nFe3+ = 0.5 and at 25 °C was set to be 0.0 mV. At nFe3+ = 0.5, the V value at 50 °C is 21.9 mV higher than the value at 25 °C. At 25 °C, V increases with nFe3+ below nFe3+ = 0.4, as indicated by broken line. The slope of the nFe3+–V plot is significantly suppressed at 0.4–0.5. With further increase in nFe3+ beyond 0.6, V again linearly increases with nFe3+. At 50 °C, V linearly increases with nFe3+ below nFe3+ = 0.2. The slope of the nFe3+–V plot is significantly suppressed at 0.2–0.3 and 0.5–0.6. With further increase in nFe3+ beyond 0.7, V again linearly increases with nFe3+. The overall increase in V with nFe3+ is reasonably ascribed to the second term of the Nernst's equation.
The origin of the flat regions in the nFe3+–V plot is considered as follows. When the redox potential of Fe2+/Fe3+ has a distribution, the Fe ions with lower potential are selectively oxidized. In this sense, the nFe3+–V plot contains information on the potential distribution. The flat region in the plot has a narrow potential distribution due to a well-defined redox process. At 25 °C, we observed a flat region at ≈0 mV. At 50 °C, we observed flat regions at ≈0 mV and 40 mV. We ascribed these regions to respective Fe complexes, i.e., [FeL6]2+/[FeL6]3+ and [FeCl4]2−/[FeCl4]−, because such complexes show well-defined redox processes. Recall that [FeCl4]2−/[FeCl4]− becomes dominant at high T (Fig. 2). Then, it is reasonable to ascribe the flat regions at 0 and 40 mV to [FeL6]2+/[FeL6]3+ and [FeCl4]2−/[FeCl4]−, respectively. The present assignment apparently contradict with the previous report8 in MeOH that the redox potential of [FeCl4]2−/[FeCl4]− is 200 mV lower than that of [FeL6]2+/[FeL6]3+. We note that in this report the [FeCl4]2−/[FeCl4]− complex is stabilized with adding of excess Cl−, which can significantly alter the V value. In the present experiment, the stability of the complex is controlled only by temperature without changing the solution composition.
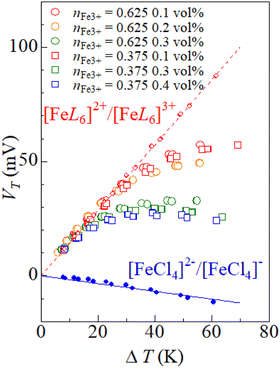
3.4 Temperature change of electrochemical Seebeck coefficient
Fig. 5 shows the VT values against ΔT in DMSO solution containing small amount of 19 M LiCl aqueous solutions. Broken and solid straight lines represent the relation in the solutions of [FeL6]2+/[FeL6]3+ and [FeCl4]2−/[FeCl4]−, respectively. In solutions with 0.1 vol% 19 M LiCl aqueous solution (red symbols), the ΔT–VT plot traces the broken line in the small ΔT region (≤30 °C). The data points begins to deviate from the broken line above ΔT ≥ 30 °C. The α value in the high ΔT region (≥40 °C) is ≈0.4 mV K−1. In solutions with 0.4 vol% 19 M LiCl aqueous solution (blue symbols), the ΔT–VT plot traces the broken line in the small ΔT region (≤20 °C). The data points begin to deviate from the broken line above ΔT ≥ 30 °C. The α value in the large ΔT region (≥30 °C) is ≈0.0 mV K−1. We emphasize that the α value (≈0.0 mV K−1) in the high ΔT region is close to the value (= −0.2 mV K−1) in the solution of [FeCl4]2−/[FeCl4]− (broken line). This clearly indicates that the crossover behavior of α is ascribed to the temperature switch of the electrochemically-active redox pair from [FeL6]2+/[FeL6]3+ to [FeCl4]2−/[FeCl4]−.Finally, let us quantitatively analyze the ΔT–VT plot including the temperature switch of the electrochemically-active redox pair. In the small ΔT region where [FeL6]2+/[FeL6]3+ is dominant, VT is expressed as VT = V(FeL6, TH) − V(FeL6, TL) = α(FeL6)ΔT, where V(FeL6, TH) and α(FeL6) are the redox potential of [FeL6]2+/[FeL6]3+ at TH and α of [FeL6]2+/[FeL6]3+, respectively. In the large ΔT region where [FeCl4]2−/[FeCl4]− is dominant, VT is expressed as VT = V(FeCl4, TH) − V(FeL6, TL) = α(FeCl4)ΔT + [V(FeCl4, TL) − V(FeL6, TL)], where V(FeCl4, TH) and α(FeCl4) are the redox potential of [FeCl4]2−/[FeCl4]− at TH and α of [FeCl4]2−/[FeCl4]−, respectively. We note that the reference for the redox potential is V(FeL6, TL), not V(FeCl4, TL), even in the large ΔT region. With extrapolation of the ΔT–VT plot toward TL, V(FeCl4, TL) − V(FeL6, TL) is evaluated to be ≈30 mV. The value (≈30 mV) is close to the potential difference (≈40 mV; see Fig. 4) between [FeL6]2+/[FeL6]3+ and [FeCl4]2−/[FeCl4]−. This again indicates that the crossover behavior of α is ascribed to the temperature switch of the electrochemically-active redox pair from [FeL6]2+/[FeL6]3+ to [FeCl4]2−/[FeCl4]−. In the present solution system, VT changes continuously with temperature because the potential difference (≈40 mV) between the two complexes is comparable to αΔT. If the potential difference could be made much larger than αΔT, a discontinuous change in VT and a substantially large α could be realized.
4 Conclusion
In conclusion, we found that α of Fe2+/Fe3+ in DMSO with small amount of 19 M LiCl aqueous solution exhibits a crossover behavior from 1.4 mV K−1 (20 °C ≤ T ≤ 40 °C) to ≈0 mV K−1 (50 °C ≤ T ≤ 80 °C), which is ascribed to the temperature switch of the electrochemically-active redox pair from [FeL6]2+/[FeL6]3+ to [FeCl4]2−/[FeCl4]−. We believe that the temperature switch of the complex species is an effective strategy to develop a solvent–solute system that exhibits a substantially large α.Author contributions
Y. N. has performed all the experiments and analyses. D. I. has set up the research equipment and assisted in the measurements. Y. M. has planned the research and wrote paper.Conflicts of interest
There are no conflicts of interest to declare.Acknowledgements
This work was supported by JSPS KAKENHI (Grant Numbers 22J11837) and Murata Science foundation.Notes and references
- (a) T. Ikeshoji, Bull. Chem. Soc. Jpn., 2000, 60, 1505 CrossRef; (b) T. Kim, J. S. Lee, G. Lee, H. Yoon, J. Yoon, T. J. Kangd and Y. H. Kim, Nano Energy, 2017, 31, 160 CrossRef CAS; (c) H. Zhou, T. Yamada and N. Kimizuka, J. Am. Chem. Soc., 2016, 138, 10502 CrossRef CAS PubMed; (d) I. Quickenden and Y. Mua, J. Electrochem. Soc., 1995, 142, 3985 CrossRef; (e) Y. Mua and T. I. Quickenden, J. Electrochem. Soc., 1996, 143, 2558 CrossRef CAS; (f) J. Kawamura, M. Shimoji and H. Hoshino, J. Phys. Soc. Jpn., 1981, 50, 194 CrossRef CAS; (g) A. Schiraldi, E. Pezzati and P. Baldini, J. Phys. Chem., 1985, 89, 1528 CrossRef CAS; (h) M. Sindhuja, B. Lohith, V. Sudha, G. R. Manjunath and S. Harinipriya, Mater. Res. Express, 2017, 4, 075513 CrossRef.
- B. Yu, J. Duan, H. Cong, W. Xie, R. Liu, X. Ahuang, H. Wang, B. Qi, M. Xu and L. Wan, Science, 2020, 370, 342 CrossRef CAS PubMed.
- J. H. Kim, J. H. Lee, E. E. Palen, M.-S. Suh, H. H. Lee and R. J. Kang, Sci. Rep., 2019, 9, 8706 CrossRef PubMed.
- J. Duan, G. Feng, B. Yu, J. Li, M. Chen, P. Yang, J. Feng, K. Liu and J. Zhou, Nat. Commun., 2018, 9, 5146 CrossRef PubMed.
- S. W. Lee, Y. Yang, H.-W. Lee, H. Ghasemi, D. Kraemer, G. Chen and Y. Cui, Nat. Commun., 2014, 5, 3942 CrossRef CAS PubMed.
- M. A. Buckingham, F. Marken and L. Aldous, Sustainable Energy Fuels, 2018, 2, 20717 RSC.
- A. Wake, D. Inoue and Y. Moritomo, Appl. Phys. Express, 2022, 15, 054002 CrossRef.
- Y. Nomura, D. Inoue and Y. Moritomo, RSC Adv., 2022, 12, 17932 RSC.
- D. Inoue, H. Niwa, H. Nitani and Y. Moritomo, J. Phys. Soc. Jpn., 2021, 90, 033602 CrossRef.
- D. Inoue, Y. Fukuzumi and Y. Moritomo, Jpn. J. Appl. Phys., 2020, 59, 037001 CrossRef CAS.
- Y. Inada, H. Hayashi, K. Sugimoto and S. Funahashi, J. Phys. Chem., 1999, 103, 1401 CrossRef CAS.
- D. Inoue, T. Komatsu, H. Niwa, H. Nitani, H. Abe and Y. Moritomo, Jpn. J. Appl. Phys., 2022, 61, 1120003 Search PubMed.
- D. Inoue, T. Komatsu, H. Niwa, T. Ina, H. Nitani, H. Abe and Y. Moritomo, J. Phys. Soc. Jpn., 2022, 91, 0094605 CrossRef.
- K. Asakura, M. Nomura and H. Kuroda, Bull. Chem. Soc. Jpn., 1985, 58, 1543 CrossRef CAS.
- (a) L. N. Mulay and P. W. Selwood, J. Am. Chem. Soc., 1955, 77, 2693 CrossRef CAS; (b) R. J. Night and R. N. Sylva, J. Inorg. Nucl. Chem., 1975, 37, 779 CrossRef; (c) H.-J. Benkelberg and W. Peter, J. Phys. Chem., 1995, 99, 5214 CrossRef CAS; (d) R. A. Danforth and B. Kohler, Chem. Phys. Lett., 2017, 683, 315 CrossRef CAS; (e) G. Bunker, Nucl. Instrum. Methods Phys. Res., 1984, 207, 437 CrossRef.
- Y. Fukuzumi, Y. Hinuma and Y. Moritomo, Jpn. J. Appl. Phys., 2019, 58, 065501 CrossRef CAS.
Footnote |
| † Electronic supplementary information (ESI) available. See DOI: https://doi.org/10.1039/d2ra07886d |
| This journal is © The Royal Society of Chemistry 2023 |

