 Open Access Article
Effects of functional groups in iron porphyrin on the mechanism and activity of oxygen reduction reaction†
Tran Phuong Dungab,
Viorel Chihaiac and
Do Ngoc Son *de
*de
aDepartment of Chemistry, University of Science, Vietnam National University, Ho Chi Minh City, Vietnam
bDepartment of Chemistry, Ho Chi Minh City University of Education, Ho Chi Minh City, Vietnam
cInstitute of Physical Chemistry “Ilie Murgulescu” of the Romanian Academy, Splaiul Independentei 202, Sector 6, 060021 Bucharest, Romania
dHo Chi Minh City University of Technology (HCMUT), 268 Ly Thuong Kiet Street, District 10, Ho Chi Minh City, Vietnam. E-mail: dnson@hcmut.edu.vn
eVietnam National University Ho Chi Minh City, Linh Trung Ward, Ho Chi Minh City, Vietnam
First published on 14th March 2023
Abstract
The activity of the oxygen reduction reaction (ORR) on the cathode is one of the dominant factors in the performance of proton exchange membrane fuel cells. Iron porphyrin has low cost, environmental benignity, and maximum efficiency of metal usage. Therefore, this material can be a promising single-atomic metal dispersion catalyst for fuel cell cathodes. The variation of functional groups was proven to effectively modify the activity of the ORR on the iron porphyrin. However, the influences of functional groups on the mechanisms of the ORR remain ambiguous. This work paid attention to the substitution of carboxyl (–COOH), methyl (–CH3), and amino (–NH2) functional groups at the meso positions of the porphyrin ring. By using van der Waals density functional theory (vdW-DF) calculations, we found that the ORR mechanisms can follow the associative and dissociative pathways, respectively. The Gibbs free energy diagrams revealed that the rate-limiting step occurs at the second hydrogenation step for the first pathway and the O2 dissociation step for the second pathway for all considered functional groups. The thermodynamic energy barrier at the rate-limiting step was found to be in the following order: porphyrin–(CH3)4 < porphyrin–(NH2)4 < original porphyrin < porphyrin–(COOH)4 for the associative mechanism and porphyrin–(NH2)4 < porphyrin–(CH3)4 < porphyrin–(COOH)4 < original porphyrin for the dissociative pathway. The findings suggested that porphyrin–(CH3)4 and porphyrin–(NH2)4 should be the best choices among the considered substrates for the oxygen reduction reaction. Furthermore, the interaction between the ORR intermediates and the substrates was attributed to the resonance of the dz2, dxz, and dyz components of the Fe d orbital and the C and N p orbitals of the substrates with the p orbitals of the oxygen atoms in the intermediates. Finally, the nature of the interaction between the adsorbent and adsorbate was charge transfer.
1. Introduction
Hydrogen gas is a clean and renewable energy source for proton exchange membrane fuel cells (PEMFCs).1 The electrochemical energy conversion of the hydrogen gas easily and silently happens on the anode of the PEMFCs. However, the oxygen reduction reaction on the cathode involves many intermediate steps and energy consumption. The employment of an expensive Pt catalyst for the ORR at the cathode weakens the competitiveness of the PEMFCs in the energy market. Besides, the presence of contaminant gases such as COx, NOx, and SOx reduces the active sites on the catalytic surface of the cathode; and hence, decreases the durability and catalytic performance of the Pt electrode.2 Many strategies have been used to improve the catalytic efficiency and cut down the precious metal content: (1) alloy Pt with earth-abundant and low-cost transition metals,3,4 (2) disperse Pt-based alloys on graphene nanoplatelets,5 (3) create the Pt-skin surface of alloys,3 and (4) synthesize the nanoparticles of Pt-based alloys with carbon supports.6,7 The literature also showed that annealing at high temperatures enhanced the ORR performance and the stability of the Pt-based alloys.4,5,8 Notably, the Pt-free alloys of non-precious metals have been investigated for the ORR, and found that, they not only offered higher stability than the Pt-based alloys, but also improved the ORR performance even better than that of commercial Pt/C nanoparticles.9–12 However, the usage of metals faces the problems of electrode corrosion during the operation of the PEMFCs and environmental unfriendliness.13Recently, much effort has been made to search for low-cost, high-performance, and low-metal loading catalysts. Single-atomic metal catalysts of non-precious transition metals (Fe, Co, Mn, Ni, etc.) and nitrogen-doped carbon materials exhibited promising efficiency and stability for the ORR.8,13–15 Particularly, the complexes of transition metals and porphyrin known as metalloporphyrins have attracted much attention due to the high flexibility of tuning their geometrical and electronic structures.16 The literature showed that substituting functional groups such as tetracarboxyphenyl, tetrapyridyl, and N-methyl-4-pyridyl could modify the ORR mechanism and activity of metalloporphyrins.17–19 Experimentally, the catalytic activity and mechanism were often studied via the cathodic current density, the redox potential of the catalyst, and the half-wave potential value of the cathodic peak. In particular, the complete reduction of O2 via a 4-electron pathway leading to high energy conversion efficiency was promoted by the formation of dimers such as face-to-face cobalt porphyrins20 and linear dimer of iron porphyrins.21 Previous studies have shown that the size of alkyl groups at meso positions of cobalt porphyrin shifted the half-wave potential for the ORR to a more negative value and decreased the number of electrons involved in the ORR from 3.8 e to 2.7 e.20,22 The other functional groups as pyridyl and carboxyphenyl could facilitate the ORR with the 4-electron mechanism due to more protons available to reduce the O2 intermediate on iron porphyrin.17,18 Also, the modification of the functional groups changed the electrochemical properties of metalloporphyrins and influenced the oxygen reduction ability of the metals in the core region of the porphyrin structure.23 Besides, the electron-withdrawing groups in iron tetraphenyl porphyrin modified the relationship between reduction rate and overpotential due to different rate-determining steps.24 However, no works are available to clarify the influences of methyl, amino, and carboxyl functional groups on the ORR mechanism of iron porphyrin. Therefore, this paper is devoted to solving the mentioned topic using density functional theory calculations and the thermodynamic model.
The present work searched for possible reaction intermediates on the porphyrin substrates with the methyl, amino, and carboxyl functional groups at the meso positions of the porphyrin ring. We then explored the structural and electronic properties of the obtained intermediates. Finally, we proposed the ORR mechanisms, calculated Gibbs free energy for the intermediate steps, and built and analyzed the Gibbs free energy diagrams to understand the mechanisms. The obtained results were compared to those available in the literature.
2. Computational details
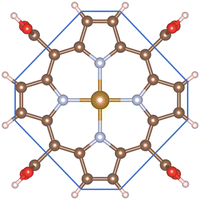
This study was carried out using the van der Waals density functional theory (vdW-DF) calculations within the revised version of the generalized gradient approximation of Perdew–Burke–Ernzerhof (GGA-revPBE) for the exchange–correlation energy by the vienna ab Initio simulation package (VASP).25 The projector-augmented wave method26 was applied to smoothen the core potential with a plane-wave cutoff energy of 450 eV. The k-point mesh of 3 × 3 × 3 was generated by the Monkhorst and Pack method27 for the integration in the first Brillouin zone. This k-point mesh sample has been tested to ensure the convergence of total energy. In the present work, Gaussian smearing with the width of 0.1 and 0.01 eV was used to accelerate the geometric optimization and for the calculation of the electronic density of states, respectively. The dipole correction along the surface normal of the porphyrin structure was included for the periodic supercells.The unit cells must be large enough to contain the porphyrin structures with the different functional groups and guarantee the vacuum space of at least 10 Å in the xyz plane and 13 Å along the surface normal. Fig. 1 shows the structure of the iron porphyrin (FePor), meso-tetramethyl iron-porphyrin (FeTMP, porphyrin–(CH3)4), meso-tetraamino iron-porphyrin (FeTAP, porphyrin–(NH2)4), and meso-tetracarboxyl iron-porphyrin (FeTCP, porphyrin–(COOH)4). All the atomic positions of the porphyrins and ORR intermediates were allowed freely moving during the geometric optimization.
The stability of the substrates can be determined via their formation energy, which is the difference between the total energy of iron-porphyrin with that of the isolated iron atom and the isolated porphyrin without iron. The formation energy of FePor, FeTMP, FeTAP, and FeTCP was −9.02, −8.50, −6.72, and −8.99 eV, respectively. The negative formation energy of the substrates implies that the incorporation of the iron atom into the porphyrin is thermodynamically favorable.
The total oxygen reduction reaction generates water as the following equation:
| O2 + 4(H+ + e−) → 2H2O | (1) |
However, it can proceed via many intermediate steps and involve many reaction intermediates.
The adsorption energy of each intermediate (A) on substrate (B) was calculated by the formula:
| Ea = EAB − [EA + EB] | (2) |
The Gibbs free energy ΔG for each intermediate step was determined via the proton and electron exchange model.28–30 The energy combining a proton and electron was equivalent to the energy of ½H2 in the gas phase at the potential of the reversible hydrogen electrode, H+ + e− = ½H2. In the standard condition (pH = 0, p = 1 bar, T = 298 K),
| ΔG = ΔE + ΔZPE − TΔS − neU | (3) |
3. Results and discussion
3.1. Structural properties
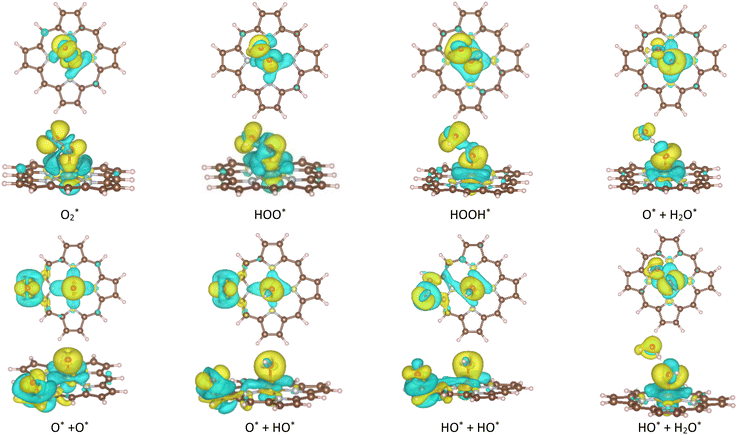
The ORR begins with the adsorption of O2 molecules on the substrate. The hydrogenation steps happen by continuously loading hydrogen atoms onto the previously adsorbed intermediates. The possible adsorption positions on the porphyrin substrates are the top of the Fe, C, and N atoms, over the Fe–N, N–C, and C–C bridges, and the hollow sites of pyrrole and Fe–N–C rings. After performing the structural relaxation by the DFT calculations, we obtained the optimized geometric structures of the substrate-intermediate systems. According to definition (2), the adsorption structure with negative adsorption energy should be favorable. The more negative adsorption energy, the more stable level is. Fig. 2a–h displayed the most stable configuration of each intermediate on the porphyrin substrate, which has the most negative adsorption energy, as shown in Table 1.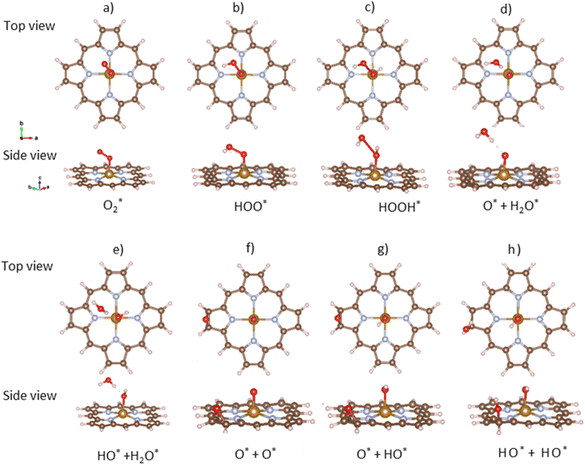 | ||
| Fig. 2 The most favorable adsorption configuration of the ORR intermediates. The top view (above) and the side view (below). Fe (yellow), C (brown), N (light blue), O (red), and H (pink). | ||
 intermediate adsorbs most favorably on the iron atom with the end-on configuration (Fig. 2a). The asterisk (*) denotes the adsorption state of the intermediate on the substrate. It should be noted that the side-on configuration of the
  intermediate on the iron atom was also obtained. However, it is less stable than the end-on one because its adsorption energy is more positive by about 0.293 eV. Besides, the adsorption energy of O2 on FePor in the present work agrees with that of (−15.6 ± 0.2 kcal mol−1 ≈ −0.68 ± 0.01 eV) obtained by the experiment.31 The first hydrogenation product of the associative scenario, HOO*, also adsorbs with the end-on configuration (Fig. 2b) and enhances the adsorption strength in comparison to the
  intermediate, see Table 1. It is possible that HOO* dissociates into O* + HO* to become a more stable intermediate. The next hydrogenation step generates HOOH* (Fig. 2c) and O* + H2O* (Fig. 2d), where O* + H2O* is more stable than HOOH*. Besides, HOOH* is less favorable than HO* + HO* because the magnitude of its adsorption energy is significantly lower than that of the latter. Therefore, the HOOH* intermediate is possible to dissociate into HO* + HO*. The third hydrogenation product is HO* + H2O* (Fig. 2e), which has the most negative adsorption energy among the ORR intermediates. It must be noted that the O* + HO*, HO* + HO*, and HO* + H2O* intermediates occur in both associative and dissociative scenarios. Therefore, we have to discuss these intermediates in the present paragraph for the completion of the description. Updating the last (fourth) hydrogen atom onto HO* of HO* + H2O* can generate two water molecules, 2H2O*, the by-product of the ORR. This final product slightly adsorbs on the surface of porphyrin substrates with the least negative adsorption energy.
 is smaller than that of O* + O*. Therefore, two oxygen atoms can separately adsorb at two different sites in a more stable state. One oxygen atom is on the top of the Fe atom, and the other is above the C–C bond of the pyrrole ring (Fig. 2f). The first and second hydrogenation steps of the O* + O* intermediate generate O* + HO* and HO*+ HO* (Fig. 2g and h), respectively. The third and fourth hydrogenation steps follow the same way as the third and fourth steps of the associative scenario accordingly.
We obtained stable structures for the ORR intermediates on the FePor, FeTMP, FeTAP, and FeTCP substrates. We found that the adsorption site and configuration of each intermediate are similar for these substrates. Table 1 also shows that the adsorption strength of each intermediate is highest on FeTAP. Furthermore, the adsorption energy is negative, while the zero-point energy is positive. The stability of each intermediate depends on the competition between the adsorption energy and the zero-point energy. As shown in Table 1, the intermediates are stable except for HOOH* on FePor, and 2H2O* on all the substrates. Remarkedly, the 2H2O* intermediate exhibits a much higher zero-point energy than the absolute value of its adsorption energy. Therefore, it perhaps leaves the adsorption surface after completing the oxygen reduction reaction. For the intermediates that have the same number of hydrogen atoms ( vs. O* + O*, HOO* vs. O* + HO*, and HOOH* vs. HO* + HO*), the intermediate with atomic oxygens will adsorb stronger than the intermediate with the molecular oxygen on the substrate surface. The HO* + H2O* intermediate is the strongest adsorption intermediate compared to the others. This finding is in good agreement with the previous publication that the HO* intermediate covered the Fe site in a wide range of electrode potentials.32
One oxygen atom of each intermediate always adsorbs on the iron site (Fig. 2) with the O–Fe bond distance of about 1.6 to 1.9 Å except for that of about 2.5 Å for 2H2O*, while the O–O distance increases as the number of hydrogen atoms in the intermediates increases (Table S1 in ESI†). The second oxygen atom in the dissociative adsorption scenario is always at the boundary of the substrates. Particularly, each intermediate in the dissociative state shows a significantly large O–O distance compared to that of the associative state. The more the negative adsorption energy, the more the elongated O–O bond length of the oxygen atoms.
3.2 Electronic properties
The nature of the interaction between the ORR intermediates and the porphyrin substrates can be explained via the electronic structure properties, i.e., the Bader point charge, the charge density difference, and the electronic density of states.To make the discussion simple, we divided the porphyrin structures into the core region and the functional group. According to this partition, the functional groups include the H atoms, –CH3, –NH2, and –COOH for the porphyrin substrates. The core region includes the Fe, C, and N atoms of the original iron porphyrin, see Scheme 1. The Bader charge has been calculated by subtracting the charge of the neutral atoms from the charge of the corresponding atoms in the substrate. The Bader charge of the clean substrates in Table 2 shows that, for the different functional groups, the Fe and C atoms in the core region of the porphyrin ring always donate, while the N atoms always accumulate, the negative charge (e−) compared to their neutral state. As a result, the core region of clean FePor and FeTMP gains, while that of clean FeTAP and FeTCP loses a negative charge. The functional groups have to compensate for the charge variation of the core region so that the substrates become neutral. Particularly, while the H and TMP functional groups donate, the TAP and TCP groups gain the charge. This finding implies that the H and TMP groups exhibit the charge-donating to, while the TAP and TCP show charge-withdrawing nature from, the core region of the porphyrin. On the other hand, according to the classical viewpoint of chemistry, the influences of functional groups on the charge distribution to be defined as the electron-donating and -withdrawing are based on the charge gain and loss of the reaction center, the Fe atom in this study. For the substitution of the functional groups, we found that the charge loss of the Fe atom decreases for TMP and increases for TAP and TCP compared to FePor. Therefore, TMP reveals electron-donating while TAP and TCP show electron-withdrawing properties. Besides, the Bader charge of TAP shows a large negative charge accumulation due to the charge-gaining nature of the N atoms of the TAP group. Furthermore, the charge loss of the Fe metal center decreases in the following order FeTAP > FeTCP > FePor > FeTMP.
| System | Elementa | FePor | FeTMP | FeTAP | FeTCP |
|---|---|---|---|---|---|
| a The ∑ denotation implies the summation of the charge. | |||||
| Clean substrate | Fe | −1.369 | −1.359 | −1.394 | −1.391 |
| ∑C | −8.952 | −8.664 | −12.717 | −9.513 | |
| ∑N | 10.345 | 10.323 | 10.295 | 10.567 | |
| ∑core | 0.024 | 0.300 | −3.816 | −0.337 | |
| ∑func | −0.024 | −0.300 | 3.816 | 0.337 | |
 |
 |
0.439 | 0.466 | 0.504 | 0.393 |
| Fe | −1.533 (−0.164) | −1.542 (−0.183) | −1.511 (−0.117) | −1.523 (−0.132) | |
| ∑C | −9.093 (−0.141) | −8.756 (−0.092) | −13.153 (−0.436) | −9.413 (0.100) | |
| ∑N | 10.182 (−0.163) | 10.168 (−0.155) | 10.250 (−0.045) | 10.419 (−0.148) | |
| ∑core | −0.444 (−0.468) | −0.130 (−0.430) | −4.414 (−0.598) | −0.517 (−0.180) | |
| ∑func | 0.005 (0.029) | −0.336 (−0.036) | 3.910 (0.094) | 0.124 (−0.213) | |
| HOO*/substrate | HOO* | 0.469 | 0.497 | 0.558 | 0.472 |
| Fe | −1.552 (−0.183) | −1.563 (−0.204) | −1.540 (−0.146) | −1.595 (−0.204) | |
| ∑C | −9.139 (−0.187) | −8.920 (−0.256) | −13.055 (−0.338) | −9.562 (−0.049) | |
| ∑N | 10.229 (−0.116) | 10.200 (−0.123) | 10.277 (−0.018) | 10.421 (−0.146) | |
| ∑core | −0.462 (−0.486) | −0.283 (−0.583) | −4.318 (−0.502) | −0.736 (−0.399) | |
| ∑func | −0.007 (0.017) | −0.214 (0.086) | 3.760 (−0.056) | 0.264 (−0.073) | |
| HOOH*/substrate | HOOH* | 0.517 | 0.667 | 0.691 | 0.613 |
| Fe | −1.539 (−0.170) | −1.623 (−0.264) | −1.582 (−0.188) | −1.616 (−0.225) | |
| ∑C | −9.172 (−0.220) | −8.848 (−0.184) | −13.205 (−0.488) | −9.378 (0.135) | |
| ∑N | 10.185 (−0.160) | 10.249 (−0.074) | 10.268 (−0.027) | 10.234 (−0.333) | |
| ∑core | −0.526 (−0.550) | −0.222 (−0.522) | −4.519 (−0.703) | −0.760 (−0.423) | |
| ∑func | 0.009 (0.033) | −0.445 (−0.145) | 3.828 (0.012) | 0.147 (−0.190) | |
| O* + H2O*/substrate | O* + H2O* | 0.735 | 0.734 | 0.74 | 0.722 |
| Fe | −1.642 (−0.273) | −1.625 (−0.266) | −1.565 (−0.171) | −1.640 (−0.249) | |
| ∑C | −9.147 (−0.195) | −8.74 (−0.076) | −13.133 (−0.416) | −9.378 (0.135) | |
| ∑N | 10.120 (−0.225) | 10.085 (−0.238) | 10.132 (−0.163) | 10.085 (−0.482) | |
| ∑core | −0.669 (−0.693) | −0.280 (−0.580) | −4.566 (−0.750) | −0.933 (−0.596) | |
| ∑func | −0.066 (−0.042) | −0.454 (−0.154) | 3.826 (0.010) | 0.211 (−0.126) | |
| HO* + H2O*/substrate | HO* + H2O* | 0.505 | 0.532 | 0.564 | 0.501 |
| Fe | −1.572 (−0.203) | −1.589 (−0.230) | −1.522 (−0.128) | −1.588 (−0.197) | |
| ∑C | −9.013 (−0.061) | −8.709 (−0.045) | −13.088 (−0.371) | −9.280 (0.233) | |
| ∑N | 10.164 (−0.181) | 10.150 (−0.173) | 10.210 (−0.085) | 10.204 (−0.363) | |
| ∑core | −0.421 (−0.445) | −0.148 (−0.448) | −4.400 (−0.584) | −0.664 (−0.327) | |
| ∑func | −0.084 (−0.060) | −0.384 (−0.084) | 3.836 (0.020) | 0.163 (−0.174) | |
| 2H2O*/substrate | 2H2O* | −0.013 | −0.008 | −0.002 | −0.035 |
| Fe | −1.422 (−0.053) | −1.424 (−0.065) | −1.399 (−0.005) | −1.420 (−0.029) | |
| ∑C | −9.006 (−0.054) | −8.663 (0.001) | −12.950 (−0.233) | −9.277 (0.236) | |
| ∑N | 10.411 (0.066) | 10.353 (0.030) | 10.351 (0.056) | 10.399 (−0.168) | |
| ∑core | −0.017 (−0.041) | 0.266 (−0.034) | −3.998 (−0.182) | −0.298 (0.039) | |
| ∑func | 0.030 (0.054) | −0.258 (0.042) | 4.000 (0.184) | 0.333 (−0.004) | |
| O* + O*/substrate | O* + O* | 1.599 | 1.506 | 1.56 | 1.546 |
| Fe | −1.694 (−0.325) | −1.597 (−0.238) | −1.648 (−0.254) | −1.684 (−0.293) | |
| ∑C | −9.973 (−1.021) | −9.630 (−0.966) | −13.874 (−1.157) | −10.342 (−0.829) | |
| ∑N | 10.131 (−0.214) | 10.103 (−0.220) | 10.178 (−0.117) | 10.272 (−0.295) | |
| ∑core | −1.536 (−1.560) | −1.124 (−1.424) | −5.344 (−1.528) | −1.754 (−1.417) | |
| ∑func | −0.063 (−0.039) | −0.382 (−0.082) | 3.784 (−0.032) | 0.208 (−0.129) | |
| O* + HO*/substrate | O* + HO* | 1.312 | 1.305 | 1.318 | 1.276 |
| Fe | −1.578 (−0.209) | −1.545 (−0.186) | −1.514 (−0.120) | −1.581 (−0.190) | |
| ∑C | −9.989 (−1.037) | −9.631 (−0.967) | −13.695 (−0.978) | −10.254 (−0.741) | |
| ∑N | 10.221 (−0.124) | 10.126 (−0.197) | 10.175 (−0.120) | 10.280 (−0.287) | |
| ∑core | −1.346 (−1.370) | −1.050 (−1.350) | −5.034 (−1.218) | −1.555 (−1.218) | |
| ∑func | 0.034 (0.058) | −0.255 (0.045) | 3.716 (−0.100) | 0.279 (−0.058) | |
| HO* + HO*/substrate | HO* + HO* | 1.144 | 1.120 | 1.139 | 1.116 |
| Fe | −1.600 (−0.231) | −1.598 (−0.239) | −1.550 (−0.156) | −1.568 (−0.177) | |
| ∑C | −9.505 (0.553) | −9.154 (−0.490) | −13.510 (−0.793) | −9.868 (−0.355) | |
| ∑N | 10.084 (−0.261) | 9.978 (−0.345) | 10.144 (−0.151) | 9.993 (−0.574) | |
| ∑core | −1.021 (−1.045) | −0.774 (−1.074) | −4.916 (−1.100) | −1.443 (−1.106) | |
| ∑func | −0.123 (−0.099) | −0.346 (−0.046) | 3.777 (−0.039) | 0.327 (−0.010) | |
Upon the adsorption of the intermediates, the Fe, C, and N atoms retain the charge donation and accumulation properties as that of the clean substrates. However, the detailed variation for each atom of the core region will be different. We found that all the intermediates significantly gain the charge from the substrates except for the final product 2H2O* donating the charge to the substrates, which indicates that the nature of the interaction between each intermediate and the substrates is the charge exchange. The charge difference, δC, for the Fe, C, and N atoms in the core region and the functional group of the FePor, FeTMP, FeTAP, and FeTCP substrates shows the minus or plus signs depending on the various intermediates. Even though the core region of each substrate with the adsorption of the intermediates, except for 2H2O* on FeTCP, always loses the charge relative to the clean substrate. The significant charge loss of the core region was found to mainly stem from the donation of the Fe and C atoms of the porphyrin ring.
Table S2 in ESI,† shows the charge of the oxygen atoms of the intermediates alone. We found that the oxygen atoms of all the intermediates are the centers of the charge gain that also exhibit in the charge density difference (Fig. 3). We also can see the charge loss clouds occurring near the Fe and C atoms. The total accumulating charge of the two oxygen atoms for each intermediate was presented in Fig. 4. The higher the order of hydrogenation, i.e., from blocks 1 to 6 for the associative and 7 to 9 for the dissociative scenario, the higher the total charge gain of the oxygen atoms is. It should be noted that the intermediates in blocks 4, 5, and 6 are considered as those that belong to both the associative and dissociative adsorption pathways. By comparing the molecular state with the atomic state of the intermediates, blocks 1 with 7, 2 with 8, and 3 with 9, we found that the charge gain of the oxygen atoms of the intermediates is more significant in the dissociative adsorption than the associative one. The total charge difference between the pairs of these blocks is about 1.0 to 1.2, 0.7 to 0.8, and 0.4 to 0.6 e−, respectively. Physically, when two oxygen atoms of the intermediates gain more charge, the coulomb-repulsive force between them increases. This force pushed two oxygen atoms away to form more stable states. Therefore, the dissociative intermediates have more negative adsorption energy and longer O–O bond distance compared to the associative ones with the same number of hydrogen atoms, as shown in Table S1 in ESI.†
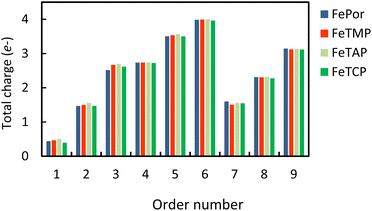 | ||
Fig. 4 The total accumulating charge of two oxygen atoms of each intermediate. Blocks 1–9 presents  , HOO*, HOOH*, O* + H2O*, HO* + H2O*, 2H2O*, O* + O*, O* + HO*, and HO* + HO*, respectively. , HOO*, HOOH*, O* + H2O*, HO* + H2O*, 2H2O*, O* + O*, O* + HO*, and HO* + HO*, respectively. | ||
A deeper understanding of the nature of the interaction between the ORR intermediates and the substrates can be exposed via the analysis of the electronic density of states (DOS). Fig. 5 (also Fig. S1 and S2 in ESI†) describes the DOS of the substrate-intermediate systems for the intermediates in the associative and dissociative scenarios. The resonance or overlap of the DOS peaks between the adsorbate and the adsorbent identifies the nature of their interaction, which induces the charge transfer from the substrates to the intermediates as mentioned in the Bader charge analysis of Table 2. In Fig. 5 (and Fig. S1 and S2†), we only drew the most significant orbitals near the Fermi level. Also, the Fe dxz and Fe dyz orbitals are identical in all plots. Therefore, we plotted one of them, i.e., the Fe dxz orbital. Fig. 5, S1, and S2† show that the p states (pz more often than px and py) of the oxygen atoms of the intermediates around the Fermi level participate in the interaction with the substrates. Simultaneously, the z-components of the Fe d orbital, i.e., dxz (dyz) and dz2 of the substrates are the main contributors to the interaction with the ORR intermediates. In several cases, for example,  on FeTCP, HOO* on FeTAP, HOOH* on FeTMP, and the others, the C pz and N pz orbitals also make a significant contribution. Generally speaking, the z-components of the Fe d orbitals and the C and N p orbitals of the substrates with the O p orbitals of the intermediates around the Fermi level are attributed to the physical nature of the adsorbate–adsorbent interaction for the ORR on the porphyrin substrate. The DOS was found to support the Bader charge analysis.
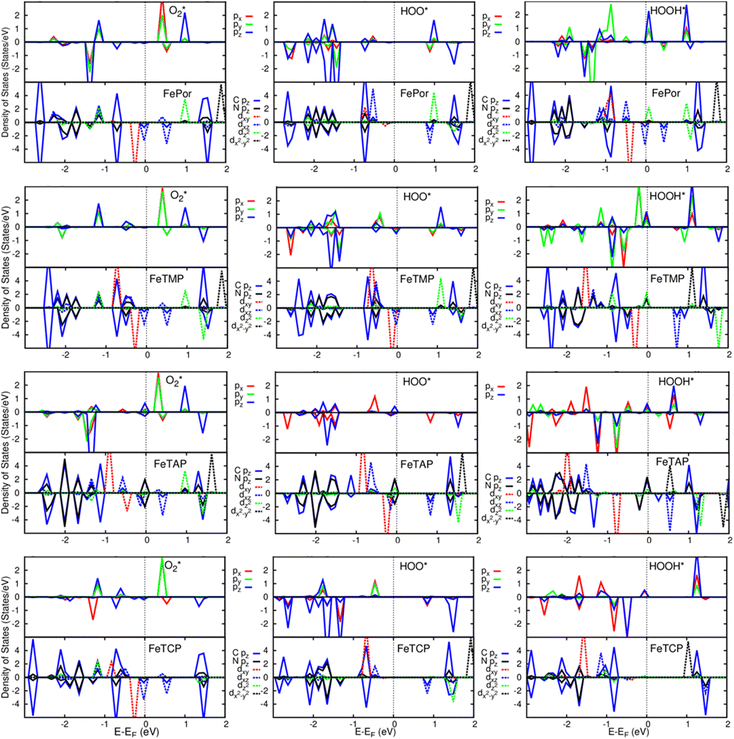 | ||
Fig. 5 Electronic density of states for the systems of the substrates with  , HOO*, and HOOH*. The dxz and dyz orbitals are identical. , HOO*, and HOOH*. The dxz and dyz orbitals are identical. | ||
3.3. Mechanisms of oxygen reduction reaction
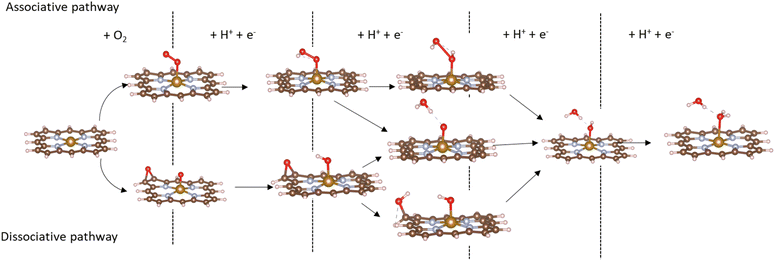
Based on the obtained ORR intermediates, the total oxygen reduction reaction (1) can proceed in two scenarios, i.e., the dissociative and associative pathways, as described in Fig. 6.The associative mechanism starts with the molecular adsorption of O2 on the substrates as follows:29,33
 | (5) |
 | (6) |
| HOO* + H+ + e− → HOOH*, | (7) |
| HOO* + H+ + e− → O* + H2O*, | (8) |
| HOOH* + H+ + e− → HO* + H2O*, | (9) |
| O* + H2O* + H+ + e− → HO* + H2O*, | (10) |
| HO* + H2O* + H+ + e− → * + 2H2O. | (11) |
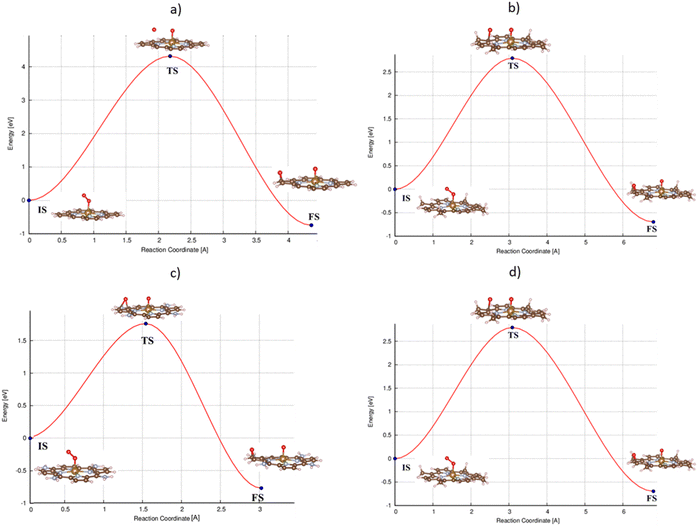
For the dissociative mechanism, the adsorbed  can dissociate into two oxygen atoms before the protons and electrons transfer on the surface of substrates. The transition state (TS) structure of the O2 dissociation was determined via three steps: first, the initial state (IS) of
  and the final state (FS) of O* + O* were found by the DFT calculations, then the TS structure was interpolated based on the initial and final state structures. After that, the TS structure was optimized using the NEB – DFT method, and the total energy of the optimized TS structure was calculated. As shown in Fig. 7, the
  dissociation must overcome an activation barrier of 4.32, 2.67, 1.67, and 2.73 eV on FePor (a), FeTMP (b), FeTAP (c), and FeTCP (d), respectively. It should be emphasized that the barrier obtained by NEB only includes the electronic effect (disregard zero-point energy, entropy, and electrode potential). The dissociative mechanism can proceed in the following reaction series:29,33
 | (12) |
| O* + O* + H+ + e− → O* + HO*, | (13) |
| O* + HO* + H+ + e− → HO* + HO*, | (14) |
| O* + HO* + H+ + e− → O* + H2O*, | (15) |
| HO* + HO* + H+ + e− → HO* + H2O*, | (16) |
| O* + H2O* + H+ + e− → HO* + H2O*, | (17) |
| HO* + H2O* + H+ + e− → * + 2H2O. | (18) |
The Gibbs free energy for each intermediate step, relative to that of the isolated by-product 2H2O in eqn (11) and (18), was calculated at the temperature of 300 K, the pressure of 1 bar, pH = 0, and the electrode potential of U = 1.23 V. The zero-point energy and entropy changes (ΔZPE and TΔS) of each intermediate reaction were calculated by subtracting the corresponding values of the reactants from that of the products in the reversible hydrogen electrode conditions (H+ + e = ½H2).
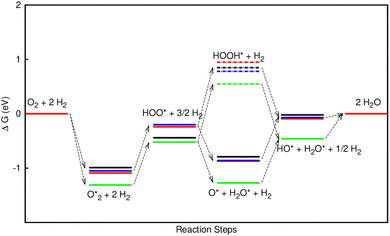
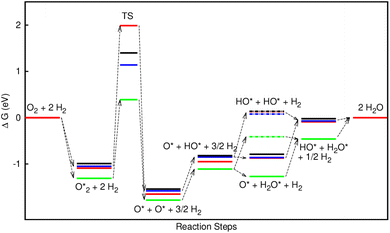
Table 3 presents the obtained values for the Gibbs free energy of the ORR intermediate steps in the associative and dissociative pathways, see eqn (5)–(18). The Gibbs free energy for the transition state (TS) of the  dissociation into O* + O* was calculated in the same manner as those for the ORR intermediate steps by including the contributions of zero-point energy, entropy, and electrode potential. Fig. 8 and 9 show the free energy diagrams for the associative and dissociative pathways, respectively. We found that the ORR on all substrates is going downhill from O2 + 2H2 to
  + 2H2, which implies that the + 2H2 step can proceed automatically without an energy supply for both reaction pathways.
Fig. 8 shows that, in the forwarding direction from left to right, the first hydrogenation step from  + 2H2 to HOO* + 3/2H2, the second hydrogenation from HOO* + 3/2H2 to HOOH* + H2, the third hydrogenation from O* + H2O* + H2 to HO* + H2O* + ½H2, and the fourth hydrogenation from HO* + H2O* + ½H2 to 2H2O are going uphill. This result implies that generating the corresponding intermediates, i.e., HOO*, HOOH*, HO* + H2O*, and 2H2O* requires activation energy. Besides, the other hydrogenation steps, from HOO* + 3/2H2 to O* + H2O* + H2, and HOOH* + H2 to HO* + H2O* + ½H2, can proceed automatically because they are going downhill. Furthermore, the formation of O* + H2O* + H2 occurs more easily than that of HOOH*, even though they contain the same number of hydrogen atoms, and both can convert into HO* + H2O*. The conversion of HO* + H2O* into 2H2O requires a smaller activation energy on FePor, FeTMP, and FeTCP than that on FeTAP. The thermodynamic barriers for the different reaction steps were listed in Table 4. From the left to right side of the Gibbs free energy diagram in Fig. 8, the highest thermodynamic barrier was found at the second hydrogenation step that converts HOO* to HOOH*. Therefore, the rate-limiting step in the associative mechanism should be the second hydrogenation step. The finding of HOOH* on the substrates supports the experimental finding,21 where both H2O2 and H2O were the products of the reaction.
In the dissociative mechanism, we incorporated the transition state of the  dissociation to 2O* into the Gibbs free energy diagram, Fig. 9. This figure demonstrates that the formation of O* + O* + 2H2 from
  + 2H2 must overcome a large energy barrier. The first hydrogenation step from O* + O* + 2H2 to O* + HO* + 3/2H2, the second hydrogenation from O* + HO* + 3/2H2 to HO* + HO* + H2, and the third hydrogenation step from O* + H2O* + H2 to HO* + H2O* + ½H2, are going uphill and request the corresponding activation barrier (Table 4). However, these thermodynamic barriers for the hydrogenation steps are significantly lower than that of the
  dissociation. Therefore, the rate-limiting step in the dissociative mechanism locates at the dissociation step of the
  intermediate into 2O*. In the backward direction from the right to the left side of the diagrams in Fig. 8 and 9, the conversion from 2H2O to HO* + H2O* + ½H2 to O* + H2O* + H2 occurs automatically on all substrates because the O* + H2O* and HO* + H2O* intermediates adsorbed too strongly as shown in Table 1. This result agrees with the Sabatier principle, which states that the adsorption strength between a catalyst and reactant should be neither too strong nor too weak for good catalytic performance. Therefore, there are possibilities that these intermediates will be long-lasting on the surface and block the catalytic active sites of the substrates. This result is also in good agreement with the theoretical finding that the HO* intermediate always occurs on the porphyrin.32 Based on the thermodynamic energy barriers, we found that the associative mechanism on FeTMP requires the lowest activation energy. Similarly, the dissociative mechanism needs to overcome the smallest activation barrier on FeTAP. Even though, the reconversion of 2H2O into the more stable intermediates perhaps hinders the catalytic performance of all substrates for both associative and dissociative mechanisms. Combining with the second lowest activation barrier for both mechanisms, we can conclude that FeTMP and FeTAP should be the best choices among the considered substrates for the oxygen reduction reaction.
Furthermore, the highest electrode potential at which the molecular oxygen spontaneously reduced to 2H2O is the onset potential.30 Our calculations obtained the onset potential of 0.39, 0.38, 0.42, and 0.46 V for the associative mechanism, and 0.53, 0.49, 0.56, and 0.52 V for the dissociative mechanism on FePor, FeTMP, FeTAP, and FeTCP, respectively. The results implied that the onset potential for the ORR varies with the functional groups. Particularly, 0.39 and 0.53 V for the associative and dissociative pathways on FePor agree with 0.67 V obtained by the previous experiment.21
4. Conclusions
The present work studied the oxygen reduction reaction on the original porphyrin and the porphyrin with different functional groups using density functional theory calculations and a thermodynamic model. The study has been performed in the following steps: (1) searched for the possible intermediates and their favorable adsorption configurations. (2) Clarified the interaction between the intermediates with the porphyrin substrates. (3) Proposed the reaction mechanisms, the associative and dissociative ones. (4) Calculated the Gibbs free energy for each intermediate step in the proposed mechanisms. (5) Plotted the Gibbs free energy diagrams for each mechanism. The analysis showed that the rate-limiting step for the associative and dissociative mechanisms is the second hydrogenation step converting HOO to HOOH and the dissociation of O2 into 2O, respectively. The –CH3 and –NH2 groups offered small activation barriers; therefore, better catalytic activity for oxygen reduction reaction among the considered functional groups and the original porphyrin.Author contributions
Conceptualization (DNS), formal analysis (TPD and DNS), investigation (TPD), resources (VC and DNS), supervision (VC and DNS), validation (DNS), visualization (TPD), writing manuscript (DNS), reviewing and editing (TPD, VC, and DNS).Conflicts of interest
There are no conflicts to declare.Acknowledgements
Tran Phuong Dung was funded by the Ho Chi Minh City University of Education under grant number CS. 2021.19.24. We acknowledge Ho Chi Minh City University of Technology (HCMUT), VNU-HCM for supporting this study.References
- I. Staffell, D. Scamman, A. Velazquez Abad, P. Balcombe, P. E. Dodds, P. Ekins, N. Shah and K. R. Ward, The role of hydrogen and fuel cells in the global energy system, Energy Environ. Sci., 2019, 12, 463–491 RSC.
- X. Cheng, Z. Shi, N. Glass, L. Zhang, J. Zhang and D. Song, et al, A review of PEM hydrogen fuel cell contamination: Impacts, mechanisms, and mitigation, J. Power Sources, 2007, 165, 739–756 CrossRef CAS.
- V. R. Stamenkovic, B. S. Mun and M. Arenz, et al, Trends in electrocatalysis on extended and nanoscale Pt-bimetallic alloy surfaces, Nat. Mater., 2007, 6, 241–247 CrossRef CAS PubMed.
- Y. Zhu, S. Wang, Q. Luo, H. Huang, S. Tang and Y. Du, Facile synthesis of structurally ordered low-Pt-loading Pd–Pt–Fe nanoalloys with enhanced electrocatalytic performance for oxygen reduction reaction, J. Alloys Compd., 2021, 855, 157322 CrossRef CAS.
- E. Daş, S. A. Gürsel and A. B. Yurtcan, Pt-alloy decorated graphene as an efficient electrocatalyst for PEM fuel cell reactions, J. Supercrit. Fluids, 2020, 165, 104962 CrossRef.
- H. Yang, W. Vogel, C. Lamy and N. Alonso-Vante, Structure and electrocatalytic activity of carbon-supported Pt-Ni alloy nanoparticles toward the oxygen reduction reaction, J. Phys. Chem. B, 2004, 108, 11024–11034 CrossRef CAS.
- J. Liu, J. Lan, L. Yang, F. Wang and J. Yin, PtM (M = Fe, Co, Ni) bimetallic nanoclusters as active, methanol tolerant, and stable catalysts toward oxygen reduction reaction, ACS Sustainable Chem. Eng., 2019, 7, 6541–6549 CrossRef CAS.
- Y. Li, Q. Li, H. Wang, L. Zhang, D. P. Wilkinson and J. Zhang, Recent progresses in oxygen reduction reaction electrocatalysts for electrochemical energy applications, Electrochem. Energy Rev., 2019, 2, 518–538 CrossRef CAS.
- O. Savadogo, K. Lee, S. Mitsushima, N. Kamiya and K.-I. Ota, Investigation of some new palladium alloys catalysts for the oxygen reduction reaction in an acid medium, J. New Mater. Electrochem. Syst., 2004, 7, 77–84 CAS.
- M. D. Bhatt, G. Lee and J. S. Lee, Screening of oxygen-reduction-reaction-efficient electrocatalysts based on Ag–M (M= 3d, 4d, and 5d Transition Metals) nanoalloys: a density functional theory study, Energy Fuels, 2017, 31, 1874–1881 CrossRef CAS.
- T. Wang, A. Chutia, D. J. L. Brett, P. R. Shearing, G. He, G. Chai and I. P. Parkin, Palladium alloys used as electrocatalysts for the oxygen reduction reaction, Energy Environ. Sci., 2021, 14, 2639–2669 RSC.
- D. N. Son, P. N. Thanh, N. D. Quang, K. Takahashi and M. P. Pham-Ho, J. Appl. Electrochem., 2017, 47, 747–754 CrossRef CAS.
- R. L. Borup, et al, Recent developments in catalyst-related PEM fuel cell durability, Curr. Opin. Electrochem., 2020, 21, 192–200 CrossRef CAS.
- H.-J. Niu, L. Zhang, J.-J. Feng, Q.-L. Zhang, H. Huang and A.-J. Wang, Graphene-encapsulated cobalt nanoparticles embedded in porous nitrogen-doped graphitic carbon nanosheets as efficient electrocatalysts for oxygen reduction reaction, J. Colloid Interface Sci., 2019, 552, 744–751 CrossRef CAS PubMed.
- Y. He, S. Liu, C. Priest, Q. Shi and G. Wu, Atomically dispersed metal–nitrogen–carbon catalysts for fuel cells: advances in catalyst design, electrode performance, and durability improvement, Chem. Soc. Rev., 2020, 49, 3484–3524 RSC.
- S. Hiroto, Y. Miyake and H. Shinokubo, Synthesis and functionalization of porphyrins through organometallic methodologies, Chem. Rev., 2017, 117, 2910–3043 CrossRef CAS PubMed.
- C. T. Carver, B. D. Matson and J. M. Mayer, Electrocatalytic oxygen reduction by iron tetra-arylporphyrins bearing pendant proton relays, J. Am. Chem. Soc., 2012, 134, 5444–5447 CrossRef CAS PubMed.
- B. D. Matson, C. T. Carver, A. Von Ruden, J. Y. Yang, S. Raugei and J. M. Mayer, Distant protonated pyridine groups in water-soluble iron porphyrin electrocatalysts promote selective oxygen reduction to water, Chem. Commun., 2012, 48, 11100–11102 RSC.
- Q. He, et al, Molecular catalysis of the oxygen reduction reaction by iron porphyrin catalysts tethered into Nafion layers: an electrochemical study in solution and a membrane-electrode-assembly study in fuel cells, J. Power Sources, 2012, 216, 67–75 CrossRef CAS.
- C. Shi, B. Steiger, M. Yuasa and F. C. Anson, Electroreduction of O2 to H2O at unusually positive potentials catalyzed by the simplest of the cobalt porphyrins, Inorg. Chem., 1997, 36, 4294–4295 CrossRef CAS PubMed.
- G. Tei, T. Tamaki, T. Hayashi, K. Nakajima, A. Sakai, S. Yotsuhashi and T. Ogawa, Oxygen reduction reaction (ORR) activity of a phenol-substituted linear FeIII–porphyrin dimer, Eur. J. Inorg. Chem., 2017, 26, 3229–3232 CrossRef.
- M. Yuasa, R. Nishihara, C. Shi and F. C. Anson, A comparison of several meso-tetraalkyl cobalt porphyrins as catalysts for the electroreduction of dioxygen, Polym. Adv. Technol., 2001, 12, 266–270 CrossRef CAS.
- F. A. Walker, D. Beroiz and K. M. Kadish, Electronic effects in transition metal porphyrins. 2. The sensitivity of redox and ligand addition reactions in para-substituted tetraphenylporphyrin complexes of cobalt(II), J. Am. Chem. Soc., 1976, 98, 3484–3489 CrossRef CAS PubMed.
- Sk Amanullah, S. A. H. A. Paramita and D. E. Y. Abhishek, O2 reduction by iron porphyrins with electron withdrawing groups: to scale or not to scale, Faraday Discuss., 2022, 234, 143–158 RSC.
- J. Hafner, Ab-initio simulations of materials using VASP: density-functional theory and beyond, J. Comput. Chem., 2008, 29, 2044–2078 CrossRef CAS PubMed.
- P. E. Blöchl, Projector augmented-wave method, Phys. Rev. B: Condens. Matter Mater. Phys., 1994, 50, 17953–17979 CrossRef.
- H. J. Monkhorst and J. D. Pack, Special points for Brillouin-zone integrations, Phys. Rev. B: Condens. Matter Mater. Phys., 1976, 13, 5188–5192 CrossRef.
- O. My Na, N. T. Xuan Huynh, P. T. Thi, V. Chihaia and D. N. Son, Mechanism and activity of the oxygen reduction reaction on WTe2 transition metal dichalcogenide with Te vacancy, RSC Adv., 2020, 10, 8460–8469 RSC.
- D. N. Son, O. K. Le, V. Chihaia and K. Takahashi, Effects of Co content in Pd-Skin/PdCo alloys for oxygen reduction reaction: density functional theory predictions, J. Phys. Chem. C, 2015, 119, 24364–24372 CrossRef CAS.
- J. K. Nørskov, J. Rossmeisl, A. Logadottir, L. Lindqvist, J. R. Kitchin, T. Bligaard and H. Jonsson, Origin of the overpotential for oxygen reduction at a fuel-cell cathode, J. Phys. Chem. B, 2004, 108, 17886–17892 CrossRef.
- J. P. Collman, J. I. Brauman and K. S. Suslick, Oxygen binding to iron porphyrins, J. Am. Chem. Soc., 1975, 97(24), 7185–7186 CrossRef CAS PubMed.
- Y. Wang, Y. Tang and K. Zhou, Self-adjusting activity induced by intrinsic reaction intermediate in Fe−N−C single-atom catalysts, J. Am. Chem. Soc., 2019, 141, 14115–14119 CrossRef CAS PubMed.
- D. N. Son and K. Takahashi, Selectivity of palladium–cobalt surface alloy toward oxygen reduction reaction, J. Phys. Chem. C, 2012, 116, 6200–6207 CrossRef CAS.
Footnote |
| † Electronic supplementary information (ESI) available. See DOI: https://doi.org/10.1039/d2ra08007a |
| This journal is © The Royal Society of Chemistry 2023 |


