 Open Access Article
Creative Commons Attribution 3.0 Unported Licence
UO2 dissolution in bicarbonate solution with H2O2: the effect of temperature†
John McGrady‡
 *a,
Yuta Kumagai
 *a,
Yoshihiro Kitatsujia,
Akira Kirishimab,
Daisuke Akiyamab and
Masayuki Watanabea
aNuclear Science and Engineering Center, Japan Atomic Energy Agency (JAEA), Tokai, Ibaraki 319-1195, Japan. E-mail: j.mcgrady@kyotofusioneering.com; kumagai.yuta@jaea.go.jp
bInstitute of Multidisciplinary Research for Advanced Materials, Tohoku University, 1-1 Katahira, 2-chome, Aoba-ku, Sendai 980-8577, Japan
First published on 22nd September 2023
Abstract
Upon nuclear waste canister failure and contact of spent nuclear fuel with groundwater, the UO2 matrix of spent fuel will interact with oxidants in the groundwater generated by water radiolysis. Bicarbonate (HCO3−) is often found in groundwater, and the H2O2 induced oxidative dissolution of UO2 in bicarbonate solution has previously been studied under various conditions. Temperatures in the repository at the time of canister failure will differ depending on the location, yet the effect of temperature on oxidative dissolution is unknown. To investigate, the decomposition rate of H2O2 at the UO2 surface and dissolution of UVI in bicarbonate solution (0.1, 1, 10 and 50 mM) was analysed at various temperatures (10, 25, 45 and 60 °C). At [HCO3−] ≥ 1 mM, the concentration of dissolved UVI decreased with increasing temperature. This was attributed to the formation of UVI-bicarbonate species at the surface and a change in the mechanism of H2O2 decomposition from oxidative to catalytic. At 0.1 mM, no obvious correlation between temperature and U dissolution was observed, and thermodynamic calculations indicated this was due to a change in the surface species. A pathway to explain the observed dissolution behaviour of UO2 in bicarbonate solution as a function of temperature was proposed.
Introduction
Ensuring the safe disposal of spent nuclear fuel provides numerous engineering and technological challenges to the global nuclear community. A current potential strategy for spent fuel disposal is the use of deep geological repositories which provide a long-term solution for spent fuel storage needs. The repository barriers between spent fuel and the local environment have been designed to endure, yet inevitably these barriers will breakdown leading to the release of radioactive species from spent fuel. The dominant mechanism of radionuclide release in such an event is predicted to be due to the interaction of groundwater with the spent fuel surface, leading to dissolution and subsequent transport of the radionuclides from the repository to the environment.UO2 is the main constituent of spent fuel making up around 95%, while the remaining 5% consists of fission products and heavier actinide species. Typical groundwater at repository depths is reducing and anoxic, and the solubility of UIV under such conditions is very low. Therefore, significant dissolution of U from UO2 to groundwater may not be expected. However, ionizing radiation from the spent fuel will cause radiolysis of the groundwater, and oxidising radiolysis products (such as H2O2, O2, OH˙) will be generated at the spent fuel surface. This will have a significant effect on the redox chemistry at the surface and the rate of UO2 oxidation. As the solubility of UVI is significantly higher than UIV in typical groundwater conditions,1,2 oxidation of the surface is expected to have a large impact on U dissolution.
Studies have identified H2O2 as the primary radiolysis product of concern with regards to UO2 oxidation,3,4 and two pathways for the reaction of H2O2 with UO2 have been proposed.5,6 Catalytic decomposition of H2O2 involves adsorption of H2O2 onto the UO2 surface, followed by surface-catalyzed splitting of the O–O peroxide bond according to reactions (1)–(3), whilst the second decomposition pathway is via an oxidative decomposition mechanism according to reaction (4):
| UO2 + 1/2H2O2 → UO2 − (˙OH)ads | (1) |
| UO2 − (˙OH)ads + H2O2 → UO2 + HO2 + H2O | (2) |
| 2(HO2˙) → H2O2 + O2 | (3) |
| UO2 − (˙OH)ads → UO2+ + OH− | (4) |
Typically, bicarbonate (HCO3−) is found in groundwater at various concentrations depending on repository location (∼10−4 to ∼10−2 M).7–10 Bicarbonate forms complexes with oxidised U and promotes dissolution via stabilisation of the dissolution products:
| U(VI)(CO3)ads + HCO3− → (U(VI)O2(CO3)2)2− + H+ | (5) |
Due to the importance of understanding U dissolution for the development of predictive models for radionuclide release, previous studies have investigated the dissolution of U under simulated groundwater conditions. Such studies on the oxidative dissolution of U include the effects of: the form of U,11,12 the radiolytic oxidant,3,13–17 groundwater bicarbonate concentrations,18–20 and redox conditions.5,21–23 Radionuclide release into the local environment via groundwater requires damage to the storage canister in order for groundwater to contact the spent fuel. Therefore, the role of FeII ions generated by canister corrosion on spent fuel dissolution have also been studied,24–26 showing that FeII and its corrosion products react with H2O2 in solution reducing the dissolution of spent fuel. Under geological disposal conditions, H2 will be generated by radiolysis and by the anoxic oxidation of canister materials, and the effect of H2 on spent fuel dissolution has been shown to have a suppressive effect on dissolution under various conditions.21,27–31 Differences in dissolution from SIMFUEL and pure UO2 have also been observed due to a greater fraction of H2O2 dissociation on SIMFUEL caused by differences in surface redox activity.6 Epsilon particles of spent fuel have also been shown to affect dissolution by acting as catalytic sites for H2 oxidation, as well as the reaction of H2 with H2O2.24,31
An important variable that has not yet been sufficiently investigated is the effect of temperature. Temperatures in a repository are expected to be <100 °C throughout the storage lifetime, and will decrease over time as the decay heat generated from radionuclides decreases. There are multiple variables that will determine the temperature profile of a repository with time, including spent fuel burn up, thermal conductivity of bedrock, as well as buffer layer material and thickness to name a few. Recent studies have shown that the temperature at the waste canister surface may be ∼20–30 °C after 10![[thin space (1/6-em)]](https://www.rsc.org/images/entities/char_2009.gif) 000 years of storage.32,33 Therefore, depending on the storage conditions and the time of storage container failure, temperatures in the repository will vary. Studies on the temperature effect on spent fuel dissolution under repository conditions have shown that an increase in temperature reduces dissolution under a H2 atmosphere due to increased uranyl reduction,34 whilst dissolution increases with temperature in O2 atmospheres.35,36 The reported activation energy range for spent fuel dissolution gives values between 15–80 kJ mol−1 for the overall oxidative dissolution process.35–39 However, there is still a lack of knowledge regarding the temperature effect on the mechanism of H2O2 decomposition on UO2.
000 years of storage.32,33 Therefore, depending on the storage conditions and the time of storage container failure, temperatures in the repository will vary. Studies on the temperature effect on spent fuel dissolution under repository conditions have shown that an increase in temperature reduces dissolution under a H2 atmosphere due to increased uranyl reduction,34 whilst dissolution increases with temperature in O2 atmospheres.35,36 The reported activation energy range for spent fuel dissolution gives values between 15–80 kJ mol−1 for the overall oxidative dissolution process.35–39 However, there is still a lack of knowledge regarding the temperature effect on the mechanism of H2O2 decomposition on UO2.
With the aim of being able to accurately predict the dissolution behaviour of UO2 at the time of container failure, we have studied U dissolution from UO2/sodium bicarbonate (NaHCO3) suspensions upon H2O2 addition at 4 bicarbonate concentrations (0.1, 1, 10 and 50 mM) and 4 temperatures (10, 25, 45, and 60 °C). The kinetics and mechanism of H2O2 decomposition at the UO2 surface was analysed as a function of bicarbonate concentration and temperature by monitoring the decomposition of H2O2 and dissolution of U.
Experimental
Materials
Dissolution experiments were conducted using UO2 powder. The UO2 powder was prepared by reduction of U3O8 powder under a 10%H2![[thin space (1/6-em)]](https://www.rsc.org/images/entities/char_2009.gif) :
:![[thin space (1/6-em)]](https://www.rsc.org/images/entities/char_2009.gif) Ar atmosphere at 1000 °C for 6 hours. The powder was then stored in a flame-sealed glass vial until use to minimize any oxidation of the surface. The structure of the UO2 powder was confirmed by XRD according to the procedure previously described in ref. 12. An average crystallite size of 62 nm was obtained, with a cubic lattice constant of 5.46 Å which is consistent with published data for UO2.40,41 The specific surface area of the powder was measured using the Brunauer–Emmett–Teller method of Kr gas surface adsorption/desorption with a Micromeritics Tristar II instrument giving a surface area of 0.67 ± 0.05 m2 g−1.
Ar atmosphere at 1000 °C for 6 hours. The powder was then stored in a flame-sealed glass vial until use to minimize any oxidation of the surface. The structure of the UO2 powder was confirmed by XRD according to the procedure previously described in ref. 12. An average crystallite size of 62 nm was obtained, with a cubic lattice constant of 5.46 Å which is consistent with published data for UO2.40,41 The specific surface area of the powder was measured using the Brunauer–Emmett–Teller method of Kr gas surface adsorption/desorption with a Micromeritics Tristar II instrument giving a surface area of 0.67 ± 0.05 m2 g−1.
Dissolution experiments
The dissolution of UO2 by reaction with H2O2 (Fujifilm Wako Pure Chemical, 30%) in NaHCO3 (Alfa Aesar) solution was conducted by monitoring the concentrations of U and H2O2 over the reaction time. It should be noted that irradiation conditions were simulated by the use of commercial H2O2 which may affect the dissolution compared to H2O2 generated by radiolysis under deep geological disposal conditions. Suspensions of UO2 powder (50 mg) in NaHCO3 (70 ml) at different concentrations (0.1, 1, 10 and 50 mM) were prepared in a reaction cell, and pH and ORP values of solution through the experiments are provided in ESI.† To emulate the anoxic conditions of groundwater, the suspensions were purged with Ar for approximately 18 hours prior to the experiment, and purging was continued during the experiment to ensure absence of O2. The stability of the system through the dissolution experiments was confirmed by monitoring dissolved U concentrations over the reaction time without H2O2 addition under select conditions (Fig. S2†). To initiate the reaction, 300 μM H2O2 was added to the suspension as this concentration has been shown to be optimal for studying H2O2 induced dissolution with UO2.11 The temperature within the cell was controlled with a water coolant system to maintain constant temperatures throughout the dissolution experiments. Dissolution experiments were conducted at 10 °C, 25 °C, 45 °C and 60 °C. At intervals during the reaction, samples (∼2 ml) were extracted from the reaction cell and filtered through a 0.45 μm filter to stop the reaction. The filtrate was then tested for U and H2O2 concentrations as described below. The error in the dissolution experiment methodology was analysed by taking the standard deviation of the calculated H2O2 pseudo-first order decay constants for H2O2 decomposition for a dissolution experiment done in triplicate, giving an estimated error of <10%.Analytical techniques
U concentrations were measured by ICP-OES with a PerkinElmer Avio-200 spectrometer, where calibration was conducted using appropriate U standards. Measurements were done in triplicate with standard deviations typically being <2% of the measured values.To measure H2O2 concentrations, the Ghormley triiodide method was used where H2O2 reacts with the iodide ion (I−) which is converted to the triiodide ion (I3−) using ammonium heptamolybdate ((NH4)6Mo7O24) and the acidic buffer potassium hydrogen phthalate (KHC8H4O4).42,43 The absorbance peak of I3− at 350 nm was measured using a Shimadzu UV-3600 Plus UV-Vis-NIR spectrophotometer to determine the concentration of H2O2.
Results and discussion
H2O2 stability in bicarbonate solution
To investigate the decomposition of H2O2 at the UO2 surface, it is first necessary to assess the stability of H2O2 in bicarbonate solution with temperature without UO2 as shown in Fig. 1. At concentrations ≥1 mM there was little effect of the bicarbonate concentration on H2O2 decomposition. However, at 0.1 mM the decomposition occurred more quickly at each temperature. This suggests complex formation between the H2O2 and bicarbonate in solution which inhibited H2O2 decomposition. In 0.1 mM bicarbonate, the concentration was lower than the added H2O2 (300 μM) meaning any stabilisation effect from complexation was lost and H2O2 decomposed at a faster rate. The H2O2 decomposition increased with temperature as expected. Further discussions about the kinetics of H2O2 decomposition on UO2 include a background correction for the stability of H2O2 in bicarbonate solution with temperature.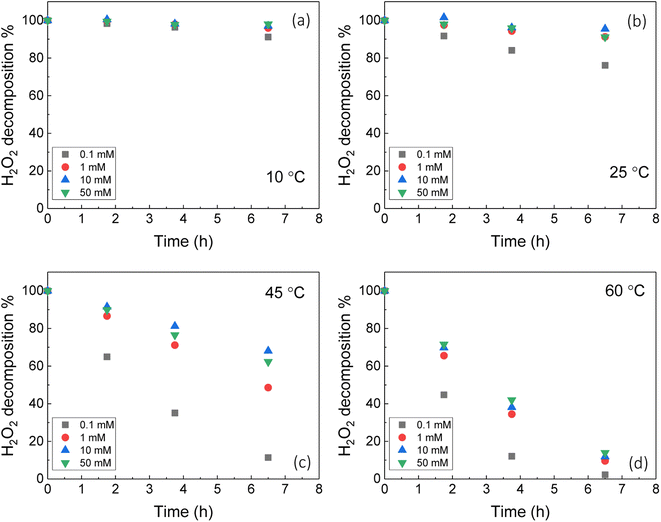 | ||
| Fig. 1 The stability of H2O2 in bicarbonate solution as a function of temperature (initial concentration 300 μM H2O2). | ||
U dissolution
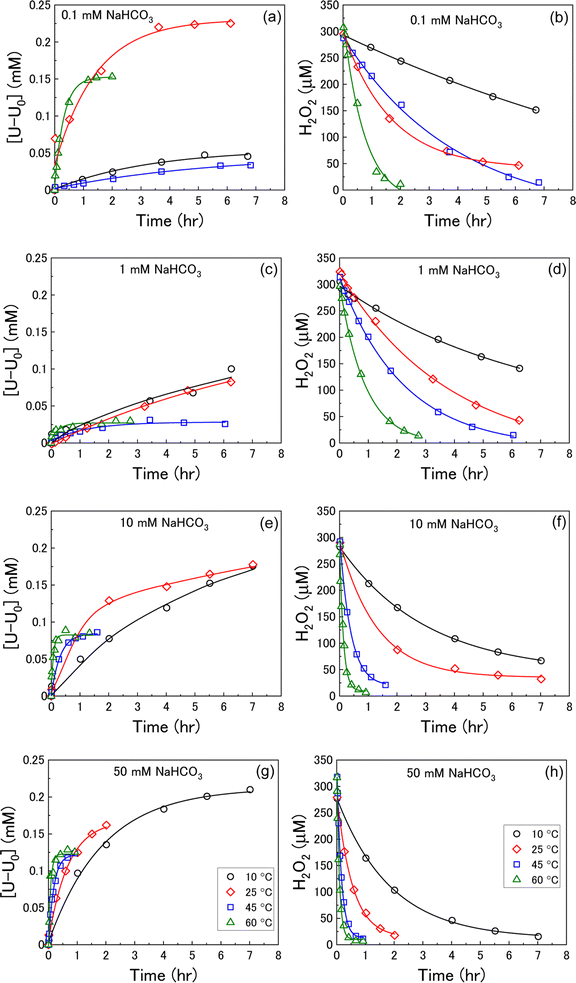
U dissolution from UO2 as a function of temperature was investigated by measuring the concentration of dissolved U over the reaction time after addition of H2O2 at various bicarbonate concentrations. The measured U dissolution is shown in Fig. 2(a), (c), (e) and (g), where dissolution is given by the measured dissolved U minus the concentration of dissolved U prior to H2O2 addition (U0). The reaction temperature had a significant effect on U dissolution from UO2 at each bicarbonate concentration.At bicarbonate concentrations ≥1 mM, correlations between temperature and dissolution were observed indicating that dissolution is controlled by the formation of U-bicarbonate surface complexes. The first observation is that the initial rate of U dissolution increased with temperature at each bicarbonate concentration. The dissolution rate increase with temperature can be attributed to increased collisions of H2O2 with the surface leading to higher numbers of oxidative dissolution reactions and subsequent U dissolution. The dissolution rate also increased with bicarbonate at each temperature due to favourable complexation with bicarbonate as described in eqn (6)–(8). The second observation is that the U concentration decreased with increasing temperature. At 45 °C and 60 °C, the dissolved U concentration become constant and the stable value of U could be observed. At 10 °C and 25 °C, the dissolution was slower and the H2O2 decomposition experiment finished before the stable value of U could be obtained. However, extrapolation of these dissolution profiles indicated that U decreased with increasing temperature. At 0.1 mM bicarbonate, no obvious relationship between temperature and U dissolution was observed. This means that the concentration of bicarbonate is sufficiently low that U-bicarbonate species at the surface do not control dissolution. As the concentration of U exceeds that of bicarbonate, the dissolved uranium is likely in the hydroxide form ((UO2)m(OH)n(2m−n)+) or a mixture of hydroxide and bicarbonate (i.e. (UO2)2CO3(OH)3−).
Equilibrium calculation for the UVI/bicarbonate system
To investigate the species distribution in the UVI/bicarbonate system, thermodynamic calculations were conducted at each experimental temperature. Stability constants were derived using the DQUANT equation derived by Helgeson44 which assumes that the temperature dependence of the heat capacity of a dissociation reaction and the temperature dependence of the electrostatic contribution are proportional:
 | (6) |
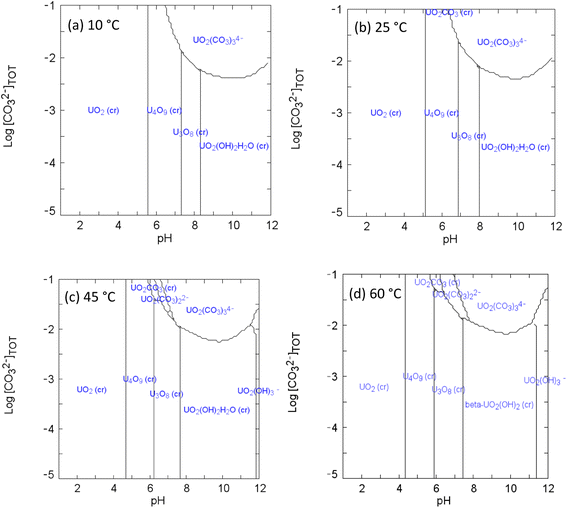 | ||
| Fig. 3 Speciation diagrams of UVI and bicarbonate at (a) 10 °C (b) 25 °C (c) 45 °C (d) 60 °C: [UVI]tot = 1 × 10⁻³ M; I = 1 × 10⁻³; Eh = +150 mV. | ||
H2O2 decomposition kinetics and mechanism
The dissolution of U was induced by the addition of H2O2 to the UO2/bicarbonate suspension. Therefore, the decomposition of H2O2 over the course of the reaction was studied to investigate the observed dissolution behaviour. The decomposition of H2O2 over time as a function of temperature for different bicarbonate concentrations is shown in Fig. 2(b), (d), (f) and (h). A clear effect of temperature on H2O2 was found, where the rate of H2O2 decomposition increased with temperature at all concentrations of bicarbonate.To further investigate decomposition of H2O2 at the UO2 surface, the kinetics of decomposition were analysed. Decomposition in the presence of uranium oxides has been shown to follow pseudo-first order kinetics defined by the rate equation:48
 | (7) |
Therefore, the pseudo-first order rate constant, k, can be obtained from the gradient of a plot of ln[H2O2] vs. time (plots are provided in supplementary information†). The calculated values of k were in the range 0.5 to 63 × 10−3 s−1 m−2. A previous study by the authors12 investigating U dissolution from U3O8 in bicarbonate solution at 25 °C showed measured k values between 0.7 and 2.7 × 10⁻⁴ s−1 m−2, indicating that H2O2 decomposition is slower on more oxidised forms of U. This effect is likely to be due to the abundance of UIV in UO2 relative to U3O8 facilitating the oxidative decomposition of H2O2 at the surface via eqn (4) and (5). The calculated pseudo-first order rate constants are plotted in Fig. 4 as a function of bicarbonate at different temperatures. The value of k increased with temperature for each bicarbonate concentration.
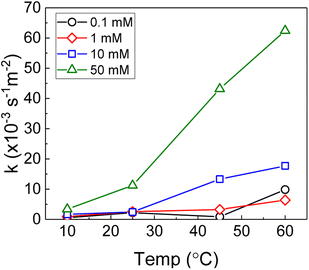 | ||
| Fig. 4 The background corrected pseudo-first order rate constants for H2O2 decomposition on UO2 as a function of temperature in 0.1 mM, 1 mM, 10 mM and 50 mM bicarbonate solution. | ||
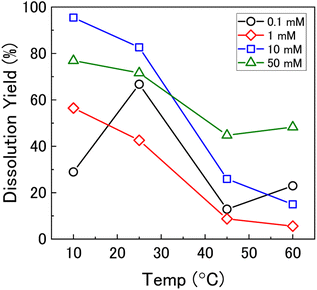
To investigate the mechanism of H2O2 decomposition further, the contribution of catalytic and oxidative decomposition can be analysed using the dissolution yield. The dissolution yield is defined as the amount of UVI dissolved from the UO2 surface per H2O2 decomposition event at the surface during the reaction, and provides a convenient method to analyse the ratio of catalytic and oxidative decomposition under differing experimental conditions. The dissolution yield was calculated from the final yield at the end of each dissolution experiment as the system was stable at this point (Fig. S6†). The calculated dissolution yields are shown in Fig. 5. At bicarbonate concentrations ≥1 mM, an obvious decrease in the dissolution yield can be seen as temperature increased. This decrease indicated that the H2O2 decomposition mechanism transitions from oxidative decomposition to catalytic decomposition with temperature. The irregularity of the dissolution yield at 0.1 mM bicarbonate shows that the ratio of oxidative to catalytic decomposition is affected by temperature but has no clear relationship.
Arrhenius plots for H2O2 decomposition
The dependence of the rate constant on temperature generally follows the Arrhenius equation:
 | (8) |
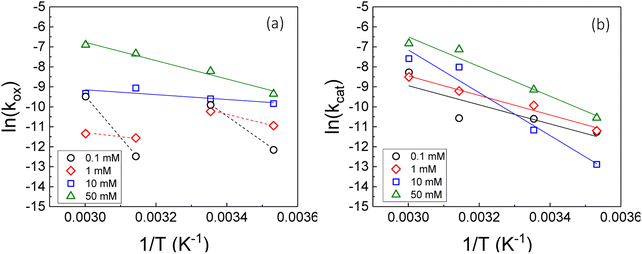
Therefore, the gradient of a ln(k) vs. 1/T plot yields the activation energy for a reaction, Ea. From Fig. 5, the oxidative and catalytic contributions to H2O2 decomposition could be obtained (i.e. a dissolution yield of 60% indicates 60% oxidative and 40% catalytic H2O2 decomposition). Using this ratio, the values of the pseudo-first order rate constants for oxidative, kox, and catalytic, kcat, decomposition were calculated from the overall rate constant, k, shown in Fig. 4. The Arrhenius plots for kox and kcat are shown in Fig. 6 and the corresponding values of Ea are provided in Table 1.
| NaHCO3 (mM) | Oxidative decomposition Ea (kJ mol−1) | Catalytic decomposition Ea (kJ mol−1) |
|---|---|---|
| 0.1 | — | 40 ± 5.5 |
| 1 | — | 41 ± 1.6 |
| 10 | 10 ± 1.0 | 89 ± 5.6 |
| 50 | 38 ± 1.9 | 62 ± 3.9 |
For oxidative decomposition of H2O2 on UO2 in 10 mM and 50 mM solution, Arrhenius behaviour was observed. Yet, in ≤1 mM bicarbonate solution, the reaction did not follow Arrhenius behaviour. This indicated a significant effect of temperature on the UO2 surface chemistry in ≤1 mM bicarbonate solution, and the resulting H2O2 decomposition mechanism. For catalytic decomposition, Arrhenius behaviour was observed at all concentrations of bicarbonate. Therefore, any changes to the surface caused by temperature did not significantly affect the catalytic reaction mechanism, and the decomposition of H2O2 via eqn (1)–(3) is dependent on the probability of H2O2 colliding with surface U rather than the form of U. This suggests that catalysis by UO2 (UIV) and U-bicarbonate (UVI) may occur via the same mechanism as the surface chemistry change that affected the oxidative decomposition mechanism did not affect the catalytic mechanism. The measured values of Ea are comparable with the literature data for the overall dissolution reaction as discussed above. A study by de Pablo et al.49 focused on the individual surface reactions and found Ea values for UO2 oxidation between 30–80 kJ mol−1. To the author's knowledge, the Ea values provided are the first for the oxidative and catalytic H2O2 decomposition reactions on UO2 in simulated geological disposal conditions. The larger Ea values for catalytic decomposition of H2O2 at the UO2 surface suggests that the reaction of the surface adsorbed hydroxyl radical with H2O2 requires more energy than the oxidation of UVI to UV.
Effect of temperature on U dissolution
Based on the calculated dissolution yields, a pathway for U dissolution from UO2 in bicarbonate solution as a function of temperature can be proposed, and is summarised in Fig. 7. Upon addition of H2O2, the initial oxidative decomposition of H2O2 occurs on the bare UO2, and UVI is generated on the surface which complexes with bicarbonate from solution. These UVI species are expected to be in equilibrium with soluble UO2(CO3)n2−2n, with continuous dissolution of surface UVI species and reprecipitation leading to a transient oxide surface. Otherwise, the formation of a stable surface layer would protect the underlying UO2 from oxidative decomposition of H2O2, and dissolution of U would be inhibited. Raman analysis of the surface oxide after the dissolution experiments showed no alteration to the surface, further indicating a transient oxide surface.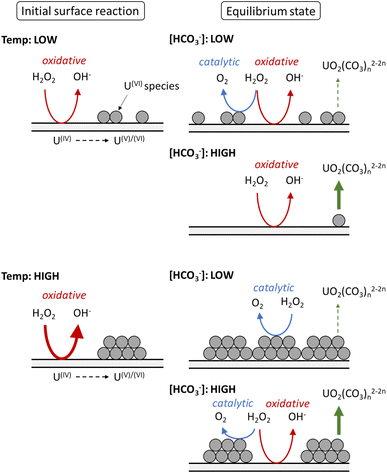 | ||
| Fig. 7 The proposed effect of temperature on the decomposition of H2O2 at the UO2 surface in bicarbonate solution. | ||
At low temperature, the rate of the initial oxidative decomposition is low, and so the formation of UVI species at the surface proceeds slowly. At low bicarbonate concentrations, the dissolution of the UVI species into solution is also slow, and so the UVI species at the surface partially block the underlying UIV surface. This enables H2O2 decomposition via both catalytic and oxidative pathways. When the bicarbonate concentration is high, the rate of UVI dissolution is high and the surface of the UO2 is exposed to oxidative H2O2 decomposition, and the dissolution yield increases.
At high temperature, the initial surface oxidation reaction proceeds faster than at low temperature, which is evidenced by the higher initial rate of U dissolution in Fig. 2. The increase in UIV oxidation leads to the formation of more UVI species and a larger surface coverage. At low bicarbonate concentrations, these species cover the surface of the UO2 due to the low rate of UVI dissolution, and the H2O2 decomposition mechanism is mainly catalytic. This change in the surface composition may explain the non-Arrhenius behaviour at low bicarbonate concentration shown in Fig. 6, as oxidative decomposition at the UO2 surface at higher temperature becomes restricted. With an increase in bicarbonate concentration, the dissolution rate increases leaving parts of the UO2 surface exposed, and both catalytic and oxidative H2O2 decomposition proceeds.
Conclusion
The decomposition of H2O2 at the UO2 surface in bicarbonate solution as a function of temperature has been investigated, and a pathway to explain the temperature effect has been proposed. U dissolution was controlled by surface U-bicarbonate species. The initial rate of dissolution increased with temperature due to increased collisions of H2O2 with the surface. The concentration of dissolved U showed an inverse relationship with temperature which was attributed to a transition from oxidative to catalytic H2O2 decomposition at the UO2 surface with increasing temperature. This transition was ascribed to an increased rate of UVI-bicarbonate formation at the surface, protecting the underlying UO2 and reducing the rate of oxidative decomposition of H2O2. The catalytic decomposition of H2O2 proceeded seemingly independently of the nature of the U species at the oxide surface. In 0.1 mM bicarbonate solution, a clear relationship between dissolution and temperature was not observed which was attributed to the formation of both bicarbonate and hydroxide surface species in the bicarbonate deficient system.Conflicts of interest
There are no conflicts of interest to declare.Acknowledgements
This project was conducted as part of the Japan Atomic Energy Agency (JAEA) postdoctoral fellow research program. The authors would like to thank Miyuki Shimojuku for their assistance in conducting experiments.References
- S. J. Romaniello, A. D. Herrmann and A. D. Anbar, Chem. Geol., 2013, 362, 305–316, DOI:10.1016/j.chemgeo.2013.10.002
.
- N. E. Jemison, A. E. Shiel, T. M. Johnson, C. C. Lundstrom, P. E. Long and K. H. Williams, Environ. Sci. Technol., 2018, 52, 3422–3430, DOI:10.1021/acs.est.7b05162
.
- S. Sunder, N. H. Miller and D. W. Shoesmith, Corros. Sci., 2004, 46, 1095–1111, DOI:10.1016/j.corsci.2003.09.005
.
- J. S. Goldik, J. J. Noël and D. W. Shoesmith, J. Electroanal. Chem., 2005, 582, 241–248, DOI:10.1016/j.jelechem.2004.11.007
.
- L. Wu and D. W. Shoesmith, Electrochim. Acta, 2014, 137, 83–90, DOI:10.1016/j.electacta.2014.06.002
.
- L. Bauhn, N. Hansson, C. Ekberg, P. Fors and K. Spahiu, J. Nucl. Mater., 2018, 507, 38–43, DOI:10.1016/j.jnucmat.2018.04.028
.
- K. Fukuda, Y. Watanabe, H. Murakami, Y. Amano, D. Aosai, Y. Kumamoto and T. Iwatsuki, Hydrochemical Investigation at the Mizunami Underground Research Laboratory-Compilation of Groundwater Chemistry Data in the Mizunami Group and the Toki Granite, 2020, doi: DOI:10.11484/jaea-data-code-2019-019
.
- B. Y. Kim, J. Y. Oh, M. H. Baik and J. I. Yun, Nucl. Eng. Technol., 2010, 42, 552–561, DOI:10.5516/NET.2010.42.5.552
.
- S. S. Kim, M. H. Baik, J. W. Choi, H. S. Shin and J. I. Yun, J. Radioanal. Nucl. Chem., 2010, 286, 91–97, DOI:10.1007/s10967-010-0614-5
.
- L. F. Auque, M. J. Gimeno and J. B. Gomez, Groundwater chemistry around a repository for spent nuclear fuel over a glacial cycle, 2006 Search PubMed
.
- Y. Kumagai, A. Barreiro Fidalgo and M. Jonsson, J. Phys. Chem. C, 2019, 123, 9919–9925, DOI:10.1021/acs.jpcc.9b00862
.
- J. McGrady, Y. Kumagai, M. Watanabe, A. Kirishima, D. Akiyama, A. Kitamura and S. Kimuro, RSC Adv., 2021, 11, 28940–28948, 10.1039/d1ra05580a
.
- W. H. Hocking, J. S. Betteridge and D. W. Shoesmith, J. Electroanal. Chem., 1994, 379, 339–351, DOI:10.1016/0022-0728(94)87156-6
.
- D. W. Shoesmith and S. Sunder, J. Nucl. Mater., 1992, 190, 20–35, DOI:10.1016/0022-3115(92)90072-S
.
- A. C. Maier, P. Kegler, M. Klinlenberg, A. Baena, S. Finkeldei, F. Brandt and M. Jonsson, Dalton Trans., 2020, 49, 1241–1248, 10.1039/c9dt04395k
.
- S. Nilsson and M. Jonsson, J. Nucl. Mater., 2011, 410, 89–93, DOI:10.1016/j.jnucmat.2011.01.020
.
- E. Ekeroth and M. Jonsson, J. Nucl. Mater., 2003, 322, 242–248, DOI:10.1016/j.jnucmat.2003.07.001
.
- M. M. Hossain, E. Ekeroth and M. Jonsson, J. Nucl. Mater., 2006, 358, 202–208, DOI:10.1016/j.jnucmat.2006.07.008
.
- I. Casas, J. de Pablo, F. Clarens, J. Giminez, J. Merino, J. Bruno and A. Martinez-Esparza, Radiochim. Acta, 2009, 97, 485–490, DOI:10.1524/ract.2009.1641
.
- D. Y. Chung, H. S. Seo, J. W. Lee, H. B. Yang, E. H. Lee and K. W. Kim, J. Radioanal. Nucl. Chem., 2010, 284, 123–129, DOI:10.1007/s10967-009-0443-6
.
- S. Röllin, K. Spahiu and U. B. Eklund, J. Nucl. Mater., 2001, 297, 231–243, DOI:10.1016/S0022-3115(01)00645-6
.
- Z. Zhu, J. J. Noël and D. W. Shoesmith, Electrochim. Acta, 2020, 340, 125980, DOI:10.1016/j.electacta.2020.135980
.
- J. S. Goldik, H. W. Nesbitt, J. J. Noël and D. W. Shoesmith, Electrochim. Acta, 2004, 49, 1699–1709, DOI:10.1016/j.electacta.2003.11.029
.
- M. Jonsson, F. Nielsen, O. Roth, E. Ekeroth, S. Nilsson and M. M. Hossain, Environ. Sci. Technol., 2007, 41, 7087–7093, DOI:10.1021/es070832y
.
- W. D. Shoesmith, M. Kolar and F. King, Corrosion, 2003, 59, 802–816, DOI:10.5006/1.3277609
.
- L. De Windt, P. Goblet, V. Kerleguer and C. Jegou, DisCo: Modern spent fuel dissolution and chemistry in failed container conditions D5.7, 2021 Search PubMed
.
- K. Spahiu, U. B. Eklund, D. Cui and M. Lundström, Mater. Res. Soc. Symp. Proc., 2002, 713, 633–638 CrossRef CAS
.
- A. Loida, V. Metz, B. Kienzler and H. Geckeis, J. Nucl. Mater., 2005, 346, 24–31, DOI:10.1016/j.jnucmat.2005.05.020
.
- K. Spahiu, D. Cui and M. Lundström, Radiochim. Acta, 2004, 92, 625–629, DOI:10.1524/ract.92.9.625.54990
.
- P. Carbol, P. Fors, S. Van Winckel and K. Spahiu, J. Nucl. Mater., 2009, 392, 45–54, DOI:10.1016/j.jnucmat.2009.07.004
.
- M. E. Broczkowski, J. J. Noël and D. W. Shoesmith, J. Nucl. Mater., 2005, 346, 16–23, DOI:10.1016/j.jnucmat.2005.04.070
.
- Y. Xue, D. Sun and L. Wang, Ann. Nucl. Energy, 2021, 163, 108535, DOI:10.1016/j.anucene.2021.108535
.
- X. Zhou, A. Zhou, D. Sun and D. Sheng, Nucl. Technol., 2020, 207, 1–16, DOI:10.1080/00295450.2020.1756161
.
- E. Ekeroth, M. Granfors, D. Schild and K. Spahiu, J. Nucl. Mater., 2020, 531, 151981, DOI:10.1016/j.jnucmat.2019.151981
.
- W. J. Gray, H. R. Leider and S. A. Steward, Nucl. Mater., 1992, 190, 46–52, DOI:10.1016/0022-3115(92)90074-U
.
- G. F. Thomas and G. Till, Nucl. Chem. Waste Manage., 1984, 5, 141–147, DOI:10.1016/0191-815X(84)90044-5
.
- D. E. Grandstaff, Econ. Geol., 1976, 71, 1493–1506, DOI:10.2113/gsecongeo.71.8.1493
.
- B. J. Hiskey, Trans. Inst. Min. Metall., Sect. C, 1979, 88, C145–C152 Search PubMed
.
- W. E. Schortmann and M. A. DeSesa, Proc. Second United Nation Int. Conf. Peac. Uses At. Energy, 1958, vol. 3, pp. 333–341 Search PubMed
.
- V. A. Alekseyev, L. A. Anan’yeva and R. P. Rafal’skiy, Int. Geol. Rev., 1981, 23, 1229–1236 CrossRef
.
- L. Lynds, W. A. Young, J. S. Mohl and G. G. Libowitz, 1963, 58–65, doi: DOI:10.1021/ba-1964-0039.ch005.
- A. O. Allen, C. J. Hochanadel, J. A. Ghormley and T. W. Davis, J. Phys. Chem., 1952, 56, 575–586, DOI:10.1021/j150497a007
.
- T. C. J. Overton and W. T. Rees, Analyst, 1950, 75, 204–208, DOI:10.1007/BF02637422
.
- H. C. Helgeson, J. Phys. Chem., 1967, 71, 3121–3136, DOI:10.1021/j100869a002
.
- I. Grenthe, A. V. Plyasunov, W. H. Runde, R. J. Konings, E. E. Moore, X. Gaona, L. Rao, B. Grambow and A. L. Smith, Second update on the chemical thermodynamics of uranium, neptunium, plutonium, americium and technicium, North Holland, Amsterdam, Holland, 2020 Search PubMed
.
- V. Eliet, I. Grenthe and G. Bidoglio, Appl. Spectrosc., 2000, 54, 99–105, DOI:10.1366/0003702001948
.
- D. D. Wagman, W. H. Evans, V. B. Parker, R. H. Schumm, I. Halow, S. M. Bailey, K. L. Churney and R. L. Nutall, J. Phys. Chem. Ref., 1982, 11 Search PubMed
.
- C. M. Lousada and M. Jonsson, J. Phys. Chem. C, 2010, 114, 11202–11208, DOI:10.1021/jp1028933
.
- J. De Pablo, I. Cases, J. Gimenez, M. Molera, M. Rovira, L. Duro and J. Bruno, Geochim. Cosmochim. Acta, 1999, 63, 3097–3103, DOI:10.1016/S0016-7037(99)00237-9
.
Footnotes |
| † Electronic supplementary information (ESI) available. See DOI: https://doi.org/10.1039/d2ra08131h |
| ‡ Current address: Kyoto Fusioneering Ltd., Otemachi Bldg, 5th Floor Inspired, Lab1-6-1 Otemachi, Chiyoda-ku, Tokyo 100-0004. |
| This journal is © The Royal Society of Chemistry 2023 |

