 Open Access Article
Silver-functionalized bismuth oxide (AgBi2O3) nanoparticles for the superior electrochemical detection of glucose, NO2− and H2O2†
M. Ramesha,
C. Sankar b,
S. Umamatheswari
 *a,
R. Ganapathi Raman
 c,
R. Jayaveld,
Dongjin Choi
 *e and
A. G. Ramue
aPG and Research Department of Chemistry, Government Arts College (Affiliated to Bharathidasan University), Tiruchirappalli, 620 022, Tamil Nadu, India. E-mail: drsumamatheswari@gmail.com; Tel: +91-8438288510
bDepartment of Chemistry, SRM TRP Engineering College, Tiruchirappalli, 621 105, Tamil Nadu, India
cDepartment of Physics, Saveetha Engineering College, Thandalam, Chennai-602 105, India
dCentre for Nanoscience and Technology, Anna University, Chennai, 600025, Tamil Nadu, India
eDepartment of Materials Science and Engineering, Hongik University, 2639-Sejong-ro, Jochiwon-eup, Sejong-City, 30016, South Korea. E-mail: djchoi@hongik.ac.kr; Tel: +82-1094126765
First published on 11th July 2023
Abstract
In this study, silver-functionalized bismuth oxide (AgBi2O3) nanoparticles (SBO NPs) were successfully synthesized by a highly efficient hydrothermal method. The as-synthesized SBO nanoparticles were characterized using FT-IR, P-XRD, XPS, HR-SEM, and HR-TEM analytical methods. It was found that the NPs were in spherical shape and hexagonal crystal phase. The newly prepared SBO electrode was further utilized for the detection of glucose, NO2− and H2O2 by cyclic voltammetry (CV) and amperometric methods. The electrodes exhibited high sensitivity (2.153 μA mM−1 cm−2 for glucose, 22 μA mM−1 cm−2 for NO2− and 1.72 μA mM−1 cm−2 for H2O2), low LOD (0.87 μM for glucose, 2.8 μM for NO2− and 1.15 μM for H2O2) and quick response time (3 s for glucose, 2 s for both NO2− and H2O2 respectively). The sensor exhibited outstanding selectivity despite the presence of various interferences. The developed sensor exhibited good repeatability, reproducibility, and stability. In addition, the sensor was used to measure glucose, H2O2 in human serum, and NO2− in milk and river water samples, demonstrating its potential for use in the real sample.
1. Introduction
Diabetes mellitus, often known as type 2 or adult-onset diabetes, is a metabolic disorder that results in persistently high blood sugar levels. It develops when the body either fails to produce enough insulin or its use is inefficient.1 Untreated diabetes can affect pregnancy and cause additional health issues such as neuropathy, hypertension, stroke, nephropathy,2 hyperosmolar hyperglycemia, nonketotic syndrome,3 blindness,3 gastroparesis,3 heart failure4 and mental health issues.5 The ability to determine glucose concentration is essential in the healthcare industry because it leads to the diagnosis and treatment of diabetes mellitus. Biosensors have made an extensive contribution to clinical glucose observation.Nitrite (NO2−) is a strong, effective oxidizing agent, which is widely used as a food preservative and coloring agent in food processing,6 dyeing and chemical fertilizers.7 An excessive amount of nitrite in the blood inhibits the body's oxygen transport and increases the irreversible oxidation of hemoglobin. It produces the harmful substance methemoglobin by the reaction of amine and nitrites, which causes health issues such as blue-baby syndrome in babies,8,9 stomach cancer and tissue hypoxia.10 According to WHO, the permissible amount of NO2− in potable water is 0.1 mg L−1.11 Hence, it is indispensable to the improvement of swift and effective detection of NO2− in food and water samples.
Similarly, hydrogen peroxide (H2O2) is generally used in food processing, preservation,12 clinical care,13 environmental monitoring and chemical manufacturing industries because of its excellent chemical oxidation, reduction (redox) and microbial controlling capacities.13 It is frequently utilized as a green oxidant in contact lens solutions, antiseptic additives, and household detergent disinfectants. However, excessive consumption of H2O2 is highly risky for both environmental safety and human health.14,15 As a result, a quick, suitable, precise and cost-effective sensing technique is needed to measure the glucose, nitrite, and H2O2 levels, with practical implications for ecological safety, medical diagnosis, and food protection.
Several existing analytical techniques such as spectrophotometry,16 colorimetry,17 chemiluminescence,18 fluorescence19 and HPLC20 were used to detect the glucose, NO2− and H2O2 levels in various samples. However, these techniques suffer from high cost, complex pretreatment, low sensitivity and long detection time, which limit the probability of rapid determination in real samples. Therefore, there is an urgent need to develop a low-cost, highly sensitive and user-friendly analytical method. Conversely, the electrochemical method has attracted much more attention due to its attractive features such as certainty, fast response, good repeatability, high sensitivity and selectivity.21–23 In recent years, a variety of nanomaterials such as polymers, non-metals, metals and their metal oxides have been used for the enhancement of electrochemical sensing devices.24,25 Particularly, metals and metal oxides have attracted widespread research attention because of their high earth abundance, harmlessness, inexpensiveness, better redox behaviour, high surface area and enhanced electrocatalytic properties for a variety of electrochemical applications such as energy storage and conversion devices and sensors.26,27
In this context, bismuth oxide (Bi2O3) is an important n-type semiconductor with a large band gap of 2.85 eV and employed in a variety of applications including photovoltaic cells, sensors, and energy storage devices.28,29 However, very few studies have been reported on the synthesis and investigations of Bi2O3 NPs on sensor applications.30–34 In addition, these types of electrodes did not reach the required detection limit, working range, or durability due to their innately weak electrical conductivity and inadequate electrocatalysis of Bi2O3. Consequently, some strategic methods have been proposed to enhance the catalytic activity of Bi2O3. When using metal oxides with noble metals such as Au, Ag, and Pt, metal/metal oxide hybrids35,36 seem to provide significant improvements in glucose sensing performance.
Silver is an economic noble metal that has outstanding catalytic activity and excellent electron transfer efficiency.37–39 Ag nanostructures including nanoparticles and nanotubes are used to construct electrochemical sensors for the ultrasensitive detection of hydrogen peroxide,40,41 proteins,42 lactose,43 and glucose.44
It is widely known that doping one metal with another metal oxide (Bi2O3) can have synergistic effects, and it would be expected to enhance the electrochemical performance by lowering charge transfer resistance and providing more reactive sites when compared to pure Bi2O3. Furthermore, to the best of our knowledge, there has been no report in the literature on the fabrication of AgBi2O3 and its application in electrochemical sensing until now.
Based on the above-mentioned observations and on our current research, we propose a simple, scalable, and one-step method for the synthesis of Ag-functionalized Bi2O3 (SBO) via a hydrothermal process and successfully utilize the same for the first time as a tri-functional electrode in glucose, NO2− and H2O2 detections. The morphology and structures of as-prepared SBO NPs were determined by XRD, XPS, HR-SEM, and HR-TEM. The constructed non-enzymatic sensor exhibits high sensitivity, low detection limit (LOD), a wide linear range and good feasibility in the detection of glucose, NO2− and H2O2. Our study reveals that the SBO NPs hold excellent electrocatalytic sensing properties to glucose, NO2− and H2O2 detections in both lab and real samples. Real-time detection and quantification of glucose, NO2− and H2O2 in human serum, milk, and water samples are established using SBO NPs. The present work also envisaged low-level detection of glucose (0.87 μM), which is significantly lower than that of the previously reported Bi2O3-based glucose sensor.
2. Experimental
2.1. Materials and methods
Bismuth nitrate (Bi(NO3)3·5H2O), sodium dodecyl benzene sulfonate (SDBS), silver nitrate (AgNO3), Nafion, glucose (C6H12O6), sodium nitrite (NaNO2−), and hydrogen peroxide (H2O2) were purchased from Sigma Aldrich, India. Borax solution, zinc acetate (CH3COOZn), urea (NH2CONH2), zinc sulphate (ZnSO4), sodium hydroxide (NaOH), sodium acetate (CH3COONa), sodium bicarbonate (NaHCO3), potassium hydroxide (KOH), dopamine (DA), uric acid (UA), ascorbic acid (AA), deionized water (DI), potassium chloride (KCl), and all other chemicals were purchased from SRL Pvt Lt., (India). The stock solutions were prepared in deionized water.2.2. Synthesis of AgBi2O3 nanoparticles
SBO NPs were synthesized according to the previous report with slight modifications.45 In brief, 0.2 M of Bi(NO3)3·5H2O and 0.05 M of AgNO3 were dissolved in 50 mL of deionized water and stirred in a magnetic stirrer for 45 minutes at room temperature. At the same time, 20 mL of 0.5 g SDBS solution was slowly added to the reaction mixture. Then, 4 M of NaOH solution was added dropwise into the solution mixture until the pH reached 10 under constant stirring. The reaction mixture was transformed into a 100 mL of Teflon coated autoclave, heated at 100 °C for 15 hours and allowed to cool room temperature. The resulting yellow precipitate was washed with DI water and ethanol mixture, and dried at 80 °C for 24 hours. The obtained NPs were placed in a muffle furnace, annealed at 500 °C for 4 hours, and finally, we got the pure SBO NPs.2.3. Electrode fabrication
Before use, the 3 mm diameter GCE was polished with 0.05 μM alumina and washed with an ethanol and water (1![[thin space (1/6-em)]](https://www.rsc.org/images/entities/char_2009.gif) :
:![[thin space (1/6-em)]](https://www.rsc.org/images/entities/char_2009.gif) 1) mixture. The electrode was subsequently dried in a hot air oven before use for nanocomposite deposition. The slurry was prepared by dispersing 5.0 mg of SBO NPs in 500 μL of ethanol and 10 μL of Nafion solution. The prepared slurry was sonicated for 1 hour. Finally, 10 μL of the freshly prepared slurry was put on the surface of the as-prepared electrode. Then, the modified electrode was dried for 15 minutes in a hot air oven at 40 °C and used for electrochemical analysis.
1) mixture. The electrode was subsequently dried in a hot air oven before use for nanocomposite deposition. The slurry was prepared by dispersing 5.0 mg of SBO NPs in 500 μL of ethanol and 10 μL of Nafion solution. The prepared slurry was sonicated for 1 hour. Finally, 10 μL of the freshly prepared slurry was put on the surface of the as-prepared electrode. Then, the modified electrode was dried for 15 minutes in a hot air oven at 40 °C and used for electrochemical analysis.
2.4. Electrochemical measurements
All the electrochemical measurements were carried out using an electrochemical workstation (CHI600E) in a standard three-electrode system. A glassy carbon electrode (GCE) was used as the working electrode, Ag/AgCl (in saturated KCl solution) as the reference electrode and a Pt wire as the counter electrode. All measurements were performed at ambient temperature (25 ± 1 °C) and all the potentials were referred to the Ag/AgCl reference electrode. All three electrodes were immersed 1 cm deep into the 0.1 M NaOH electrolyte. In cyclic voltammetry (CV), measurements were recorded in the applied potential range of −0.8 to 0.8 V (for glucose 0 to 0.8 V, for NO2− 0.1 to 0.9, and H2O2 0 to −0.8 V) at different scan ranges of 10–100 mV s−1.2.5. Characterization
Crystallographic data for the synthesized nanoparticles were investigated by powder X-ray diffraction (P-XRD). The P-XRD pattern of the SBO NPs was recorded using a BRUKER ECO D8 advance with Cu Kα radiations (λ = 0.15406 nm) at room temperature. The FT-IR spectrum of the synthesized nanoparticle (as pellets in KBr) was recorded using a IRTRACER-100 FT-IR spectrometer. The morphology of the synthesized NPs was investigated by high-resolution transmission electron microscopy (HR-TEM, JEOL, JEM-2100 plus, Japan) and high-resolution scanning electron microscopy (HR-SEM, Thermo Scientific, Apreos), with energy-dispersive spectroscopy (EDS) and mapping to elemental analysis. A Kratos Axis Ultra-DLD X-ray photoelectron spectrometer was utilised in order to carry out the X-ray photoelectron spectroscopic (XPS) investigations.3. Results and discussion
3.1. Synthesis and characterization of SBO NPs
The proposed non-enzymatic sensor was designed based on the SBO–GCE. SBO NPs were synthesized by a one-pot, simple, and cost-efficient hydrothermal approach, as shown in Scheme 1. The synthesised SBO NPs were characterized by FT-IR spectroscopy, P-XRD, XPS, HR-SEM and HR-TEM.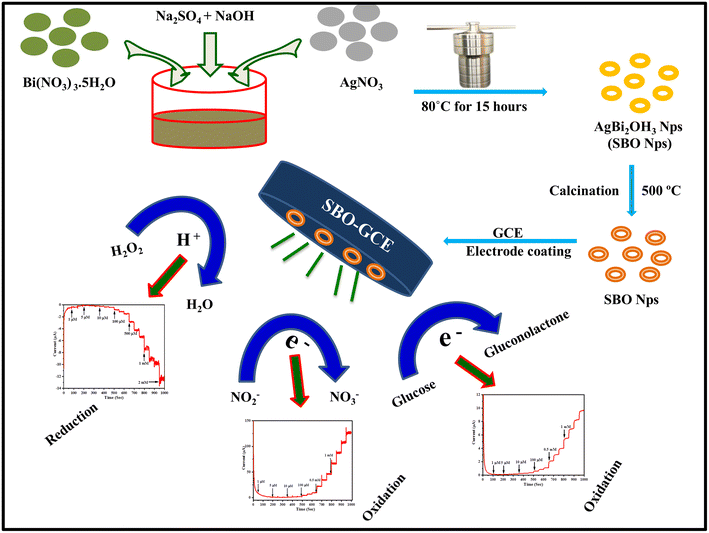 | ||
| Scheme 1 Schematic diagram for the synthesis and fabrication of the SBO–GC electrode and electrochemical applications. | ||
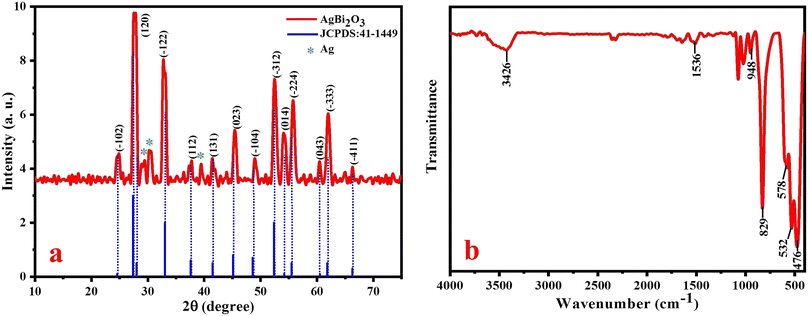
The crystallinity and crystal size of the prepared SBO NPs were identified by powder X-ray diffraction analysis, as shown in Fig. 1a. The diffraction peaks located at 2θ = 24.66, 27.42, 33.06, 37.59, 41.46, 45.11, 48.54, 52.41, 54.18, 55.51, 60.48, 61.82 and 66.24 were assigned to the crystal planes of Bi2O3 of (−102), (120), (−122), (112), etc. All these peaks are perfectly indexed to the (monoclinic system) crystal lattice with a P21c space group of Bi2O3 (JCPDS no.: 41-1449).32 The additional characteristic peaks that appeared at 2θ = 29.41, 30.30 and 39.48 are related to the Ag NPs. Therefore, this P-XRD pattern clearly reveals that Ag was successively doped with Bi2O3 to form AgBi2O3 NPs. The peaks at 27.42, 33.06, 45.11, 52.41 and 55.51 are more intense and sharp in nature, which indicate that the SBO NPs are very pure and in good crystalline nature. The average particle sizes of SBO NPs were observed in the range of 13 ± 4 nm. The observed XRD results confirmed the formation of AgBi2O3 nanocomposites.
The FT-IR spectrum of SBO NPs is shown in Fig. 1b, recorded in the range of 400–4000 cm−1. The characteristic bands observed between 400 and 600 cm−1 were assigned to the vibration bands of the Bi–O bond. The vibration band at 829 cm−1 is ascribed to the Bi–O–Bi band.33 The bands at 948 and 1536 cm−1 indicate the stretching vibration band of Ag NPs46 and the stretching vibration of the OH group in water molecules is appeared as a broad band at 3426 cm−1.
In order to ensure the formation of SBO NPs, the chemical state and composition of the SBO NPs were investigated by XPS. The obtained survey spectrum is given in Fig. 2a, specifying the presence of Ag, Bi and O species, and the elemental composition of the synthesized SBO NPs is Ag d5/2 (1.6%), Bi 4f7/2 (31.2%) and O 1s (67.2%). The XPS spectrum of Fig. 2b reveals that the double peaks including a lower energy bond at 367.94 eV and a higher energy bond at 373.96 eV could be assigned to Ag 3d5/2 and Ag 3d3/2. After thermal treatment of the SBO NPs, the coexistence of the reduction state Ag(0) and the oxidation state Ag(I) are 367.94 eV and 373.96 eV, respectively.47 In the Bi 4f core-level XPS spectrum, Fig. 2c shows two peaks with binding energy values of 160.8 eV (Bi 4f7/2) and 166.2 eV (Bi 4f5/2), which were attributable to the spin–orbit splitting of Bi3+ in the SBO NPs,48 whereas Fig. 2d exhibits the O 1s spectrum of the peaks observed at 530.09 and 532.12 eV, assigned to Bi–O and C–O respectively. Hence, the presence of Ag 3d5/2, Ag 3d3/2, Bi 4f7/2, Bi 4f5/2 and O 1s peaks confirmed the formation of SBO NPs.
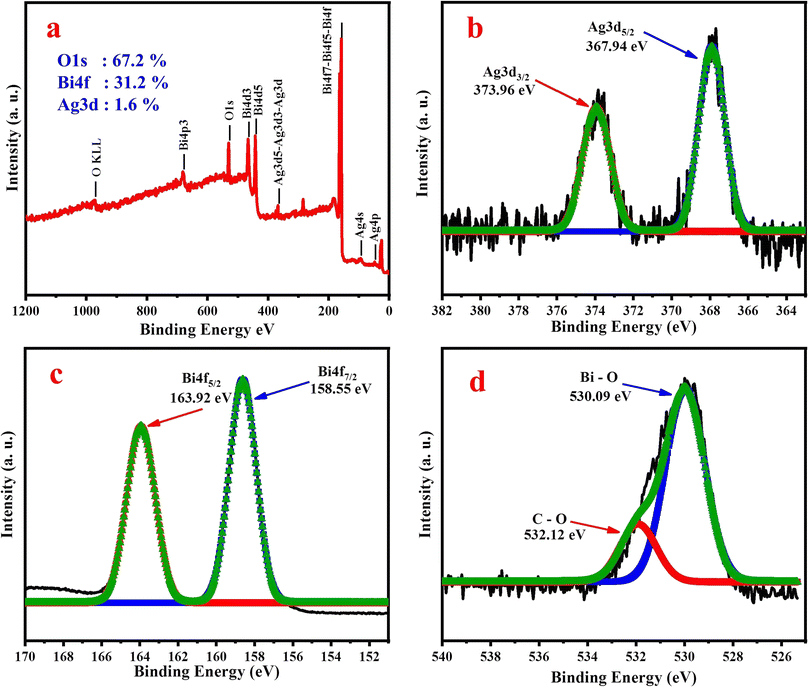 | ||
| Fig. 2 XPS spectrum of SBO NPs: (a) XPS survey spectrum, (b) XPS spectrum of Ag 3d, (c) XPS spectrum of Bi 4f, and (d) XPS spectrum of O 1s. | ||
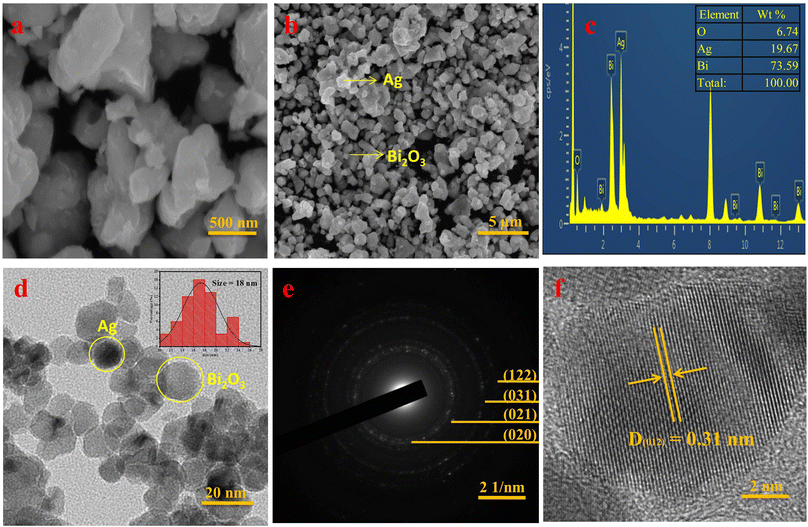
To explore the morphology of SBO NPs, HR-SEM images were recorded. The HR-SEM images displayed in Fig. 3a, b and S1a† shows the low-range magnification at 500 nm and high-range magnification at 5 μm and it reveals the maximum particles are spherical in shape, with an average particle size ranging from 16 ± 2 nm.
The elemental composition of synthesized SBO NPs was examined by the EDS spectrum, which displayed a sharp distinctive Bi peak at 2.5 keV, indicating a maximum proportion of Bi (73.59%). Furthermore, smaller peaks at 3 keV and 0.5 keV are assigned to Ag (19.67%) and O (6.74%) respectively (Fig. 3c and S1b†). In addition, the elemental mapping images of Bi, Ag, and O are shown in the EDS of SBO NPs in Fig. S1c–f.†
The morphology of SBO NPs was further confirmed by HR-TEM analysis. The typical HR-TEM images along with the SAED patterns of SBO are given in Fig. 3. The HR-TEM image (Fig. 3d) confirmed that the SBO NPs are spherical in shape, even at lower (20 nm) and higher (50 nm) magnifications, and the SBO NPs are smaller and more spherically shaped (Fig. S2a and b†). The histogram plot of particle size distribution is shown in the right inset of Fig. 3d. SBO NPs have a particle size range of 10–26 nm, with an average particle size of 18 nm for the maximum NPs. The SAED pattern displayed in Fig. 3e strongly illustrates that the SBO NPs are polycrystalline in nature. The interplanar distances D(020) = 4.10, D(021) = 3.53, D(212) = 2.56, and D(122) = 2.11, confirming that the SBO NPs are highly polycrystalline, which is similar to the P-XRD data. The lattice fringe is shown in Fig. 3f, which was further confirmed by inverse fast Fourier transform (FFT) analysis. The lattice fringes with an interplanar spacing of D = 0.31 nm correspond to the (012) lattice plane of monoclinic Bi2O3. Interestingly, the Ag nanoparticles were distributed across the Bi2O3 nano-sheets. The respective lattice fringe of the Ag–Bi2O3 nanoparticles clearly shows two distinct fringe patterns of Ag and Bi2O3 nanoparticles (Fig. S2c†). The obtained TEM results obviously confirm the formation of AgBi2O3 NPs.
3.2. Electrochemical studies
The following possible mechanism is proposed for the oxidation of glucose on the SBO–GC electrode during the anodic sweep in the electrolyte solution, and Bi2O2+ could be oxidized into Bi2O3, while being reduced by the oxidation of glucose. The complete mechanism is given in the ESI (Scheme S1).†
| Bi2O3 + OH− + H2O → 2BiOOH + 2H2O + 4e− | (1) |
| 2BiOOH + 2H2O + 4e− + 2glucose → 2Bi(OH)2 + 2gluconolactone | (2) |
Likewise, the electrocatalytic response of Ag towards the oxidation of glucose depends on the following mechanism.50
| Ag + 2OH− → AgOOH + e− | (3) |
| AgOOH + e− + glucose → Ag(OH)2 + gluconolactone | (4) |
| Gluconolactone → gluconic acid | (5) |
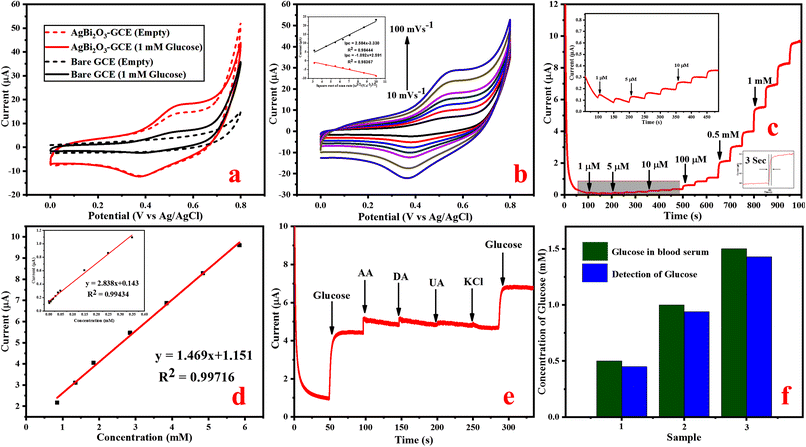
Amperometric response of glucose detection. An amperometric measurement of glucose was carried out based on the electrochemical oxidation of glucose on SBO–GCE. Fig. S3b† shows the typical amperometric i–t response of SBO–GCE after the addition of a known amount (0.5 mM) of glucose in different potentials. It can be seen that the oxidation peak current increases significantly as the potential increases to 0.5, 0.55, 0.6, and 0.65 V. The current response slightly increases as the applied potential shifted from 0.5 V to 0.55 V and the observed current responses are almost equal at applied potentials of 0.55 V and 0.60 V. Even though the applied potential was increased to 0.65 V and above, the current response is decreased. Therefore, 0.55 V was preferred as the best applied potential for amperometric studies. The amperometric response (i–t curve) was investigated by the addition of glucose at varying concentrations from 1 μM to 5.848 mM, and it is remarkable that the fabricated SBO–GC electrode exhibits a quick response in 3 s by the addition of glucose in the electrolyte at the applied potential range of 0.55 V (Fig. 4c).
Fig. 4d illustrates that the calibration curve between the response current and the glucose concentration. The obtained results revealed that the response current linearly increased with the increase in concentrations of glucose in the range of 1 μM to 5.848 mM, and the response current quickly reached the steady state. The calibration plot gives a good linear response with the correlation coefficient of R2 = 0.9971. The sensitivity of 2.153 μA mM−1 cm−2 and the low detection limit (LOD) of 0.87 μM (S/N = 3) were calculated from eqn (6).51
| LOD = 3σ/S | (6) |
The fabricated electrode has excellent analytical performance for glucose detection such as high sensitivity, low limit of detection and good linear range. Table S1† shows that the fabricated SBO–GC electrode performed similarly to or better than previous reports, owing to bismuth's more stable electrochemical properties in the negative potential region than in the positive potential region. The active surface area of the materials must be higher due to the deposition of silver on bismuth, and it provides the perfect surface for the immobilization of glucose oxidase and outperforms the other modified electrodes in glucose detection.
The selectivity of the fabricated SBO–GCE was investigated by the addition of glucose and some interferences such as UA (0.1 mM), KCl (0.5 mM), AA (0.1 mM), and DA (0.1 mM) into 0.1 M NaOH in the potential range of 0.55 V. Fig. 4e shows the amperometric response of the SBO–GCE for successive addition of glucose and interfering compounds for every 50 s. The obtained results revealed that the common interference do not generate a current response after the addition of interfering compounds. However, ascorbic acid had noticeable interference with the amperometric responses, because AA is easily oxidized in alkaline solutions.52 From the analysis, the SBO sensor could be used for the selective detection of glucose in the presence of interfering substance.
Furthermore, the anti-poisoning nature of the modified electrode towards chlorine ions was analyzed by using KCl as an electrolyte because chloride ions and SBO NPs will make a complex, which reduces the electrocatalytic nature of the SBO-modified GC electrode. Interestingly, there is no complexation between chloride ions and SBO NPs, because the oxygen electronegativity is higher than that of chlorine. The obtained results revealed that the peak current of the modified SBO–GC electrode, which is very similar on the expansion of KCl in the glucose-containing electrolyte, demonstrating the anti-poisoning nature of the fabricated electrode.
The reproducibility of the five individual modified SBO–GC electrodes is recorded by the cyclic voltammetry of 1 mM glucose in a 0.1 M NaOH solution at a scan rate of 50 mV s−1 (Fig. S3c†). The SBO–GCE reveals good reproducibility with a relative standard deviation (RSD) of five electrodes at about 2.15%, suggesting that the electrode possesses superior stability and excellent reproducibility for glucose detection. Likewise, the long-term stability of the SBO–GCE was measured, when the modified electrode was again investigated under the same condition after the 15th day (Fig. S3d†). The cyclic voltammetry current response in the direction of glucose detection on the 1st day and 15th day are similar, which indicates that the electrode has good stability toward the detection of glucose.
Detection of glucose in real blood serum samples. In order to assess the practical possibility of the SBO–GCE for the detection of glucose concentrations in human blood, serum samples were used. The amperometric current response was measured at an applied potential of 0.55 V in 10 μL of 0.1 M NaOH solution, under stirring conditions with the addition of 100 μL of blood serum. The results obtained from three different concentrations are shown in Fig. 4f. The obtained results are tabulated in Table 1. The SBO–GCE exhibited a recovery change from 90 to 95% with RSD = 3.6 to 3.9%. These results strongly indicate that the SBO–GCE sensor could be effectively feasible for the detection of glucose in human blood serum samples.
| Sample | Spiked amount (mM) | Detection amount (mM) | Recovery (%) | RSD (%) (n = 3) |
|---|---|---|---|---|
| Glucose (HBS) | 0.5 | 0.45 | 90 | 3.9 |
| 1 | 0.94 | 94 | 3.6 | |
| 1.5 | 1.43 | 95 | 3.8 | |
| NO2− (milk) | 0.5 | 0.48 | 96 | 2.4 |
| 1 | 0.92 | 92 | 2.2 | |
| 1.5 | 1.41 | 94 | 2.1 | |
| 2 | 1.96 | 98 | 2.2 | |
| NO2− (river water) | 0.5 | 0.49 | 98 | 1.1 |
| 1 | 0.97 | 97 | 1.2 | |
| 1.5 | 1.48 | 98 | 1.2 | |
| 2 | 1.99 | 99 | 1.1 | |
| H2O2 (HBS) | 0.5 | 0.46 | 92 | 3.4 |
| 1 | 0.95 | 95 | 3.1 | |
| 1.5 | 1.39 | 93 | 3.7 |
The following mechanism belongs to electro oxidation of NO2− based on SBO–GCE during the anodic current in NaOH solutions.53
| (Ag0–NO2−) → (Ag0–NO2) + e− | (7) |
| (Ag0–NO2) → Ag+ + NO2 + e− | (8) |
| Ag+ + NO2 + H2O → Ag0 + NO3− + 2H+ | (9) |
Similarly, the electrocatalytic reaction of Bi2O3+ towards oxidation of NO2− depends on the following mechanism:
| (Bi2O03–NO2−) → Bi2O3+ + NO2 + 2e− | (10) |
| Bi2O3+ + NO2− + H2O → Bi2O03 + NO3− + 2H+ | (11) |
Amperometric response for NO2− detection. The potential can influence the amperometric behavior of the fabricated SBO–GCE. In order to enhance the electrochemical response and prevent the oxidation of other chemicals, it is essential to choose an applied potential. Therefore, the current response is measured by the successive addition of 0.5 mM NO2− in 1.0 M NaOH at different potentials such as 0.7, 0.75, 0.8, 0.85 and 0.9 V (Fig. S4b†). As a result, the potential range of 0.85 V shows the highest current response, and steady state current is reached. Therefore 0.85 V is preferred as the best potential for the detection of NO2− in amperometric measurements.
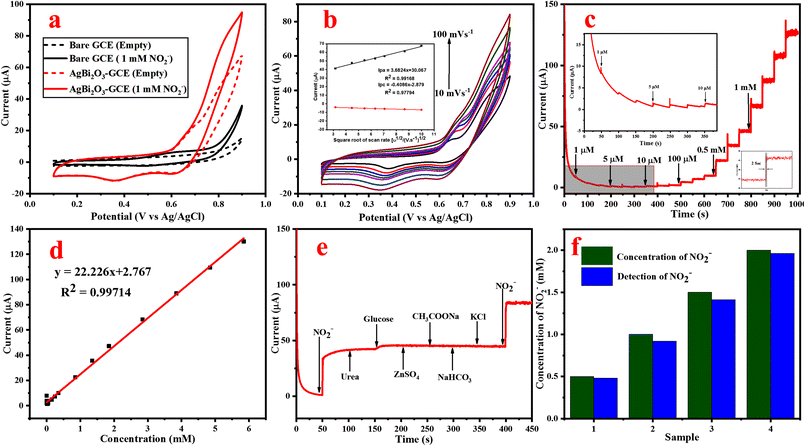
The amperometric (i–t) curve was used to measure the concentration of NO2−, sensitivity and LOD for the fabricated SBO–GC electrode. Fig. 5c shows that the current response of the SBO–GC electrode is gradually increased with the increase in concentrations of NO2− for every 50 s in an electrolyte solution. In each addition of NO2−, the steady-state current response increased within 2 s (inset Fig. 5c). The obtained results revealed that the response current increased linearly with the increase in concentrations of NO2− in the range from 1.0 μM to 5.848 mM. Fig. 5d also shows the calibration curve between the peak current (μ) and the concentration of NO2−. The correlation coefficient R2 is 0.997, sensitivity is 22 μA mM−1 cm−2 and the detection limit is 1.8 μM (S/N = 3), as calculated from eqn (6). The linear range and detection limit of the fabricated SBO biosensor was in contrast with other reported biosensors. From Table S2,† the LOD of our fabricated SBO biosensor is lower than that of the other reported sensors. Moreover, the fabrication method of the SBO–GCE is simpler than that of the other reported sensors.
The selectivity of the fabricated SBO–GC electrode was investigated by the addition of some interferences of inorganic ions (Zn2+, Na+, and K+) and organic compounds (urea and glucose CH3COONa) into 0.1 M NaOH. Fig. 5e shows the amperometric response of the SBO–GCE for successive addition of NO2− and interfering compounds every 50 s. The obtained results revealed that the common interference does not generate a current response after the addition of interfering compounds. However, the addition of NO2− influenced the current response with very low deviations (<5%). From the analysis, the SBO sensor could be used for the selective detection of NO2− in the presence of an interfering substance.
The stability and reproducibility of the fabricated SBO–GCE have also been examined by the CV method. The reproducibility of the electrode was determined by analysis of the amperometric response of 1.0 mM of NO2− at five independently fabricated SBO–GCE electrodes shown in Fig. S4c.† The five electrodes exhibited the relative standard deviation RSD = 1.9% for the current response of the oxidation of NO2−, which showed excellent reproducibility for NO2− detection. After amperometric measurements, the modified electrode was kept in the air at ambient temperature. The sensor maintained 95.2% of its primary response even after 15 days (Fig. S4d†), which indicates that the fabricated electrode has excellent stability toward the oxidation of NO2−.
Real sample analysis of NO2−. The practical viability of the SBO–GCE was confirmed by the detection of NO2− concentration in milk and river water samples. The standard addition method was used to estimate the accuracy. In milk samples recorded at 4 different concentrations spiked with prepared milk and river water samples (Fig. 5f). The obtained results are tabulated in Table 1. The SBO–GCE exhibited a recovery change from 92 to 98% with the RSD in the range of 2.1 to 2.4%. These results strongly indicate that the SBO–GCE sensor could be strongly feasible for the detection of NO2− in real samples.
The mechanism belongs to the reduction of H2O2 by the SBO–GC electrode during the cathodic current in a NaOH solution given in ESI Fig. S6.† Amperometric response of H2O2 detection.
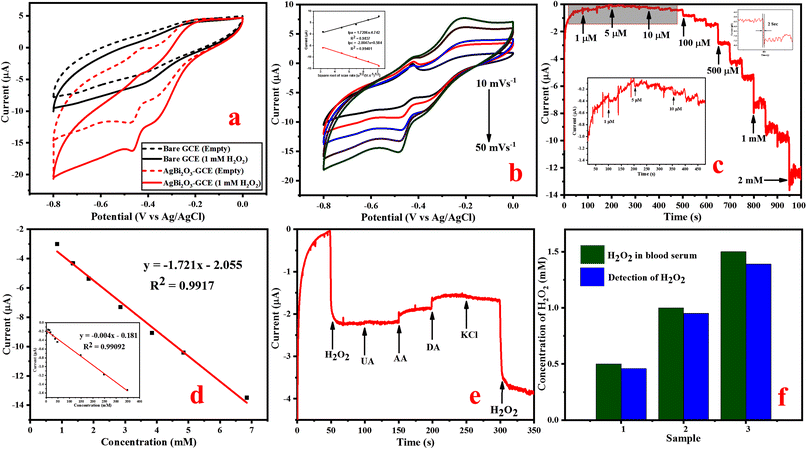
The electrochemical performance of the SBO–GCE was recorded using an amperometric i–t curve in a 0.1 M NaOH solution with the increase in concentrations of H2O2 under N2 saturation. Fig. S5b† illustrates the effect of different applied potentials (0.4, 0.45, 0.5 and 0.55 V) on the amperometric current response. The current response slightly increases as the applied potential shifted from −0.4 V and −0.45 V to a more negative value. The maximum current response was observed at an applied potential of −0.5 V, whereas the current response did not considerably increase even at an applied potential of −0.55 V. As a result, −0.5 V was preferred as the best applied potential for further amperometric studies. Fig. 6c depicts the amperometry of the SBO–GCE in increasing concentrations of H2O2 at regular intervals (every 50 s) into stirred 0.1 M NaOH at 0.50 V. The steady state current was reached in 2 s, indicating the fast response behaviour with a linear increase in H2O2 concentration from 1 μM to 6.847 mM. The fabricated electrode exhibits a quick, well-defined amperometric response towards various concentrations of H2O2. Furthermore, the current response increases rapidly, reaching 95% of the maximum steady state current within 2 s for every addition of H2O2. As a result, the SBO–GCE shows the quick amperometric response behavior that can be obtained. The calibration plot between the H2O2 concentration and current (Fig. 6d) reveals a good correlation co-efficient (R2 = 0.9917) with a sensitivity of 1.72 μA mM−1 cm−2. The limit of detection was determined using eqn (5). The LOD (S/N = 3) of the SBO–GCE was calculated to be 1.15 μM. When compared to other recently reported non-enzymatic sensors based on transition metal nanomaterials (Table S3†), the suggested sensor had a higher sensitivity and a lower detection limit, indicating that it could be useful for H2O2 detection in practical applications.
In order to access the selectivity of the fabricated SBO–GCE, the effect of current response on the SBO–GCE has been examined in the presence of interferences such as 0.1 mM UA, 0.1 mM AA, 0.1 mM DA, and 0.5 mM KCl in 0.1 M NaOH at a potential of −0.50 V (Fig. 6e). As a result, the electrode quickly responds to H2O2, but it is not sensitive to other species, and the current response of the initial addition of H2O2 is strongly similar to the final addition of H2O2. This indicates that these interferences have little effects on H2O2 reduction at the SBO–GCE. For each addition of interferences, a negligible response with no effect on the analyte response was recorded, confirming that the modified electrode exhibits excellent selectivity towards the detection of H2O2.
The stability and reproducibility of the fabricated SBO–GCE have also been examined by the cyclic voltammetry method at a scan rate of 20 mV s−1. The reproducibility of the electrode was analyzed from the amperometric response of 1.0 mM of H2O2 for five successive fabricated SBO–GCEs (Fig. S5c†). The five electrodes exhibited the relative standard deviation (RSD) = 3.53% for the current response of H2O2 and showed excellent reproducibility for H2O2 detection. This analysis confirmed that the electrode has highly reproducibility. After CV measurements, the modified electrode was kept in the air at ambient temperature. The sensor maintained 90% of its initial response after 15 days (Fig. S5d†), which indicated that the modified electrode has excellent stability toward the reduction of H2O2.
Detection of H2O2 in real blood serum samples. The reliability of the SBO–GCE for real-time applications and the detection of H2O2 in human blood serum samples were examined by a standard addition method. Fig. 6f exhibits the analytical response obtained for three concentrations of a blood serum sample. The recovery of the three different concentrations of spiked H2O2 in the blood serum sample was in the range of 0.5 mM, 1 mM and 1.5 mM, as shown in Table 1. The fabricated sensor determined the standard H2O2 concentration added into the blood serum sample to be in the range of 0.46, 0.95, and 1.35, with a recovery range of 92–95%. These results suggest that the SBO–GCE could be strongly feasible and effective in the detection of H2O2 in real-time analysis.
4. Conclusions
In summary, we effectively synthesized Ag-functionalized Bi2O3 NPs via a facile hydrothermal approach. The crystalline nature and the presence of elements were confirmed by XRD, FT-IR, EDX, and XPS techniques and the structural morphology was established using HR-SEM and HR-TM images. In addition, the SBO–GCE was fabricated by drop-casting onto the surface of the GCE to generate a non-enzymatic electrochemical sensor for glucose, NO2− and H2O2. The fabricated SBO–GCE exhibits high sensitivities of 2.153 μA mM−1 cm−2, 22 μA mM−1 cm−2 and 1.17 μA mM−1 cm−2 and low limits of detection of 0.87 μM, 1.8 μM and 1.15 μM, good stability, high selectivity, and excellent reproducibility towards glucose, NO2− and H2O2 respectively. It can also be used for the detection of glucose and H2O2 in human blood serum samples. SBO effectively identified and quantified NO2− in real time from milk and river water samples. Accordingly, the results will encourage that the SBO–GCE can be effectively used as a non-enzymatic electrochemical sensor.Author contributions
Ramesh: formal analysis, data curation, writing – original draft, validation. Sankar: resources, formal analysis, data curation, writing – review & editing. Umamatheswari: supervision, investigation, formal analysis, data curation, validation, writing – review & editing, conceptualization, methodology. Ganapathi Raman: methodology, writing – review & editing. Jayavel: conceptualization, review & editing. Dongjin Choi: formal analysis, conceptualization, writing – review & editing.Conflicts of interest
The authors declare that they have no competing financial interests or personal relationships that could have influenced the work reported in this paper.Acknowledgements
The authors are thankful to the Centre for Nanoscience and Technology, Anna University and SRM Central Instrumentation Facility (SCIF) and SRM Nano Technology for providing research facilities. This research was supported by Hongik University's Project for the Establishment of Regionally Specialized Smart City Graduate School. This work was also supported by the International Science & Business Belt support program, through the Korea Innovation Foundation funded by the Ministry of Science and ICT.References
- K. G. M. M. Alberti and P. Z. Zimmet, Diabet. Med., 1998, 15, 539–553, DOI:10.1002/(SICI)1096-9136(199807)15:7<539::AID-DIA668>3.0.CO;2-S.
- A. Amod, J. B. Buse, D. K. McGuire, T. R. Pieber, R. Pop-Busui, R. E. Pratley, B. Zinman, M. B. Hansen, T. Jia, T. Mark and N. R. Poulter, Diabetes Vasc. Dis. Res., 2020, 17, 1–10, DOI:10.1177/1479164120970933.
- A. Tsegaw, S. Alemu, A. Dessie, C. C. Patterson, E. H. O. Parry, D. I. W. Phillips and E. R. Trimble, J. Ophthalmol., 2022, 2021, 6696548, DOI:10.1155/2021/6696548.
- V. Kesireddy, B. Kluwe, N. Pohlman, S. Zhao, Y. Tan, D. Kline, G. Brock, J. B. Odei, V. S. Effoe, J. B. E. Tcheugui, R. R. Kalyani, M. Sims, H. A. Taylor, M. M. Chaffin, E. Akhabue and J. J. Joseph, American Journal of Preventive Cardiology, 2023, 13, 100466, DOI:10.1016/j.ajpc.2023.100466.
- K. J. Cash and H. A. Clark, Trends Mol. Med., 2010, 16, 584–593, DOI:10.1016/j.molmed.2010.08.002.
- L. Li, D. Liu, K. Wang, H. Mao and T. You, Sens. Actuators, B, 2017, 252, 17–23, DOI:10.1016/j.snb.2017.05.155.
- K. Promsuwan, P. Thavarungkul, P. Kanatharana and W. Limbut, Electrochim. Acta, 2017, 232, 357–369, DOI:10.1016/j.electacta.2017.02.138.
- T. Y. K. Chan, Toxicol. Lett., 2011, 200, 107–108, DOI:10.1016/j.toxlet.2010.11.002.
- P. Jakszyn and C. A. Gonzalez, World J. Gastroenterol., 2006, 12, 4296–4303, DOI:10.3748/wjg.v12.i27.4296.
- M. Annalakshmi, S. Kumaravel, S.-M. Chen, P. Balasubramanian and T. S. T. Balamurugan, Sens. Actuators, B, 2020, 305, 127387, DOI:10.1016/j.snb.2019.127387.
- M. Liu, S. Zhang, J. Gao, Y. Qian, H. Song, S. Wang, K. Xie, W. Jiang and A. Li, Sens. Actuators, B, 2017, 243, 184–194, DOI:10.1016/j.snb.2016.11.124.
- D. Bopitiya, M. T. W. Hearn, J. Zhang and L. E. Bennett, Food Chem., 2022, 395, 133619, DOI:10.1016/j.foodchem.2022.133619.
- R. N. M. Ramirez, R. N. L. Matheu, R. N. M. Gomez, M. D. A. Chang, M. D. J. Ferrolino, M. D. R. Mack, M. D. F. Antillon-Klussmann and M. D. M. Melgar, Am. J. Infect. Control, 2021, 49, 608–613, DOI:10.1016/j.ajic.2020.08.026.
- G. Amala, J. Saravanan, D. J. Yoo, A. R. Kim and G. Gnana Kumar, New J. Chem., 2017, 41, 4022–4030, 10.1039/c6nj04030f.
- V. Mani, S. Selvaraj, T. K. Peng, H. Y. Lin, N. Jeromiyas, H. Ikeda, Y. Hayakawa, S. Ponnusamy, C. Muthamizhchelvan and S. T. Huang, ACS Appl. Nano Mater., 2019, 2, 5049–5060, DOI:10.1021/acsanm.9b00969.
- R. A. Al-Okab and A. A. Syed, Talanta, 2007, 72, 1239–1247, DOI:10.1016/j.talanta.2007.01.027.
- N. Ding, N. Yan, C. Ren and X. Chen, Anal. Chem., 2010, 82, 5897–5899, DOI:10.1021/ac100597s.
- D. Lan, B. Li and Z. Zhang, Biosens. Bioelectron., 2008, 24, 934–938, DOI:10.1016/j.bios.2008.07.064.
- B. C. Dickinson and C. J. Chang, J. Am. Chem. Soc., 2008, 130, 9638–9639, DOI:10.1021/ja802355u.
- A. Büldt and U. Karst, Anal. Chem., 1999, 71, 3003–3007, DOI:10.1021/ac981330t.
- Y. Chen, G. I. N. Waterhouse, X. Qiao, Y. Sun and Z. Xu, Food Chem., 2022, 372, 131356, DOI:10.1016/j.foodchem.2021.131356.
- M. Islam, N. Arya, P. G. Weidler, J. G. Korvink and V. Badilita, Mater. Today Chem., 2020, 17, 100338, DOI:10.1016/j.mtchem.2020.100338.
- J. X. Zhou, L. N. Tang, F. Yang, F. X. Liang, H. Wang, Y. T. Li and G. J. Zhang, Analyst, 2017, 142, 4322–4329, 10.1039/c7an01446e.
- S. Fu, G. Fan, L. Yang and F. Li, Electrochim. Acta, 2015, 152, 146–154, DOI:10.1016/j.electacta.2014.11.115.
- F. Xiao, F. Zhao, D. Mei, Z. Mo and B. Zeng, Biosens. Bioelectron., 2009, 24, 3481–3486, DOI:10.1016/j.bios.2009.04.045.
- Y. Zhang, L. Li, H. Su, W. Huang and X. Dong, J. Mater. Chem. A, 2015, 3, 43–59, 10.1039/c4ta04996a.
- C. Yuan, H. B. Wu, Y. Xie and X. W. Lou, Angew. Chem., Int. Ed., 2014, 53, 1488–1504, DOI:10.1002/anie.201303971.
- H. Lu, S. Wang, L. Zhao, B. Dong, Z. Xu and J. Li, RSC Adv., 2012, 2, 3374–3378, 10.1039/c2ra01203k.
- W. Li, Facile, Mater. Chem. Phys., 2006, 99, 174–180, DOI:10.1016/j.matchemphys.2005.11.007.
- S. N. Ding, D. Shan, H. G. Xue and S. Cosnier, Bioelectrochemistry, 2010, 79, 218–222, DOI:10.1016/j.bioelechem.2010.05.002.
- A. P. Periasamy, S. Yang and S. M. Chen, Talanta, 2011, 87, 15–23, DOI:10.1016/j.talanta.2011.09.021.
- S. Durdic, V. Vukojevic, F. Vlahovic, M. Ognjanovic, L. Svorc, K. Kalcher, J. Mutic and D. M. Stankovic, J. Electroanal. Chem., 2019, 850, 113400, DOI:10.1016/j.jelechem.2019.113400.
- G. N. Sinha, P. Subramanyam, V. S. Krishna and C. Subrahmanyam, Inorg. Chem. Commun., 2020, 119, 108112, DOI:10.1016/j.inoche.2020.108112.
- Q. M. Jiang, M. R. Zhang, L. Q. Luo and G. B. Pan, Talanta, 2017, 171, 250–254, DOI:10.1016/j.talanta.2017.04.075.
- P. Chakraborty, S. Dhar, K. Debnath, T. Majumder and S. P. Mondal, Sens. Actuators, B, 2019, 283, 776–785, DOI:10.1016/j.snb.2018.12.086.
- C. L. Hsu, Y. J. Fang, T. J. Hsueh, S. H. Wang and S. J. Chang, J. Phys. Chem. B, 2017, 121, 2931–2941, DOI:10.1021/acs.jpcb.6b11257.
- M. Rycenga, C. M. Cobley, J. Zeng, W. Li, C. H. Moran, Q. Zhang, D. Qin and Y. Xia, Chem. Rev., 2011, 111, 3669–3712, DOI:10.1021/cr100275d.
- K. D. Gilroy, X. Yang, S. Xie, M. Zhao, D. Qin and Y. Xia, Adv. Mater., 2018, 30, 1706312–1706337, DOI:10.1002/adma.201706312.
- M. H. Rashid and T. K. Mandal, J. Phys. Chem. C, 2007, 111, 16750–16760, DOI:10.1021/jp074963x.
- Y. Wang, X. J. Yang, J. Bai, X. Jiang and G. Fan, Biosens. Bioelectron., 2013, 43, 180–185, DOI:10.1016/j.bios.2012.10.099.
- L. J. Zhong, S. Y. Gan, X. G. Fu, F. Li, D. Han, L. Guo and L. Niu, Electrochim. Acta, 2013, 89, 222–228, DOI:10.1016/j.electacta.2012.10.161.
- F. L. Qu, H. M. Lu, M. H. Yang and C. Deng, Biosens. Bioelectron., 2011, 26, 4810–4814, DOI:10.1016/j.bios.2011.06.018.
- P. Bollella, C. Schulz, G. Favero, F. Mazzei, R. Ludwig, L. Gorton and R. Antiochia, Electroanalysis, 2016, 29, 77–86, DOI:10.1002/elan.201600476.
- W. B. Lu, Y. L. Luo, G. H. Chang and X. Sun, Biosens. Bioelectron., 2011, 26, 4791–4797, DOI:10.1016/j.bios.2011.06.008.
- M. Ahamed, M. J. Akhtar, M. A. M. Khan, Z. A. M. Alaizeri and H. Alhadlaq, ACS Omega, 2021, 6, 17353–17361, DOI:10.1021/acsomega.1c01467.
- M. A. Deshmukh, B. C. Kang and T. J. Ha, J. Mater. Chem. C, 2020, 8, 5112–5123, 10.1039/C9TC06836H.
- H. Peng, A. Yang and J. Xiong, Carbohydr. Polym., 2013, 91, 348–355, DOI:10.1016/j.carbpol.2012.08.073.
- A. I. Gopalan, N. Muthuchamy and K. P. Lee, Biosens. Bioelectron., 2017, 89, 352–360, DOI:10.1016/j.bios.2016.07.017.
- G.-Q. Liu, H. Zhong, X.-R. Li, K. Yang, F. FeiJia, Z. Cheng, L. Zhang, J. Yin, L. Guo and H. Qian, Sens. Actuators, B, 2017, 242, 484–491, DOI:10.1016/j.snb.2016.11.019.
- M. W. Ahmad, S. Varma, D.-J. Yang, M. V. Islam and A. Choudhry, J. Macromol. Sci., Part A: Pure Appl.Chem., 2021, 58, 461–471, DOI:10.1080/10601325.2021.1886585.
- M. Ramesh, C. Sankar, S. Umamatheswari, J. Balamurugan, R. Jayavel and M. Gowran, Int. J. Biol. Macromol., 2023, 226, 618–627, DOI:10.1016/j.ijbiomac.2022.11.318.
- T. S. Babu and T. Ramachandran, Electrochim. Acta, 2010, 55, 1612–1618, DOI:10.1016/j.electacta.2009.10.034.
- P. K. Rastogi, V. Ganesan and S. Krishnamoorthi, J. Mater. Chem. A, 2014, 2, 933–943, 10.1039/c3ta13794e.
Footnote |
| † Electronic supplementary information (ESI) available. See DOI: https://doi.org/10.1039/d2ra08140g |
| This journal is © The Royal Society of Chemistry 2023 |

