 Open Access Article
Creative Commons Attribution 3.0 Unported Licence
Aqueous solutions with information on solids: room-temperature phosphorescence of polysaccharide–benzophenone complexes†
Masafumi Okunoa,
Keita Yamanaa,
Riku Kawasaki a,
Yuto Konishib,
Toshikazu Ono
 b,
Tsutomu Ishi-i
 c and
Atsushi Ikeda
 *a
*a
aApplied Chemistry Program, Graduate School of Advanced Science and Engineering, Hiroshima University, 1-4-1 Kagamiyama, Higashi-Hiroshima, 739-8527, Japan
bDepartment of Chemistry and Biochemistry, Graduate School of Engineering, Kyushu University, 744 Motooka, Nishi-ku, Fukuoka, 819-0395, Japan
cDepartment of Biochemistry and Applied Chemistry, National Institute of Technology, Kurume College, 1-1-1 Komorino, Kurume, 830-8555, Japan
First published on 26th January 2023
Abstract
Benzophenone and its derivatives emit crystallization-induced phosphorescence despite their simple structures. To easily modify their phosphorescence properties, we prepared phosphorescence-emitting aqueous solutions of polysaccharide–benzophenone and polysaccharide-4,4′-difluorobenzophenone complexes, which exhibit excellent biocompatibility and biodegradability.
Introduction
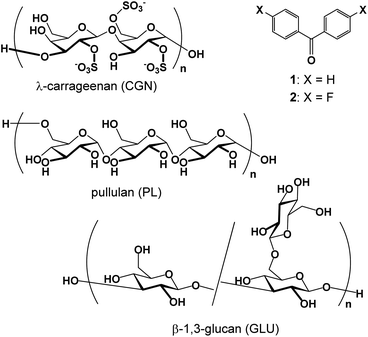
Since their discovery by Morantz et al.1 metal-free organic materials that emit room-temperature phosphorescence (RTP) have been receiving significant research interest.2–7 Most metal-free organic phosphorescent materials exist in the solid state at room temperature or in solution at a temperature below the melting point of the solvent.1–7 Recently, the formation of complexes with macrocyclic host molecules, such as cyclodextrins and cucurbiturils, or amphiphilic block copolymers has enabled the observation of organic phosphorescence in aqueous solutions at room temperature.8–18 These complexes in water are expected to be applied in bioimaging, exploiting their long emission lifetimes to avoid autofluorescence from endogenous fluorophores.12,13 Consequently, long-lived RTP materials improve signal-to-noise ratios because of the elimination of background interference by time-resolved imaging techniques.19,20 Previously, we succeeded in preparing aqueous solutions with information on solids (ASIS), such as aggregation-induced helical chirality in chiral crystals,21 crystal polymorphism,22 mechanochromic luminescence, and different fluorescence maxima depending on the crystal polymorphism22 or small aromatic guest molecules.23 In these studies, natural polysaccharides or polypeptides were used as the solubilizing agents because of their excellent biocompatibility and biodegradability.24–26 Therefore, RTP molecules in complexes with polysaccharides or polypeptides are expected to retain their phosphorescence properties in aqueous solutions.Benzophenone (1, Fig. 1) has been shown to emit phosphorescence at room temperature in the solid state.27,28 The phosphorescence in the crystal form is centered at 449 nm, with an average lifetime of 317 μs.27 Conversely, 4,4′-difluorobenzophenone (2, Fig. 1) has a longer phosphorescence lifetime (〈τ〉) and higher quantum yield (Φ) than 1 (2: 〈τ〉 = 1297 μs, Φ = 40%; 1: Φ = 16%).27 In this study, these benzophenones were solubilized in water using polysaccharides, such as pullulan (PL), λ-carrageenan (CGN), and β-(1,3-1,5)-D-glucan (GLU) as the solubilizing molecules, and they retained their phosphorescence properties (Fig. 1). Using different solubilizing molecules and methods, we investigated the solubilizing ability, phosphorescence properties, and stability of the aqueous solutions.
Results and discussion
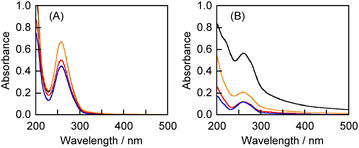
After the crystallization of 1 and 2 from toluene, each crystal (5.0 μmol) was mixed with CGN (10 mg) using a mechanochemical high-speed vibration milling (HSVM) technique.21,29,30 Similarly, the crystals of 1 or 2 were mixed with CGN, PL, or GLU (10 mg) by grinding using a porcelain mortar and pestle.22 Thereafter, these solid mixtures were extracted using ultrapure water, and the resulting resin was separated from the aqueous solution by centrifugation for 20 min at 4500 rpm.All the aqueous solutions of 1 complexed with polysaccharides exhibited the absorption maximum at 257 nm, indicative of the absorption of 1 (Fig. 2A). Consequently, 1 could be solubilized by the three polysaccharides in both the HSVM and grinding methods. The concentrations of 1 in the aqueous solutions were determined based on the molar extinction coefficient after adding methanol (water![[thin space (1/6-em)]](https://www.rsc.org/images/entities/char_2009.gif) :
:![[thin space (1/6-em)]](https://www.rsc.org/images/entities/char_2009.gif) methanol = 1
methanol = 1![[thin space (1/6-em)]](https://www.rsc.org/images/entities/char_2009.gif) :
:![[thin space (1/6-em)]](https://www.rsc.org/images/entities/char_2009.gif) 9 (v/v)) to disrupt the complexes. The calculated concentrations of 1 in the CGN–1 complexes prepared by the HSVM and the grinding methods are 0.93 and 0.70 mmol L−1, respectively. The result indicates that the solubility of 1 in the grinding method was comparable to that in the HSVM method. In contrast, the concentration of 1 in the GLU–1 complex (0.93 mmol L−1) was higher than those in the CGN–1 and PL–1 complexes prepared by the grinding method (0.70 and 0.62 mmol L−1, respectively).
9 (v/v)) to disrupt the complexes. The calculated concentrations of 1 in the CGN–1 complexes prepared by the HSVM and the grinding methods are 0.93 and 0.70 mmol L−1, respectively. The result indicates that the solubility of 1 in the grinding method was comparable to that in the HSVM method. In contrast, the concentration of 1 in the GLU–1 complex (0.93 mmol L−1) was higher than those in the CGN–1 and PL–1 complexes prepared by the grinding method (0.70 and 0.62 mmol L−1, respectively).
The appearance of the absorption maximum at 261 nm for all the aqueous solutions of the CGN–2, PL–2, and GLU–2 complexes indicates that the fluorinated benzophenone (2) in all the complexes was dissolved in water (Fig. 2B). The concentrations of 2 in the CGN–2 complexes prepared by the HSVM and the grinding methods are 2.52 and 0.54 mmol L−1, respectively. The solubilities of the polysaccharide–2 complexes prepared by the HSVM method were considerably higher than those of the complexes prepared by the grinding method. The concentration of 2 in the GLU–2 complex (0.93 mmol L−1) was higher than those in the CGN–2 and PL–2 complexes prepared by the grinding methods (0.54 and 0.52 mmol L−1, respectively).
In summary, the solubilities of the polysaccharide–1 and –2 complexes prepared by the grinding method are in the order of GLU– > CGN– ≈ PL–(GLU–1: 0.93, CGN–1: 0.70, and PL–1: 0.62 mmol L−1, GLU–2: 0.93, CGN–2: 0.54, and PL–2: 0.52 mmol L−1). The polysaccharide–1 complexes exhibited higher solubilities than the polysaccharide–2 complexes.
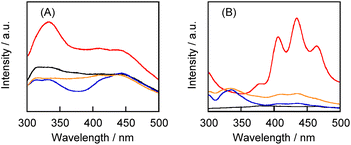
Although the solubility of 1 in the polysaccharide–1 complexes was not significantly influenced by the mixing method and type of polysaccharide, the aqueous solutions exhibited considerably different fluorescence and phosphorescence spectra (Fig. 3A). The aqueous solution of the CGN–1 complex prepared by the grinding method exhibited higher-intensity fluorescence and phosphorescence peaks in the 300–375 and 400–500 nm regions, respectively,27 compared with those for the other solutions (Fig. 3A). In particular, the GLU–1 complex exhibited weak emission despite its high solubility. This result suggests that the CGN–1 complex prepared by the grinding method contains the highest proportion of 1 in the solid state. However, three barely visible peaks assignable to the phosphorescence of 1 in the crystalline state at room temperature were observed at 420, 449, and 483 nm.24 In contrast, the aqueous solution of the CGN–2 complex exhibited higher-intensity fluorescence and phosphorescence peaks compared with those for the other solutions of 2 (Fig. 3B). Furthermore, the fluorescence and phosphorescence peak intensities for the aqueous solution of the CGN–2 complex were considerably higher than those for the CGN–1 complex under the same conditions ([1] = [2] = 0.50 mM) (Fig. S1†). The peaks at 406, 435, and 465 nm for the CGN–2 complex are similar to those at 409, 436, and 467 nm of 2 observed in the crystalline state at room temperature.27 Therefore, we used the CGN–2 and CGN–1 complexes as the reference for all subsequent experiments.
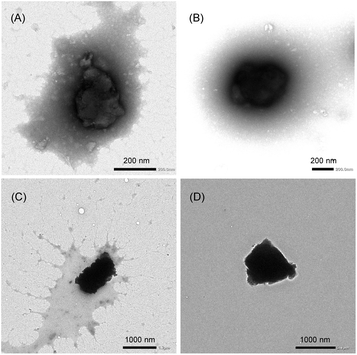
The hydrodynamic diameters (Dhy) of the CGN–1 and CGN–2 complexes prepared by the HSVM method were determined to be 299 and 352 nm, with polydispersity indexes of 0.17 and 0.22, respectively, by dynamic light scattering (DLS) measurements (Table 1 and Fig. S2†). In contrast, the Dhy values of the CGN–1 and CGN–2 complexes prepared by the grinding method (1058 and 1519 nm, respectively) were considerably larger than those prepared by the HSVM method. Furthermore, the morphologies of the CGN–1 and CGN–2 complexes were observed by transmission electron microscopy (TEM). As shown in Fig. 4A and B, globular structures with diameters of approximately 300 nm were observed in both the CGN–1 and CGN–2 complexes prepared by the HSVM method. Furthermore, globular structures with diameters of approximately 1000 nm were observed in both the CGN–1 and CGN–2 complexes prepared by the grinding method (Fig. 4C and D). These diameters were consistent with the Dhy values determined by DLS measurements (Table 1).
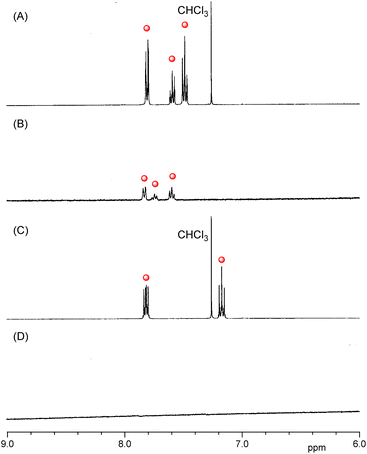
To ascertain whether 1 or 2 leaked from their respective CGN complexes, proton nuclear magnetic resonance (1H NMR) spectra were measured (Fig. 5 and S3†). All the peaks of the guest molecules in the large self-aggregate disappeared because of peak broadening. However, the peaks of the free guest molecules leaked from the complexes appeared in the 1H NMR spectra.29–33 In the D2O solution of the CGN–1 complex, peaks assignable to 1 appeared at the 7.5–8.0 ppm region (Fig. 5B), attributed to the slight water solubility of 1 (0.14 g L−1). The result indicates that several portions of 1 leaked from the CGN–1 complex. The leakage percentage of 1 from the CGN–1 complex was estimated to be 4%, based on the peak intensity of 1 relative to the peak intensity of DMSO added as the internal reference. In contrast, no peaks of 2 in the CGN–2 complex appeared at the 7.0–8.0 ppm region, indicating that most of 2 were incorporated in the complex (Fig. 5D).
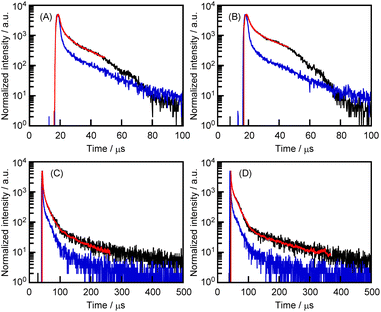
In Fig. 3, the peaks at the 400–500 nm region are predicted to be indicative of phosphorescence. Therefore, the photoluminescence spectral decay behavior of the CGN–1 and CGN–2 complexes was investigated by a time-resolved technique (Fig. 6). To fit the fluorescence decays (red lines), we measured the system's temporal instrument response function (blue lines). The measurement data were subtracted from the time-resolved photoluminescence decay curve (black lines) data to compensate for the distortions in the data caused by the instrument response function (Fig. 6). The emissions of the CGN–1 and CGN–2 complexes decay through three relaxation pathways; the same applies to the crystallization-induced phosphorescence of 1 and 2. The mean lifetimes of the CGN–1 and CGN–2 complexes prepared by the grinding method (〈τ〉 = 10.6 and 29.7 μs, respectively) were longer than those of the complexes prepared by the HSVM method (〈τ〉 = 4.7 and 8.3 μs, respectively) (Fig. 6 and Table 2). In contrast, the mean lifetime of the CGN–2 complex prepared by the grinding method (〈τ〉 = 29.7 μs) was longer than that of the CGN–1 complex prepared by the grinding method (〈τ〉 = 10.6 μs) (Fig. 6 and Table 2). These results clearly indicate that the CGN–1 and CGN–2 complexes retained the property of crystallization-induced phosphorescence of 1 and 2 in the aqueous solutions. However, the 〈τ〉 values of 1 and 2 in the complex state were considerably lower than those in the solid state (317 and 1297 μs, respectively) (Fig. 6).27
| Preparation method | λRTP (nm) | Phosphorescence decay | ||||
|---|---|---|---|---|---|---|
| τ1/μs (A1/%) | τ2/μs (A2/%) | τ3/μs (A3/%) | 〈τ〉/μs | |||
| CGN–1 | HSVM | 400 | 0.1 (97.3) | 2.3 (2.0) | 11.1 (0.6) | 4.7 |
| CGN–2 | HSVM | 400 | 0.1 (90.6) | 2.0 (7.4) | 15.1 (1.9) | 8.3 |
| CGN–1 | Grinding | 440 | 0.7 (94.8) | 6.9 (5.0) | 63.5 (0.2) | 10.6 |
| CGN–2 | Grinding | 440 | 1.0 (93.2) | 11.0 (6.7) | 188.8 (0.1) | 29.7 |
Experimental
Materials
Benzophenone (1) and 4,4′-difluorobenzophenone (2) were purchased from Kanto Chemical Co., Ltd. (Tokyo, Japan). Pullulan (PL) and λ-carrageenan (CGN) were procured from Tokyo Chemical Industry Co., Ltd. (Tokyo, Japan) and FUJIFILM Wako Pure Chemical Corporation (Osaka, Japan), respectively. β-(1,3-1,5)-D-Glucan (GLU) was used after purification using Aureobasidium pullulans black yeast.Preparation of the CGN–1 and CGN–2 complexes by the HSVM method
Compound 1 or 2 (1.0 mg, 5.0 and 4.6 μmol, respectively) and CGN (10.0 mg) were placed in an agate capsule with two agate-mixing balls and mixed vigorously at 30 Hz for 20 min using a high-speed vibration mill (MM 200; Retsch Co., Ltd., Haan, Germany). The solid mixture was suspended in water (2.0 mL) to produce a white emulsion. After centrifugation (4500×g, 25 °C, 20 min), the undispersed 1 or 2 materials were removed from the solution. The concentrations of 1 and 2 in the complexes with CGN were determined by the absorbances at 254 and 256 nm, respectively, of the aqueous solutions (0.1 mL) of the CGN–1 and CGN–2 complexes diluted by methanol (0.9 mL). The Abs254 and Abs256 values in water![[thin space (1/6-em)]](https://www.rsc.org/images/entities/char_2009.gif) :
:![[thin space (1/6-em)]](https://www.rsc.org/images/entities/char_2009.gif) methanol = 1
methanol = 1![[thin space (1/6-em)]](https://www.rsc.org/images/entities/char_2009.gif) :
:![[thin space (1/6-em)]](https://www.rsc.org/images/entities/char_2009.gif) 9 (v/v) solutions for the CGN–1 and CGN–2 complexes were 0.6837 and 0.2606 (1 mm cell). As the molar absorption coefficients of 1 and 2 in water
9 (v/v) solutions for the CGN–1 and CGN–2 complexes were 0.6837 and 0.2606 (1 mm cell). As the molar absorption coefficients of 1 and 2 in water![[thin space (1/6-em)]](https://www.rsc.org/images/entities/char_2009.gif) :
:![[thin space (1/6-em)]](https://www.rsc.org/images/entities/char_2009.gif) methanol = 1
methanol = 1![[thin space (1/6-em)]](https://www.rsc.org/images/entities/char_2009.gif) :
:![[thin space (1/6-em)]](https://www.rsc.org/images/entities/char_2009.gif) 9 (v/v) were ε254 = 6.83 × 10⁴ dm3 mol−1 and ε256 = 1.53 × 10⁴ dm3 mol−1, respectively, the concentrations of 1 and 2 in water
9 (v/v) were ε254 = 6.83 × 10⁴ dm3 mol−1 and ε256 = 1.53 × 10⁴ dm3 mol−1, respectively, the concentrations of 1 and 2 in water![[thin space (1/6-em)]](https://www.rsc.org/images/entities/char_2009.gif) :
:![[thin space (1/6-em)]](https://www.rsc.org/images/entities/char_2009.gif) methanol = 1
methanol = 1![[thin space (1/6-em)]](https://www.rsc.org/images/entities/char_2009.gif) :
:![[thin space (1/6-em)]](https://www.rsc.org/images/entities/char_2009.gif) 9 (v/v) were determined to be 9.81 × 10⁻⁵ and 1.18 × 10⁻⁴ M, respectively, by the Beer–Lambert law. Therefore, the concentrations and molar absorption coefficients of 1 and 2 in the aqueous solutions of the CGN–1 and CGN–2 complexes were also 9.81 × 10⁻⁴ M and 1.18 × 10⁻³ M and ε254 = 7.00 × 10³ dm3 mol−1 and ε256 = 2.21 × 10³ dm3 mol−1, respectively, by the Beer–Lambert law.
9 (v/v) were determined to be 9.81 × 10⁻⁵ and 1.18 × 10⁻⁴ M, respectively, by the Beer–Lambert law. Therefore, the concentrations and molar absorption coefficients of 1 and 2 in the aqueous solutions of the CGN–1 and CGN–2 complexes were also 9.81 × 10⁻⁴ M and 1.18 × 10⁻³ M and ε254 = 7.00 × 10³ dm3 mol−1 and ε256 = 2.21 × 10³ dm3 mol−1, respectively, by the Beer–Lambert law.
Preparation of the polysaccharide–1 and –2 complexes by the grinding method
Compound 1 or 2 (1.0 mg; 5.0 and 4.6 μmol, respectively) and CGN, PL, or GLU (10.0 mg) were placed in a ceramic mortar. The mixture was prepared by mild grinding for 30 min. The solid mixture was suspended in water (2.0 mL) to produce a white emulsion. After centrifugation (4500×g, 25 °C, 20 min), undispersed 1 or 2 was removed from the solution. The concentrations of 1 and 2 in the complexes with CGN, PL, or GLU were determined by using the same ε254 and ε256 of the aqueous solutions of the CGN–1 and CGN–2 complexes prepared by the HSVM method. The concentrations of 1 or 2 in the aqueous solution of the CGN–1, PL–1, GLU–1, CGN–2, PL–2, and GLU–2 complexes were determined to be 0.93, 0.70, 0.62, 0.93, 0.54, and 0.52 mmol L−1, respectively.Spectrophotometric assay
The absorbance spectra were recorded using a UV-3600 spectrophotometer (Shimadzu Corporation, Kyoto, Japan). The fluorescence spectra were obtained using an F-4500 fluorescence spectrophotometer (Hitachi Ltd, Tokyo, Japan). The excitation and emission wavelengths were set to 270 and 300–500 nm, respectively. The time-resolved photoluminescence lifetimes were determined using a time-correlated single photon counting lifetime spectroscopy system, Quantaurus-Tau C11367-02 (Hamamatsu photonics K. K., Shizuoka, Japan).Dynamic light scattering analysis
The hydrodynamic diameters and zeta potentials of the liposomes were measured using an electrophoretic light-scattering instrument, equipped with a laser Doppler system (Zetasizer Nano ZS, Malvern Instruments Ltd., Malvern, UK).Transmission electron microscopy
The 1−PLL complex was assessed by TEM using the negative staining method with ammonium molybdate (3.0 wt%). A solution of the complex was cast on a Cu100P grid coated with collodion films (thickness: 30–40 nm) supported by a carbon layer (thickness: 10–15 nm). The grid was pre-treated with low-energy plasma (DII-29020HD, JEOL Ltd., Tokyo, Japan) to hydrophilize the surface. The extra solution was removed using filter paper and subsequently air-dried. TEM observations were performed using the JEM-1400 system (JEOL Ltd., Tokyo, Japan) with an accelerating voltage of 80 kV.Lifetime measurements
The following two exponential emission decay models were applied to fit the whole image:where I(t) is the emission counts that were collected at time t after excitation; a1, a2, and a3 represent the corresponding amplitudes; and τ1, τ2, and τ3 are the lifetimes for the short and long components. An average emission lifetime, 〈τ〉, defined by the following equation was calculated:
The quality of the nonlinear curve fit was determined and statistically measured using the minimum reduced chi-squared (χ2). A value of 1.0 corresponds to a perfect fit.
Conclusions
We succeeded in preparing ASIS with crystallization-induced RTP using both the CGN–1 and CGN–2 complexes. The mean lifetime 〈τ〉 of the CGN–2 complex was longer than that of the CGN–1 complex. This was due to the solid state and the long-life of the triplet state, attributed to the inhibition of intramolecular motions (e.g., rotational and vibrational energy relaxation) by the intramolecular interactions of C–H⋯F.27 However, the 〈τ〉 values of the complexes were considerably shorter than those of 1 and 2 in the solid state. Therefore, compounds with longer RTP lifetimes should be employed to achieve extended emissions in the future.Conflicts of interest
There are no conflicts to declare.Acknowledgements
This work was supported by ACT-X (R. K., JPMJAX2225), Life Phenomena and Materials, from Japan Science and Technology Agency, by the Japan Society for the Promotion of Science, KAKENHI (R. K., JP19K15401 and JP22K18196) and Research Fellowship for Young Scientist (K. Y., 22J20442). The authors would like to thank Enago (https://www.enago.jp/) for the English language review.Notes and references
- C. S. Bilen, N. Harrison and D. J. Morantz, Nature, 1978, 271, 235–237 CrossRef CAS.
- A. Forni, E. Lucenti, C. Botta and E. Cariati, J. Mater. Chem. C, 2018, 6, 4603–4626 RSC.
- M. Hayduk, S. Riebe and J. Voskuhl, Chem.–Eur. J., 2018, 24, 12221–12230 CrossRef CAS PubMed.
- L. Huang, C. Qian and Z. Ma, Chem.–Eur. J., 2020, 26, 11914–11930 CrossRef CAS PubMed.
- Y. Gong, G. Chen, Q. Peng, W. Z. Yuan, Y. Xie, S. Li, Y. Zhang and B. Z. Tang, Adv. Mater., 2015, 27, 6195–6201 CrossRef CAS PubMed.
- Z. An, C. Zheng, Y. Tao, R. Chen, H. Shi, T. Chen, Z. Wang, H. Li, R. Deng, X. Liu and W. Huang, Nat. Mater., 2015, 14, 685–690 CrossRef CAS PubMed.
- Z. Yang, Z. Mao, X. Zhang, D. Ou, Y. Mu, Y. Zhang, C. Zhao, S. Liu, Z. Chi, J. Xu, Y. Wu, P. Lu, A. Lien and M. R. Bryce, Angew. Chem., Int. Ed., 2016, 55, 2181–2185 CrossRef CAS PubMed.
- Y. Gong, H. Chen, X. Ma and H. Tian, ChemPhysChem, 2016, 17, 1934–1938 CrossRef CAS PubMed.
- L. Xu, L. Zou, H. Chen and X. Ma, Dyes Pigm., 2017, 142, 300–305 CrossRef CAS.
- D. Li, F. Lu, J. Wang, W. Hu, X.-M. Cao, X. Ma and H. Tian, J. Am. Chem. Soc., 2018, 140, 1916–1923 CrossRef CAS PubMed.
- J.-J. Li, H.-Y. Zhang, Y. Zhang, W.-L. Zhou and Y. Liu, Adv. Opt. Mater., 2019, 7, 1900589 CrossRef CAS.
- X.-K. Ma, Y.-M. Zhang, Q. Yu, H. Zhang, Z. Zhang and Y. Liu, Chem. Commun., 2021, 57, 1214–1217 RSC.
- F.-F. Shen, Y. Chen, X. Dai, H.-Y. Zhang, B. Zhang, Y.-H. Liu and Y. Liu, Chem. Sci., 2021, 12, 1851–1857 RSC.
- S. Cai, H. Shi, J. Li, L. Gu, Y. Ni, Z. Cheng, S. Wang, W.-W. Xiong, L. Li, Z. An and W. Huang, Adv. Mater., 2017, 29, 1701244 CrossRef PubMed.
- W. Guo, X. Wang, B. Zhou and K. Zhang, Chem.–Asian J., 2020, 15, 3469–3474 CrossRef CAS PubMed.
- X.-K. Ma, W. Zhang, Z. Liu, H. Zhang, B. Zhang and Y. Liu, Adv. Mater., 2021, 33, 2007476 CrossRef CAS PubMed.
- W.-L. Zhou, W. Lin, Y. Chen, X.-Y. Dai, Z. Liu and Y. Liu, Chem. Sci., 2022, 13, 573–579 RSC.
- W.-L. Zhou, W. Lin, Y. Chen and Y. Liu, Chem. Sci., 2022, 13, 7976–7989 RSC.
- K. Y. Zhang, Q. Yu, H. J. Wei, S. J. Liu, Q. Zhao and W. Huang, Chem. Rev., 2018, 118, 1770–1839 CrossRef CAS PubMed.
- N. Gan, H. Shi, Z. An and W. Huang, Adv. Funct. Mater., 2018, 28, 1802657 CrossRef.
- S. Hino, K. Sugikawa, R. Kawasaki, H. Funabashi, A. Kuroda and A. Ikeda, ChemPhotoChem, 2020, 4, 577–581 CrossRef CAS.
- R. Omokawa, R. Kawasaki, K. Sugikawa, T. Nishimura, T. Nakaya and A. Ikeda, ACS Appl. Polym. Mater., 2021, 3, 3708–3713 CrossRef CAS.
- K. Takahashi, S. Umezane, T. Ono, S. Fukutomi, M. Ihara, Y. Hisaeda, R. Kawasaki and A. Ikeda, Chem.–Asian J., 2022, 17, e202200879 CrossRef CAS PubMed.
- A. Ikeda, M. Akiyama, K. Sugikawa, K. Koumoto, Y. Kagoshima, J. Li, T. Suzuki and T. Nagasaki, Org. Biomol. Chem., 2017, 15, 1990–1997 RSC.
- S. Hino, R. Funada, K. Sugikawa, R. Kawasaki, K. Koumoto, T. Suzuki, T. Nagasaki and A. Ikeda, ChemMedChem, 2021, 16, 793–803 CrossRef CAS PubMed.
- R. Kawasaki, S. Kawamura, S. Hino, K. Yamana and A. Ikeda, Mater. Adv., 2022, 3, 467–473 RSC.
- W. Z. Yuan, X. Y. Shen, H. Zhao, J. W. Y. Lam, L. Tang, P. Lu, C. Wang, Y. Liu, Z. Wang, Q. Zheng, J. Z. Sun, Y. Ma and B. Z. Tang, J. Phys. Chem. C, 2010, 114, 6090–6099 CrossRef CAS.
- M. Baroncini, G. Bergamini and P. Ceroni, Chem. Commun., 2017, 53, 2081–2093 RSC.
- S. Hino, S. Satake, H. Shinmori, S. Kawabata, K. Koumoto, T. Suzuki, T. Nagasaki, K. Sugikawa, R. Kawasaki and A. Ikeda, Chem.–Asian J., 2020, 15, 365–370 CrossRef CAS PubMed.
- K. Yamana, R. Kawasaki, K. Sugikawa and A. Ikeda, ACS Appl. Bio Mater., 2020, 3, 3217–3225 CrossRef CAS PubMed.
- A. Ikeda, K. Ashizawa, Y. Tsuchiya, M. Ueda and K. Sugikawa, RSC Adv., 2016, 6, 78505–78513 RSC.
- A. Ikeda, T. Iizuka, N. Maekubo, K. Nobusawa, K. Sugikawa, K. Koumoto, T. Suzuki, T. Nagasaki and M. Akiyama, Chem.–Asian J., 2017, 12, 1069–1074 CrossRef CAS PubMed.
- S. Hino, R. Funada, K. Sugikawa, K. Koumoto, T. Suzuki, T. Nagasaki and A. Ikeda, Photochem. Photobiol. Sci., 2019, 18, 2854–2858 CrossRef CAS PubMed.
Footnote |
| † Electronic supplementary information (ESI) available: Fluorescence and 1H NMR spectra and DLS measurements. See DOI: https://doi.org/10.1039/d2ra08205e |
| This journal is © The Royal Society of Chemistry 2023 |

