 Open Access Article
Electrochemical study on the effect of polar and non-polar extract of Artemisia vulgaris on the corrosion inhibition of mild-steel in an acidic medium
Nabin Karkiab,
Shova Neupane a,
Dipak Kumar Guptaac and
Amar Prasad Yadav*a
aCentral Department of Chemistry, Tribhuvan University, Kathmandu, Nepal. E-mail: amar.yadav@cdc.tu.edu.np
bBhaktapur Multiple Campus, Tribhuvan University, Bhaktapur, Nepal
cTri-Chandra Multiple Campus, Tribhuvan University, Kathmandu, Nepal
First published on 8th March 2023
Abstract
Electrochemical methods were used to characterize the inhibition efficacy of the extract of the high-altitude plant Artemisia vulgaris as an environmentally acceptable inhibitor for mild steel in 1.0 M H2SO4. The Artemisia vulgaris was extracted in hexane and methanol separately and applied on mild steel (MS) as an inhibitor. A detailed electrochemical characterization such as potentiodynamic polarization, open circuit potential, and electrochemical impedance spectroscopy (EIS) was performed on the MS surface covered with the extract molecules. The hexane extracts adsorbed slower to the MS surface than the methanol extract, but both molecular extracts showed similar corrosion inhibition efficacies (IE). The IE for 1000 ppm extract in hexane and methanol was 73.10% and 91.99%, respectively, after 0.5 hour immersion of MS, whereas it was 98.79% and 96.73% in hexane and methanol extract after 24 hours of immersion of MS in acidic medium. The IE of the methanol extract increased with concentration. From the EIS analytical analysis, adsorption of inhibitor molecules on the charge transfer kinetics was confirmed. The potentiodynamic polarization showed a decrease in current density with the concentration of methanol extract without affecting the Tafel slopes. ATR-FTIR of the extract indicated the presence of the different functionalities in it. Adsorption of the extract molecules on the metal surface obeyed the Langmuir adsorption isotherm. The computed value of ΔG* implies that the adsorption is of mixed type. The formation of a protective film of inhibitor molecules on the MS surface was confirmed from EIS and using a scanning electron microscope. The adsorption mechanism based on the experimental data supported by the thermodynamic calculations is highlighted in this article.
1. Introduction
Control of mild steel (MS) corrosion has been the prime focus for a long time as it is the most widely used metal in corrosive media.1,2 Deteriorations of the metallic and surface properties of metals or alloys by corrosion make them unsuitable for a specific application. One particular way to reuse them for further industrial processing is surface cleaning by using mineral acids like HCl or H2SO4.2 Acid solutions not only remove rust or scales, but they also attack the bare steel surface, wasting resources.2,3 An effective remedy for the problem has been the use of inhibitors which significantly retards the rate of corrosion and saves economic and material loss. In the recent past, many researchers have advocated using plant-derived inhibitors due to their cheap availability, accessible resources, and eco-friendly and non-toxic nature. Furthermore, plant-derived inhibitors are considered safe for humans and the environment during their extraction and applications.Phytochemicals present in plant extracts such as alkaloids, flavonoids, polyphenols, proteins, etc., are similar to typical organic molecules due to their resemblance in electronic and molecular features.4 The presence of heteroatoms like N, S, and O in coupled with sigma and pi bonds facilitates the adsorption of these large-sized complex phytochemicals on the metal surface to achieve corrosion inhibition.5 The adsorption capability of such inhibitor organic molecules on the model Cu3Au and Cu surfaces has been reported to be achieved by displacing water molecules and forming a self-assembled monolayer (SAM) that shields the exposed surface and inhibits the corrosion.2,6–8 Heteroatoms with unbounded electrons further aid the adsorption by the formation of a coordinate bond. Similarly, extracted molecules are rich source of electron that helps in transferring electrons to the unoccupied d-orbital of iron.8 Therefore, the efficiency of inhibitor molecules is influenced by the formation of chelate complexes, environment, and consequences of size effects that hinder the heteroatom approach.1,2 In addition, a synergistic effect between different functional groups of different compounds present in the extract has also been found to contribute to the higher corrosion inhibition efficacy of plant extract than a single molecule.9 Without purifying it into pure compounds, plant extract functions as an efficient inhibitor, making it a cheaper alternative. Therefore, the recent trend of research is concentrating on bulk plant extracts in developing environmentally-friendly corrosion inhibitors.
There is no dearth of literature dealing with plant extract as a corrosion inhibitor for MS.1,3–5,10–16 Nepal is rich in high-altitude endemic plants. Extracts of several high altitude plants of Nepal are found to be effective corrosion inhibitors for MS in acidic media, such as Equisetum hyemale,9 Berberis aristata,17 Lanata camara,18 Euphorbia royleana,19 Pogostemon benghalensis,20,21 Jatropha curcas,22 Eucalyptus globulus.23 In this study, Artemisia vulgaris (family: Asteraceae), a high-altitude plant, is studied as a green corrosion inhibitor for MS in an acidic medium. It is a perennial tall herbaceous plant found along roadsides and waste areas, preferably in sunny places. It is distributed in Europe, Asia, northern Africa, Alaska, and North America. Phytochemical screening of methanolic extract of the plant has shown to contain alkaloids and flavonoids in large amounts, tannin, saponin, quinone, sterols, and terpenoid in moderate amounts, cardiac glycoside, reducing sugar and protein in fewer amounts.24 Methanolic extract of the plant contains organic molecules such as serotonin, prunacin, N,N-dimethyl-4-nitroso-3-trimethylsilylaniline, luteolin, morin, camphor etc.24–26 Hexane extract of the plant contains alkaloids, volatile oils, sterols, triterpenes, fatty acids, coumarins, flavones and, quinones.27,28 Since the extract contains alkaloids and flavonoids in good amount, it could be a good corrosion inhibitor. In this regard, in our previous study, we have reported the corrosion inhibition efficiency of methanol extract of Artemisia vulgaris by weight loss method.29 But the results were only preliminary and more detail study by electrochemical methods were needed to understand it corrosion inhibition efficacy. Therefore, this work aims to investigate corrosion inhibition efficacy of methanol and hexane extracts of Artemisia vulgaris as an environmentally acceptable inhibitor for mild steel in acidic medium by electrochemical methods.
2. Experimental
2.1 Extract and sample preparation
The aerial parts of Artemisia vulgaris, were gathered from Gundu, Bhaktapur, Nepal having the coordinates of latitude: 27°38′59.3′′ N, longitude: 84°24′55.1′′ E, and altitude: 1402 m. The collected parts were cleaned with deionized water and chopped into pieces. It was shade dried in open air for four weeks. Then, it was pulverized into a finer powder mass using an electric grinder. 200 g of powder was extracted with methanol and hexane separately. The powder was dipped well in methanol or hexane and shaken occasionally to mix for 3 days at room temperature (RT). After soaking, the mixture was filtered and the filtrate was collected, clear supernatant liquid was obtained after several repetition of the process. The filtrate was concentrated using a rotary evaporator (IKA RV-10). Artemisia vulgaris extract (AVE) was obtained as a dense residue by drying the concentrated filtrate using a water bath. Extracts were obtained in methanol (M–AVE) and hexane (H–AVE) separately. For corrosion test, 1000 ppm extract solution was first prepared in lukewarm 1.0 M H2SO4. Inhibitor solutions of 800, 600, 400, and 200 were prepared by serial dilution of the 1000 ppm solution by using 1.0 M H2SO4.A mild steel (MS) sheet was cut into small coupons of size 2 cm × 2 cm. The coupons were wet polished with silicon carbide using doubled distilled water (grit size 100 to #1200). The polished MS specimens were cleaned with deionized water, ultrasonicated in ethanol for 10 minutes. Then, it was air dried quickly with the help of a blower.
2.2 Electrochemical characterization
A three-electrode cylindrical glass cell connected to a Gamry Potentiostat electrochemical workstation (Reference 600) was used. The working electrode was a polished MS coupon with a working surface area of 0.608 cm2, the reference electrode was a saturated calomel electrode (SCE), and the auxiliary electrode was a platinum wire. This paper reports all the potential values with reference to SCE. Prior to each electrochemical experiment, the working electrode was left to stabilize at open circuit potential (OCP) for 30 min.For electrochemical impedance measurements (EIS), a sine wave voltage of 10 mV amplitude was superimposed at OCP in the frequencies between 100 kHz and 0.01 Hz. The charge transfer resistance (Rct) was estimated from the diameter of the semicircle of Nyquist plot, and inhibition efficiency (IE) of AVE was calculated by the eqn (1):11
 | (1) |
The MS specimens were potentiodynamically polarized in various concentrations of AVE in the potential window of ±300 mV from OCP at a sweep rate of 0.5 mV s−1. The polarization curves were used to compute the cathodic and anodic slopes. The Tafel extrapolation method was used to calculate the corrosion potential (Ecorr) and corrosion current density (icorr). The values of icorr in the absence and presence of plant extract were used to calculate IE using eqn (2).11
 | (2) |
2.3 Surface characterization
The surface of the MS specimen immersed in 1.0 M H2SO4 for 24 h in the absence and presence (400 and 1000 ppm) of plant extract was observed using a Bio-Logic modular scanning electrochemical microscope (M470 Ac-SECM). After retrieval from the test solution, the surface of the MS specimens was cleaned in running water with the help of a brush to remove corrosion products, degreased with acetone, dried, and preserved in desiccators. The specimen surface was gold-coated to obtain high-quality images. Surface analyses of specimens were performed at different locations to assure reproducibility of the results.The plant extract was analyzed by an IRAffinity-1S Shimadzu Fourier transform infrared (FTIR) spectrometer to assign the various functional groups present in it. This model operates in attenuated total reflectance (ATR) mode.
3. Results and discussion
3.1 Effect of solvent on adsorption efficiency
There are limited studies on the effect of polar and non-polar plant extracts on corrosion inhibition efficacy. In this study, Artemisia vulgaris was extracted in hexane and methanol solvents, and their effects on inhibition efficacy on MS were investigated by making cathodic and anodic polarizations of metal coupon in 1.0 M H2SO4 in the presence and absence of 1000 ppm AVE. Polarization measurements were carried out in the range of ±0.3 V from OCP with a scan rate of 0.5 mV s−1, and the polarization started from a cathodic limit to anodic limit. The results are presented in Fig. 1 for an immersion period of 0.5 h and 24 h. Table 1 lists the various polarization parameters to characterize the corrosion behaviors.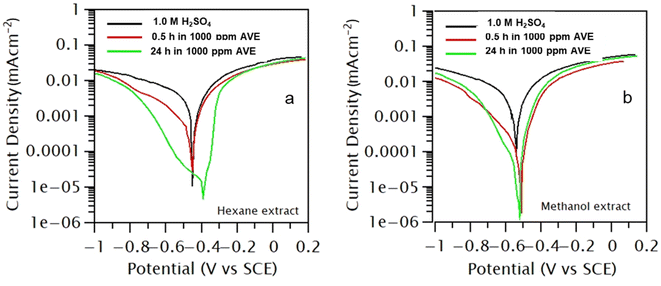 | ||
| Fig. 1 (a) Polarization of mild steel in the hexane extract of A. vulgaris in 1.0 M H2SO4, (b) polarization of mild steel in methanol extract of A. vulgaris in 1.0 M H2SO4. | ||
| Electrolyte | Immersion time (h) | Hexane | Methanol | ||||
|---|---|---|---|---|---|---|---|
| Ecorrr (V) | icorr (A cm−2) | IE (%) | Ecorr (V) | icorr (A cm−2) | IE (%) | ||
| Acid | 0.5 | 0.454 | 8.02 × 10⁻⁴ | 0.474 | 9.57 × 10⁻⁴ | ||
| Acid + AVE 1000 ppm | 0.5 | 0.448 | 2.16 × 10⁻⁴ | 73.10 | 0.443 | 6.42 × 10⁻⁵ | 91.99 |
| Acid + AVE 1000 ppm | 24 | 0.408 | 9.64 × 10⁻⁶ | 98.79 | 0.476 | 3.13 × 10⁻⁵ | 96.73 |
Polarization curves and observed data obtained for AVE in both solvents imply that both hydrogen evolution and metal dissolution were suppressed in the presence of AVE molecules. However, the addition of AVE did not affect cathodic and anodic slopes, suggesting that inhibitor molecules block the active sites of corrosion by establishing a barrier film.14,30 There was no regular tendency in the evolution of Ecorr value, and the shift of Ecorr was less than 85 mV which suggests that AVE works as a mixed type of inhibitor.15
icorr values decreased significantly with the time of immersion in both cases. IE calculated for n-hexane extract was 73.10% and 98.79% for immersion times of 0.5 and 24 h, respectively. At the same time, it was 91.99% and 96.73% for the same immersion time in methanol extract. These results show that the inhibition effect of methanol extract was quicker than hexane extract. On the contrary, the IE in hexane was marginally better in a more extended immersion period. The low IE of hexane extract compared to methanol extract in a shorter immersion period can be explained based on the interaction of polar molecules in the extract with a non-polar solvent. Such interaction will lead to a micelle-like structure of polar molecules with non-polar groups facing outward and bonding with a non-polar solvent. When placed in a polar solvent, this micelle structure must slowly undergo an inversion process, and therefore its adsorption on the metal surface becomes slow. However, in the long run, these molecules might not be easily desorbed from the metal surface, and therefore IE will be higher. This study shows that non-polar solvent can also be used to extract inhibitor molecules. But, the obtained amount of hexane extract was less than methanol extract. Therefore, Artemisia vulgaris extract in methanol solvent was selected for further study. We understand that irrespective of the solvent used for extraction, the major constituents of the extract remain the same.
3.2 Electrochemical characterizations in M–AVE
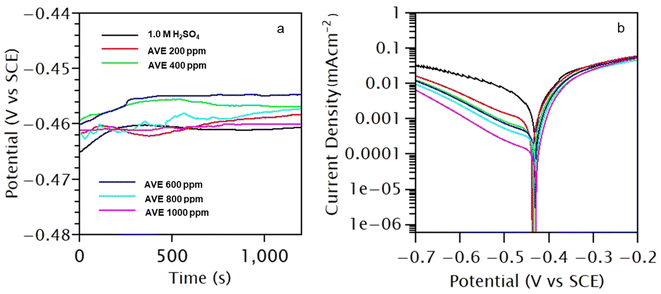
The change of OCP vs. SCE of MS coupon in 1.0 M H2SO4 in absence and presence of M–AVE of varying concentrations is shown in Fig. 2a. A marginal shift in OCP towards a positive direction was observed with the addition of M–AVE, which can be ascribed to the formation of barrier film on the MS surface due to the adsorption of molecules present in M–AVE.12 However, the shift in OCP was not enough (<85 mV) to classify it as an anodic inhibitor. So, it acted as a mixed-type inhibitor.31 The fluctuations in OCP till 900 s show the adsorption–desorption nature of the M–AVE molecules, which stabilize after that.Fig. 2b depicts the anodic and cathodic polarization curves of MS after 30 min immersion in 1.0 M H2SO4 in the absence and presence of varying concentrations of M–AVE. From the polarization curves, the electrochemical parameters viz. corrosion current (icorr), corrosion potential (Ecorr), cathodic slope (βc), and anodic slope (βa) were obtained by making Tafel extrapolation. The estimated values are presented in Table 2.
| Concentration (ppm) | −Ecorr (V (SCE)) | icorr (A cm−2) | βa (V dec−1) | −βc (V dec−1) | IE (%) | Surface coverage (θ) |
|---|---|---|---|---|---|---|
| Blank | 0.4281 | 1.93 × 10⁻³ | 0.0603 | 0.1122 | ||
| 200 | 0.4377 | 5.94 × 10⁻⁴ | 0.0329 | 0.1785 | 69.23 | 0.6923 |
| 400 | 0.4347 | 4.31 × 10⁻⁴ | 0.0404 | 0.171 | 77.72 | 0.7772 |
| 600 | 0.4348 | 3.14 × 10⁻⁴ | 0.0387 | 0.1638 | 83.76 | 0.8376 |
| 800 | 0.431 | 2.53 × 10⁻⁴ | 0.0326 | 0.1657 | 86.94 | 0.8694 |
| 1000 | 0.4305 | 1.12 × 10⁻⁴ | 0.0242 | 0.1616 | 94.21 | 0.9421 |
It is evident from the polarization curves that cathodic curves were highly suppressed compared to anodic curves with the addition of M–AVE. The parallel nature of the cathodic curves indicated that the hydrogen reduction reaction was activation-controlled, which did not change the reduction mechanism.32,33 With an increase in M–AVE concentration, the icorr decreased, and suppression was maximum (about 17 times) in 1000 ppm solution where IE was 94.21%. It can be inferred from the results that the adsorption of molecules of M–AVE onto the MS surface led to the formation of a barrier film blocking the active site of corrosion.14,30
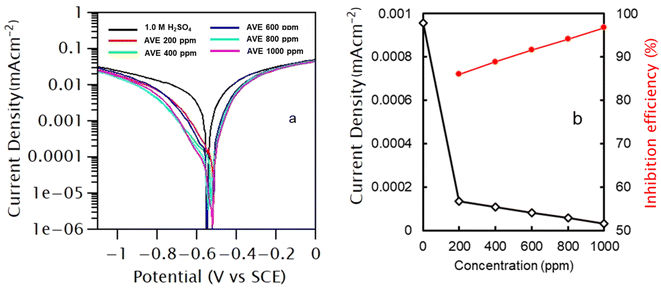
In order to check the effect of immersion time of MS in M–AVE solution, polarization measurements were conducted after 24 h immersion in test solution without and with various amount of M–AVE. Fig. 3a depicts the polarization curves in 1.0 M H2SO4 without and with AVE of different concentrations after 24 hours of immersion. The values of icorr, Ecorr, βc, and βa obtained from the Tafel extrapolation method of the polarization curve are presented in Table 3. The icorr and IE variation with M–AVE concentration is shown in Fig. 3b.
| Concentration (ppm) | −Ecorr (V (SCE)) | icorr (A cm−2) | βa (V dec−1) | −βc (V dec−1) | IE% |
|---|---|---|---|---|---|
| Blank | 0.474 | 9.57 × 10⁻⁴ | 0.08 | 0.11 | |
| 200 | 0.472 | 1.34 × 10⁻⁴ | 0.081 | 0.103 | 86.01 |
| 400 | 0.465 | 1.07 × 10⁻⁴ | 0.06 | 0.156 | 88.87 |
| 600 | 0.454 | 8.02 × 10⁻⁵ | 0.057 | 0.166 | 91.63 |
| 800 | 0.462 | 5.62 × 10⁻⁵ | 0.054 | 0.1219 | 94.13 |
| 1000 | 0.476 | 3.13 × 10⁻⁵ | 0.056 | 0.104 | 96.73 |
The results reveal that unlike in a short time of immersion, in a longer immersion period, both cathodic hydrogen evolution and anodic metal dissolution process were suppressed with the addition of M–AVE. However, similar to the short time of immersion, the observed cathodic curves were parallel to each other, indicating no change in the reduction mechanism. The immersion time did not change the Ecorr value. The extension of immersion time has lowered the icorr by about 30 times, giving an IE of 96.73% in 1000 ppm M–AVE. Fig. 4 compares the IE offered by M–AVE with reference to concentrations and time of immersion. Results divulge that at 200 ppm of M–AVE, IE differs by about 16% for immersion times of 0.5 h and 24 h, which almost became equal after 24 h immersion. Therefore, optimization of time and concentration for the effective functioning of the inhibitor molecules is essential.
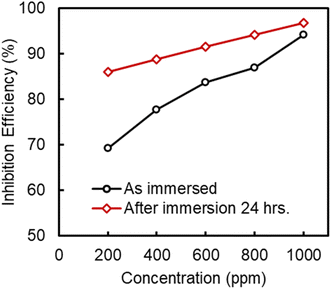 | ||
| Fig. 4 Comparison of inhibition efficiency of Artemisia vulgaris extract in methanol when metal sample immersed and not immersed. | ||
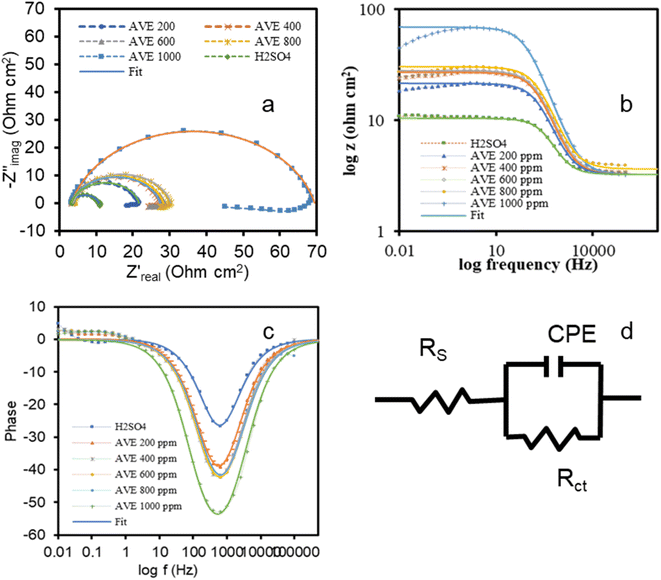
To further understand the inhibition action of M–AVE on MS, EIS measurements were carried out, and the results are presented in Fig. 5a–c. In the plots, experimental data are represented by solid symbol while fitting results are represented by solid line. Fitting was done by using an electrical equivalent circuit shown in Fig. 5d consisting of a simple Randle's circuit.
A single depressed capacitive loop at high frequency and an inductive loop at low frequency are very obvious in all the cases. There is no change in the shape of the plot with the addition of M–AVE except an increase in the diameter of the semicircle with the concentrations of M–AVE. The comparable shape of EIS plots with the addition of inhibitor molecules in varying amount suggests the existence of a single time constant.34 Thus, the addition of M–AVE does not change the corrosion mechanism.35 The adsorption of molecules of M–AVE gives rise to a depressed capacitive loop representing a non-homogeneous solid surface.34 The appearance of expanding inductive loops with concentration of M–AVE in low frequencies reflects the adsorption–desorption behavior of M–AVE molecules. It is also conceivable because of the formation of species such as [FeSO4(ads)2−], [FeOH]−, and [FeH]+ involving inhibitor molecules which stabilizes the surface.6,36 The re-dissolution of the passivated surface also results in inductive behavior at low frequency.37
The adsorption of molecules of M–AVE results in increasing the phase angle in the Bode-phase plot as seen in Fig. 5c. As the concentration of M–AVE increases, the phase shift increases, indicating for better coverage of the surface and hence IE also increases.38,39
In the equivalent circuit, Fig. 5d, a constant phase element (CPE) is used instead of a pure capacitor to consider the frequency dispersion phenomenon and electrode surface non-homogeneity.5,40–42 Electrochemical parameters obtained by fitting EIS data and calculated IE are presented in Table 4.
| Concentration (ppm) | Rs (Ω cm2) | CPE (μΩ−1 Sn cm−2) | n | Rct (Ω cm2) | IE% |
|---|---|---|---|---|---|
| Blank (0) | 3.26 | 180.81 | 0.874 | 7.29 | |
| 200 | 3.238 | 126.49 | 0.857 | 18.28 | 60.12 |
| 400 | 3.265 | 109.65 | 0.852 | 24.00 | 69.63 |
| 600 | 3.27 | 106.30 | 0.846 | 25.03 | 70.87 |
| 800 | 3.65 | 95.53 | 0.845 | 26.60 | 82.59 |
| 1000 | 3.23 | 73.60 | 0.845 | 66.20 | 88.99 |
The impedance of CPE is described by eqn (3):43
| ZCPE = Y0−1(jω)−n | (3) |
The estimated values of CPE and IE are plotted in Fig. 6 against the concentration of M–AVE. It is observed that the value of CPE steadily decreased with the concentrations of M–AVE as more and more water dipoles are displaced by large size inhibitor molecules thereby enlarging the width of the double layer. This results in the establishment of protective layer on the metal surface. The local dielectric constant can also be decreased by the displacement of water dipoles, a factor for decreasing the CPE value.2,6 Therefore, a higher concentration of M–AVE implies the formation of a thicker electric double layer. Hence IE increased with an increase in the concentration of inhibitor molecules.46
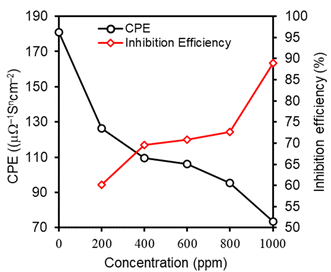 | ||
| Fig. 6 Variation of inhibition efficiency and constant phase element with the variation of concentration of AVE. | ||
3.3 Adsorption isotherm
Adsorption isotherm is essential in knowing the mode and interaction degree between M–AVE and MS surface molecules. The driving force for the adsorption of inhibitor molecules onto the metal surface is the stronger affinity of the inhibitor molecules to the MS surface compared to that between water molecules and the MS surface. Some of the factors that affect adsorption of inhibitor molecules are their structure, chemical composition, potential difference developed at the metal/solution phase boundary and temperature of the medium. The inhibitor molecules are adsorbed on metal surface in a quasi-substitution process4,34 for the displacement of n water dipoles by an inhibitor molecule:| Extract (sol) + nH2O (surface) → extract (surface) + nH2O (sol) |
The IE value was used to calculate the extent of surface coverage (θ) by eqn (4).16
 | (4) |
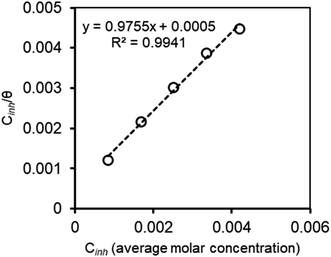
Thus, obtained θ was plotted against amount of M–AVE to find out the suitable adsorption isotherm. M–AVE was a crude plant extract containing a mixture of several organic molecules. All the molecules might affect the inhibitive action of the inhibitor positively or negatively. However, the concentration used to fit suitable adsorption models is the average molar concentration of a few essential compounds, which is vital in inhibition.16,17 Among the various adsorption isotherms, Langmuir adsorption isotherm was found to best explain the adsorption behavior of inhibitor molecules as can be seen from Fig. 7. Relation of Langmuir adsorption isotherm is shown in eqn (5).
 | (5) |
Langmuir adsorption isotherm conform to the formation of a monolayer of inhibitor molecules.47 Little deviation from perfect linearity in Fig. 7 hints to some kind of interactions (attraction, repulsion or cathodic and anodic site specific adsorption) between adsorbed inhibitor molecules on the mild steel surface.34
The free energy of adsorption (ΔG°) can be estimated from eqn (6)
ΔG° = −RT![[thin space (1/6-em)]](https://www.rsc.org/images/entities/char_2009.gif) ln(55.5Kads) ln(55.5Kads)
| (6) |
By inputting constant values, the  is calculated to be −27.62 kJ mol−1. This
  value implies a spontaneous adsorption of the molecules of M–AVE on mild steel surface forming a highly stable barrier film.4,41 It is accepted that ΔG° having −20 kJ mol−1 or less hints to physisorption while chemisorption relates to a value of ΔG° greater than or around −40 kJ mol−1. Here, the computed value is intermediate, which implies that the adsorption is not merely physical or chemical but involves both. Adsorption involves physical adsorption with displacement of water molecules from the mild steel surface followed by chemisorption.4,5,42,47
3.4 Surface analysis
SEM images of the MS specimen corroded in different condition is represented in Fig. 8 with its initial state (Fig. 8a). The sample was immersed in 1.0 M H2SO4 containing 400 and 1000 ppm of M–AVE for 24 h. SEM image displays extensive destruction of the MS surface without M–AVE (Fig. 8b). In contrary, MS surface immersed in M–AVE, showed a comparatively less destructive due to the coverage surface by M–AVE. Fig. 8c and d represent the highly concentrated M–AVE solution showed a slightly better protection as compared to the lower concentrated solution. This suggests the formation of the protective film of M–AVE on the surface of MS. The EDX of different surface spot showed nitrogen, oxygen, and phosphorus on the MS surface with M–AVE was published elsewhere.29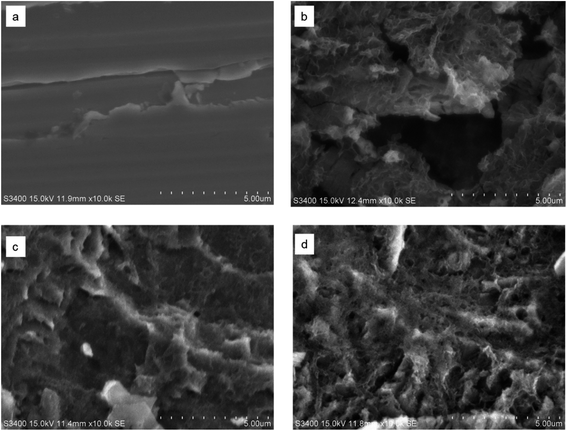 | ||
| Fig. 8 Surface morphology of MS (a) before exposure to 1.0 M H2SO4 (b) immersed in 1.0 M H2SO4 for 4 h, (c) immersed in 400 ppm M–AVE and (d) immersed in 1000 ppm M–AVE. | ||
3.5 ATR-FTIR analysis
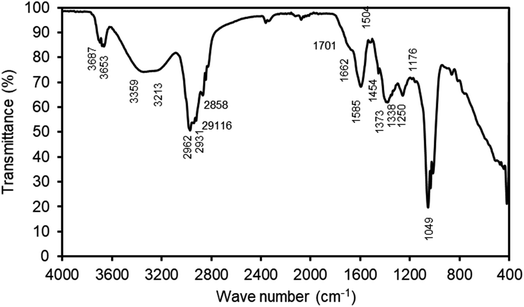
The ATR-FTIR spectrum of the methanol extract of Artemisia vulgaris displaying various functionalities is shown in Fig. 9. Absorption peaks at 3687 cm−1 and 3653 cm−1 are due to N–H bond stretching of amide and O–H bond stretching of alcohol, respectively. It indicates the presence of nitrogenous compounds like serotonin, prunacin as major compounds in the extract which are also reported in ref. 24–26. The overlying of various types of O–H bond stretching together with stretching of amine (N–H) give rise to a broad spectrum from 3359 to 3213 cm−1. The C–H stretching of alkane has resulted in a band at 2962 cm−1 and minor bands at 2931 cm−1, 2916 cm−1, and 2858 cm−1. The C![[double bond, length as m-dash]](https://www.rsc.org/images/entities/char_e001.gif) O stretching results in a band at 1701 cm−1. Similarly, C
O stretching results in a band at 1701 cm−1. Similarly, C![[double bond, length as m-dash]](https://www.rsc.org/images/entities/char_e001.gif) C stretching of alkene, cyclic alkene, C
C stretching of alkene, cyclic alkene, C![[double bond, length as m-dash]](https://www.rsc.org/images/entities/char_e001.gif) N stretching, imine, oxime, etc. has resulted in a band at 1662 cm−1, which also supports for the presence of nitrogenous compounds. The N–H bending of amine produces a sharp absorption peak at 1585 cm−1. Similarly, N–O stretching gives an absorption band at 1504 cm−1. The C–H bending of alkane give rise to band at 1454 cm−1. O–H bending of alcohol, phenol, and S
N stretching, imine, oxime, etc. has resulted in a band at 1662 cm−1, which also supports for the presence of nitrogenous compounds. The N–H bending of amine produces a sharp absorption peak at 1585 cm−1. Similarly, N–O stretching gives an absorption band at 1504 cm−1. The C–H bending of alkane give rise to band at 1454 cm−1. O–H bending of alcohol, phenol, and S![[double bond, length as m-dash]](https://www.rsc.org/images/entities/char_e001.gif) O stretching of sulfonate is characterized by an absorption band at 1373 cm−1. The presence of alkyl, aryl ether, or aromatic ester is indicated by C–O stretching band at 1250 cm−1. Additionally, an absorption peak at 1176 cm−1 is ascribed to C–O stretching of ester and tertiary alcohol, and a band at 1049 is attributed to S
O stretching of sulfonate is characterized by an absorption band at 1373 cm−1. The presence of alkyl, aryl ether, or aromatic ester is indicated by C–O stretching band at 1250 cm−1. Additionally, an absorption peak at 1176 cm−1 is ascribed to C–O stretching of ester and tertiary alcohol, and a band at 1049 is attributed to S![[double bond, length as m-dash]](https://www.rsc.org/images/entities/char_e001.gif) O stretching of sulfoxide, C–N stretching of amine, or S
O stretching of sulfoxide, C–N stretching of amine, or S![[double bond, length as m-dash]](https://www.rsc.org/images/entities/char_e001.gif) O stretching of sulfoxide. The presence of these absorption bands reveal that the extract contains functional groups such as alcohol, phenol, amine, amide, ether, ester, and others, as well as aromatic rings containing heteroatoms such as N and O, making it an excellent candidate for use as a corrosion inhibitor.48
O stretching of sulfoxide. The presence of these absorption bands reveal that the extract contains functional groups such as alcohol, phenol, amine, amide, ether, ester, and others, as well as aromatic rings containing heteroatoms such as N and O, making it an excellent candidate for use as a corrosion inhibitor.48
3.6 Corrosion inhibition mechanism
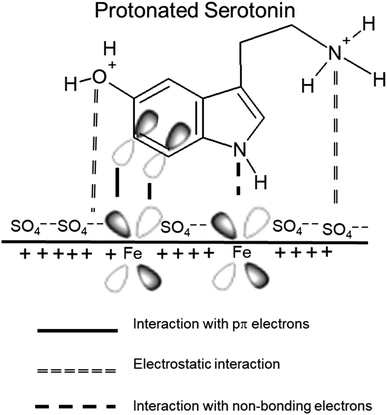
Corrosion inhibition by organic compounds is due to barrier film formation on the metal surface due to adsorption. The value of free energy of activation (–27.62 kJ mol−1) suggests that the adsorption of molecules present in M–AVE is comprehensive adsorption involving both chemisorption and physisorption. The mechanism of corrosion inhibition by adsorption of these molecules can be explained as follows based on the results obtained:The OCP value is a good indication of the charge on the MS surface. An average OCP value of −0.45 V was observed in the present study, which is nobler compared to the potential of zero charges (PZC) of mild steel in sulfate solution.49 Therefore, according to Antropov's concept, the MS surface should acquire a net positive charge.40 Generally, attraction of a proton by lone pair of electrons on heteroatoms makes organic molecules positively charged, and the possibility of their adsorption on a positive metal surface is negligible due to electrostatic repulsion. But, in acidic solution, anion left by acid like sulfate ion is adsorbed first on metal surface due to small degree of hydration forming negatively charged metal surface, which makes feasible for the adsorption of positively charged inhibitor molecules to metal surface due to electrostatic force of attraction. It implies that the adsorption is made feasible due to synergism with sulfate ion. This causes a build-up of negative charge along the interface, which facilitates the adsorption of positively charged protonated inhibitor molecules. Thus, the positively charged organic molecules of M–AVE are adsorbed via electrostatic force of attraction with sulfate ion.5,40,41,50 This adsorption of molecules on the MS surface competes with the H+ ion on the cathodic site of the MS surface. This ultimately leads to the suppression of cathodic hydrogen evolution.40 But this leaves behind neutral organic molecules from positively charged previously. This makes the neutral organic molecules to donate electrons to vacant d-orbital of metal, establishing a coordinate bond.51,52 HSAB (hard and soft acid and base) theory also supports strong interaction between the organic molecule and MS surface. Metal in zero oxidation state behaves as a soft acid and the inhibitor molecules behave as a soft base, and interaction between soft acid and soft base is stronger and fast.47 In the process, the metal gives back electron from its 4s or 3d orbital to the lowest unoccupied molecular orbital (LUMO) of inhibitor molecules so that metal surface does not retain extra negative charge. It is generally accepted that such retro-donation bolsters the chemisorption.5,47,51,52 A schematic representation of the adsorption of serotonin as an example is shown in Fig. 10. It is a diagrammatic sketch of the mechanism of serotonin as it is one of the main constituents present in the extract.
Chelation of organic molecules with Fe2+ ions result in a stable and insoluble complex on the metal surface. This forms the basis for the corrosion inhibition. In low inhibitor concentration, the numbers of such complex molecules are less and cannot prevent corrosion significantly. However, increases in concentration increase the number of complex molecules, decreasing the solubility of the protective layer formed and inhibiting corrosion. It explains the high inhibition efficiency of M–AVE at higher concentrations.53
4. Conclusions
Extract of Artemisia vulgaris in n-hexane shows slower adsorption of molecules compared to that in methanol. The methanol extract of Artemisia vulgaris shows a decrease in icorr and CPE value and an increase in Rct, phase angle, and magnitude of impedance. A maximum IE of 94.21% is obtained for 1000 ppm M–AVE solution in 1.0 M H2SO4. The inhibition property of M–AVE is due to the adsorption of organic molecules present in it. Adsorption follows Langmuir adsorption isotherm, indicating monolayer adsorption of inhibitor molecules without interaction with the metal. The intermediate value of proves the occurrence of both physical and chemical adsorption. The inhibitor molecules suppress both cathodic hydrogen evolution and anodic metal dissolution reactions equally. SEM and EIS confirm the formation of an adsorbed layer on the metal surface that inhibits the corrosion.
Conflicts of interest
All the authors have read and approved the manuscript. There are no known conflicts of interest associated with this research work, and there has been no financial support for this work that could have influenced its outcome.Acknowledgements
One of the authors (N. Karki) is thankful to the Nepal Academy of Science and Technology (NAST) for PhD grants. Prof. V. S. Raja at Indian Institute of Technology, Bombay, India, is acknowledged for allowing to perform EIS and SEM-EDX.References
- A. Ostovari, S. M. Hoseinieh, M. Peikari, S. R. Shadizadeh and S. J. Hashemi, Corros. Sci., 2009, 51, 1935–1949 CrossRef CAS.
- M. Murmu, S. K. Saha, N. C. Murmu and P. Banerjee, Corros. Sci., 2019, 146, 134–151 CrossRef CAS.
- X. Zuo, W. Li, W. Luo, X. Zhang, Y. Qiang, J. Zhang, H. Li and B. Tan, J. Mol. Liq., 2021, 321, 114914 CrossRef CAS.
- H. Cang, Z. Fei, J. Shao, W. Shi and Q. Xu, Int. J. Electrochem. Sci., 2013, 8, 15 Search PubMed.
- Y. Qiang, S. Zhang, B. Tan and S. Chen, Corros. Sci., 2018, 133, 6–16 CrossRef CAS.
- F. Bentiss, M. Bouanis, B. Mernari, M. Traisnel, H. Vezin and M. Lagrenée, Appl. Surf. Sci., 2007, 253, 3696–3704 CrossRef CAS.
- S. Neupane, N. A. Rivas, P. Losada-Pérez, J. D'Haen, H. Noei, T. F. Keller, A. Stierle, M. Rudolph, A. Terfort, O. Bertran, D. Crespo, A. Kokalj and F. U. Renner, npj Mater. Degrad., 2021, 5, 29 CrossRef CAS.
- G. Khan, K. M. S. Newaz, W. J. Basirun, H. B. M. Ali, F. L. Faraj and G. M. Khan, Int. J. Electrochem. Sci., 2015, 10, 6120–6134 CAS.
- N. Karki, S. Neupane, Y. Chaudhary, D. K. Gupta and A. P. Yadav, Int. J. Corros. Scale Inhib., 2021, 10(1), 206–227 CAS.
- A. Singh, I. Ahamad and M. A. Quraishi, Arab. J. Chem., 2016, 9, S1584–S1589 CrossRef CAS.
- R. A.-M. Saedah, Afr. J. Pure Appl. Chem., 2014, 8, 9–22 CrossRef.
- N. A. Odewunmi, S. A. Umoren and Z. M. Gasem, J. Environ. Chem. Eng., 2015, 3, 286–296 CrossRef CAS.
- R. Karthik, P. Muthukrishnan, A. Elangovan, B. Jeyaprabha and P. Prakash, Adv. Civ. Eng. Mater., 2014, 3, 20140010 Search PubMed.
- B. Hafez, M. Mokhtari, H. Elmsellem and H. Steli, Int. J. Corros. Scale Inhib., 2019, 8(3), 573–585 CAS.
- H. Elmsellem, Y. E. Ouadi, M. Mokhtari, H. Bendaif, H. Steli, A. M. Almehdi, I. Abdel-Rahman, H. S. Kusuma and B. Hammouti, J. Chem. Tech, Met., 2019, 54(4), 742–749 CAS.
- A. Y. El-Etre, Mater. Chem. Phys., 2008, 108, 278–282 CrossRef CAS.
- N. Karki, S. Neupane, Y. Chaudhary, D. K. Gupta and A. P. Yadav, Bioanal. Electrochem., 2020, 12, 19 Search PubMed.
- P. R. Shrestha, H. B. Oli, B. Thapa, Y. Chaudhary, D. K. Gupta, A. K. Das, K. B. Nakarmi, S. Singh, N. Karki and A. P. Yadav, Eng. J., 2019, 23, 205–211 CrossRef CAS.
- B. Thapa, D. K. Gupta and A. P. Yadav, J. Nepal Chem. Soc., 2019, 40, 25–29 CrossRef.
- Y. Chaudhary, N. Karki and A. P. Yadav, J. Nepal Chem. Soc., 2016, 35, 139 Search PubMed.
- P. C. Lama, Y. Chaudhary, N. Karki and A. P. Yadav, J. Nepal Chem. Soc., 2016, 34, 120 Search PubMed.
- D. K. Gupta, K. A. Kafle, A. K. Das, S. Neupane, A. Ghimire, B. D. Yadav, Y. Chaudhari, N. Karki and A. P. Yadav, J. Nepal Chem. Soc., 2020, 41, 87–93 CrossRef.
- D. K. Gupta, L. Awasthi, A. K. Das, B. Yadav, A. Ghimire and A. P. Yadav, Tribhuvan Univ. J., 2020, 35, 1–10 CrossRef.
- B. P. Pandey, R. Thapa and A. Upreti, Asian Pac. J. Trop. Med., 2017, 10, 952–959 CrossRef CAS PubMed.
- K. Abu-Shandi and H. Al-Marahleh, J. Chem. Pharm. Res., 2017, 9(4), 126–133 CAS.
- M. Ur Rashid, M. Alamzeb, S. Ali, Z. Ullah, Z. A. Shah, I. Naz and M. R. Khan, Phytother. Res., 2019, 33, 2661–2684 CrossRef CAS PubMed.
- K. R. Giri, B. Gc, D. Kharel and B. Subba, J. Plant Sci., 2014, 2(1), 77–81 Search PubMed.
- A. P. Kumar and U. Kumud, Int. J. Ayurveda Res., 2010, 1, 6 Search PubMed.
- N. Karki, Y. Chaudhary and A. P. Yadav, J. Nepal Chem. Soc., 2018, 38, 76–85 CrossRef.
- G. Fekkar, F. Yousfi, H. Elmsellem, M. Aiboudi, M. Ramdani, I. Abdel-Rahman, B. Hammouti and L. Bouyazza, Int. J. Corros. Scale Inhib., 2020, 9(2), 446–459 CAS.
- O. L. Riggs Jr, Corrosion Inhibitors, ed. C.C. Nathan, Houston, 2nd edn, 1973 Search PubMed.
- K. Chkirate, K. Azgaou, H. Elmsellem, B. El Ibrahimi, N. K. Sebbar, E. H. Anouar, M. Benmessaoud, S. El Hajjaji and E. M. Essassi, J. Mol. Liq., 2021, 321, 114750 CrossRef CAS.
- B. Tan, S. Zhang, Y. Qiang, W. Li, H. Li, L. Feng, L. Guo, C. Xu, S. Chen and G. Zhang, J. Mol. Liq., 2020, 298, 111975 CrossRef CAS.
- C. B. Verma and M. A. Quraishi, Int. J. Innov. Res. Sci. Eng. Technol., 2014, 3, 14601–14613 Search PubMed.
- A. Alagta, I. Felhösi, I. Bertoti and E. Kálmán, Corros. Sci., 2008, 50, 1644–1649 CrossRef CAS.
- M. A. Velázquez-González, J. G. Gonzalez-Rodriguez, M. G. Valladares-Cisneros and I. A. Hermoso-Diaz, Am. J. Anal. Chem., 2014, 05, 55–64 CrossRef.
- M. Lebrini, F. Robert, A. Lecante and C. Roos, Corros. Sci., 2011, 53, 687–695 CrossRef CAS.
- B. Xu, W. Yang, Y. Liu, X. Yin, W. Gong and Y. Chen, Corros. Sci., 2014, 78, 260–268 CrossRef CAS.
- M. A. Hegazy, M. Abdallah, M. K. Awad and M. Rezk, Corros. Sci., 2014, 81, 54–64 CrossRef CAS.
- A. O. Yüce and G. Kardaş, Corros. Sci., 2012, 58, 86–94 CrossRef.
- I. Ahamad, R. Prasad and M. A. Quraishi, Corros. Sci., 2010, 52, 1472–1481 CrossRef CAS.
- M. A. Bedair, M. M. B. El-Sabbah, A. S. Fouda and H. M. Elaryian, Corros. Sci., 2017, 128, 54–72 CrossRef CAS.
- M. Hosseini, S. F. L. Mertens, M. Ghorbani and M. R. Arshadi, Mater. Chem. Phys., 2003, 78, 800–808 CrossRef CAS.
- K. Jüttner, Electrochim. Acta, 1990, 35, 1501–1508 CrossRef.
- A. P. Yadav, A. Nishikata and T. Tsuru, Corros. Sci., 2004, 46, 169–181 CrossRef CAS.
- M. A. Quraishi and F. A. Ansari, J. Appl. Electrochem., 2003, 33, 233–238 CrossRef CAS.
- R. S. Erami, M. Amirnasr, S. Meghdadi, M. Talebian, H. Farrokhpour and K. Raeissi, Corros. Sci., 2019, 151, 190–197 CrossRef.
- S. A. Umoren, I. B. Obot, A. U. Israel, P. O. Asuquo, M. M. Solomon, U. M. Eduok and A. P. Udoh, J. Ind. Eng. Chem., 2014, 20, 3612–3622 CrossRef CAS.
- V. Sivakumar, K. Velumani and S. Rameshkumar, Mater. Res., 2018, 21(4), e20170167 CAS.
- M. Goyal, S. Kumar, I. Bahadur, C. Verma and E. E. Ebenso, J. Mol. Liq., 2018, 256, 565–573 CrossRef CAS.
- H. Ju, Y. Ju and Y. Li, J. Mater. Sci. Technol., 2012, 28, 809–816 CrossRef CAS.
- Y. Li, P. Zhao, Q. Liang and B. Hou, Appl. Surf. Sci., 2005, 252, 1245–1253 CrossRef CAS.
- C. M. Fernandes, L. X. Alvarez, N. E. dos Santos, A. C. M. Barrios and E. A. Ponzio, Corros. Sci., 2019, 149, 185–194 CrossRef CAS.
| This journal is © The Royal Society of Chemistry 2023 |

