 Open Access Article
Synthesis of efficient bi-anchoring bifuran/biphenyl derivatives for dye-sensitized solar cell applications†
Heba M. El-Shafeai,
Safa A. Badawy ,
Mohamed A. Ismail
 ,
Ehab Abdel-Latif,
Ahmed A. Fadda
 and
Mohamed R. Elmorsy
 *
*
Department of Chemistry, Faculty of Science, Mansoura University, 35516 Mansoura, Egypt. E-mail: m.r.elmorsy@mans.edu.eg; m.r.elmorsy@gmail.com
First published on 24th March 2023
Abstract
The synthesis, description, and demonstration of dye-sensitive solar cell sensitizers containing bifuran/biphenyl derivatives with cyanoacetic acid, barbiturate, thiobarbituric acid, and 4-carboxylcyanoacetamides have been reported. A photovoltaic performance measurement was conducted using the Ru(II) dye N3 as a reference to examine the effects of different electron acceptor units and replacement of the π-spacer bifuran by biphenyl units on the photophysical, electrochemical, and photovoltaic properties of eight new distinct organic dyes HB-1–8. The new organic dyes HB-1–8 were prepared and compared with the N3 metal dye. Density functional theory calculations were carried out to explore the ground state geometrical structures and electronic structures of the eight dyes. Under standard global AM 1.5 solar condition, the solar cells based on HB-1–8 show the overall power conversion efficiencies of 2.93–5.51%. The presented research shows that the organic dye photovoltaic performances can vary greatly depending on the type of electron donor and acceptor used. Dye HB-3 exhibited the highest efficiency among the eight investigated dyes, reaching 5.51% with a VOC value higher than N3.
1. Introduction
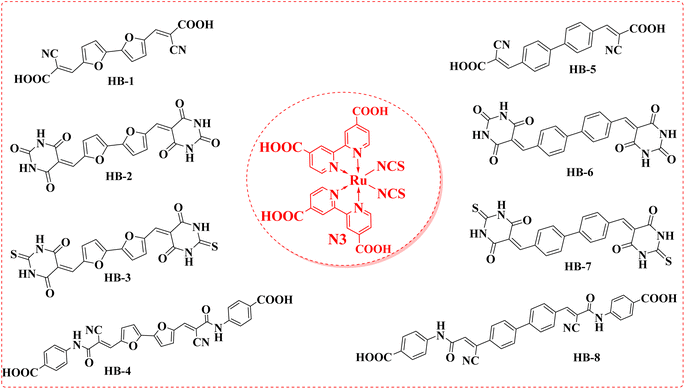
Solar power is the largest untapped resource for renewable energy on Earth. Due to its low price and versatility with superior cost-to-efficiency proportion, dye-sensitized solar cells (DSSCs) have been the subject of intensive research ever since their successful display by Grätzel and coworkers.1 Numerous strategies have been pursued in recent decades to create efficient sensitizers with increasing photostability and conversion efficiency, converting sunlight to electricity.2 While ruthenium-based dyes such as black dye, N3, and N719 were used to sensitize the most effective devices, these chromophores are associated with a variety of drawbacks, including high cost, metal shortage, and time-consuming purification processes.3–5 In contrast, organic dyes benefit from their simple structural modulation, low environmental impact, low cost, simplified synthesis, and outstanding light-harvesting expertise.6 The sensitizer is a key component of DSSCs due to its role in absorbing photons and converting them into electrons through the cell. Because of its importance to DSSCs, its molecular structure should be carefully engineered to achieve wider panchromatic absorption spectra, appropriate FMO energy levels, and outstanding stability.7 According to this study, the donor–(π-spacer)–acceptor (D–π–A) strategy is the most widely studied molecular geometry for effective organic dyes.8 The π-conjugation linkage between the donating portion and the acceptor unit facilitates effective photo-induced intramolecular charge transfer (ICT). Most of these dyes use electron-donating units derived from a variety of organic core structures, including indole, triarylamine, phenothiazine, and carbazole.9 Furthermore, the presence of an additional electron-drawing unit (A) could significantly decrease the organic dye's HOMO–LUMO gap and thus improve its photostability. Several di-anchoring organic dyes designed and synthesized for use in DSSCs have demonstrated better cell performance than mono-anchoring D–π–A sensitizers, with an improved photocurrent due to the extension of the π-conjugated system and the increased molar extinction coefficient.10 Because of its high optoelectronic efficiency, high conductivity potential, and high stability,11 using furan and phenyl as donors is also generally accepted as a good way to improve the chemical, electrical, spectroscopic, and overall stability of the particles that will likely be made. In recent scientific literature, numerous dyes with multiple anchoring moieties were reported. Double-anchoring organic sensitizers have several advantages over single-anchoring sensitizers, including (i) a bathochromic shift in the absorption spectra, (ii) strong binding to the semiconductor, (iii) greatest stability, (iv) increased number of the injected protons.12–14 To produce more potent DSSCs, the architecture must be refined with double anchoring compounds. In comparison with their single counterparts, these compounds exhibit enhanced light-harvesting characteristics and are more stable.15,16 Therefore, in this research article, we have explored the effectiveness of anchoring moieties such as barbituric acid, thiobarbituric acid and cyanoacetamide moieties in TiO2-DSSCs. The newly designed sensitizer incorporates bifuran/biphenyl cores that are directly attached to cyanoacetic acid, barbituric acid, thiobarbituric acid and 4-carboxylcyanoacetamide acceptor units on two terminals. In our study, in comparison with the bifuran/biphenyl dyes HB-1–8 with the metal complex dye N3, HB-3 with double thiobarbituric acid units as the anchor group exhibited the best overall conversion efficiency with the simultaneous enhancement of photocurrent and photovoltage. Fig. 1 exhibits the molecular structures of HB-1–8 and Ru(II) dye N3.2. Experimental section
2.1. Materials and methods
Materials and methods are discussed in detail in the ESI.† All devices, equipment and fabrication for DSSCs are also shown in the ESI.†2.2. Structural interpretation
HB-1–8 was analyzed using IR, 1H NMR, and 13C NMR spectra. As a result, Fig. S1–S29 (ESI†) contain their related figures.2.3. Synthetic procedures
3-(5′-(2-Carboxy-2-cyanovinyl)-[2,2′-bifuran]-5-yl)-2-cyanoacrylic acid (HB-1). Compound HB-1 (76% yield, red ppt), mp = >360 °C, IR (KBr) ν′/cm−1: 3423 (OH, stretch), 3149, 3093 (CH, stretch), 2228 (CN, stretch), 1728 (C
![[double bond, length as m-dash]](https://www.rsc.org/images/entities/char_e001.gif) O, stretch), 1593, 1511, 1437 (C
O, stretch), 1593, 1511, 1437 (C![[double bond, length as m-dash]](https://www.rsc.org/images/entities/char_e001.gif) C, stretch). 1H-NMR (DMSO-d6) δ 7.13 (d, J = 4.00 Hz, 2H, furan-H's), 7.62 (d, J = 4.00 Hz, 2H, furan-H's), 8.12 (s, 2H), 13.88 (s, 2H, carboxylic-H's). 13C-NMR; δ 99.61 (2C), 112.66 (2C), 115.98 (2C), 125.43 (2C), 137.58 (2C), 148.12 (2C), 149.14 (2C), 163.44 (2C) ppm. MS (EI) m/z (rel. int.) C16H8N2O6 (324.25); 324.25 (M+, 49.31), 136.23 (100). Anal. calcd. For C16H8N2O6 (324.25): C, 59.27; H, 2.49; N, 8.64. Found. C, 59.31; H, 2.58; N, 8.49.
C, stretch). 1H-NMR (DMSO-d6) δ 7.13 (d, J = 4.00 Hz, 2H, furan-H's), 7.62 (d, J = 4.00 Hz, 2H, furan-H's), 8.12 (s, 2H), 13.88 (s, 2H, carboxylic-H's). 13C-NMR; δ 99.61 (2C), 112.66 (2C), 115.98 (2C), 125.43 (2C), 137.58 (2C), 148.12 (2C), 149.14 (2C), 163.44 (2C) ppm. MS (EI) m/z (rel. int.) C16H8N2O6 (324.25); 324.25 (M+, 49.31), 136.23 (100). Anal. calcd. For C16H8N2O6 (324.25): C, 59.27; H, 2.49; N, 8.64. Found. C, 59.31; H, 2.58; N, 8.49.
5,5′-([2,2′-Bifuran]-5,5′-diylbis(methanylylidene))bis(pyrimidine-2,4,6(1H,3H,5H)-trione) (HB-2). Compound HB-2 (82% yield, red ppt), mp = >360 °C, IR (KBr) ν′/cm−1: 3214 (NH, stretch), 3073 (CH, stretch), 1741, 1703, 1671 (C
![[double bond, length as m-dash]](https://www.rsc.org/images/entities/char_e001.gif) O, stretch), 1566 (C
O, stretch), 1566 (C![[double bond, length as m-dash]](https://www.rsc.org/images/entities/char_e001.gif) C, stretch), 1H-NMR (DMSO-d6) δ 7.52 (d, J = 4.00 Hz, 2H, furan-H's), 8.04 (s, 2H), 8.57 (d, J = 4.00 Hz, 2H, furan-H's), 11.34 (s, 2H, 2× N–H), 11.41 (s, 2H, 2× N–H), MS (EI) m/z (rel. int.) C18H10N4O8 (410.3); 410.20 (M+, 2.66), 262.20 (91.99), 57 (100). Anal. calcd. For C18H10N4O8 (410.3): C, 52.69; H, 2.46; N, 13.66. Found. C, 52.54; H, 2.64; N, 13.45.
C, stretch), 1H-NMR (DMSO-d6) δ 7.52 (d, J = 4.00 Hz, 2H, furan-H's), 8.04 (s, 2H), 8.57 (d, J = 4.00 Hz, 2H, furan-H's), 11.34 (s, 2H, 2× N–H), 11.41 (s, 2H, 2× N–H), MS (EI) m/z (rel. int.) C18H10N4O8 (410.3); 410.20 (M+, 2.66), 262.20 (91.99), 57 (100). Anal. calcd. For C18H10N4O8 (410.3): C, 52.69; H, 2.46; N, 13.66. Found. C, 52.54; H, 2.64; N, 13.45.
5,5′-([2,2′-Bifuran]-5,5′-diylbis(methanylylidene)) bis-(2-thioxodihydropyrimidine-4,6(1H,5H)-dione) (HB-3). Compound HB-3 (79%, deep red ppt), mp = >360 °C, IR (KBr) ν′/cm−1: 3449 (NH, stretch), 3150, 3067 (CH, stretch), 1701, 1654 (C
![[double bond, length as m-dash]](https://www.rsc.org/images/entities/char_e001.gif) O, stretch), 1535, 1513 (C
O, stretch), 1535, 1513 (C![[double bond, length as m-dash]](https://www.rsc.org/images/entities/char_e001.gif) C, stretch), 1355 (C
C, stretch), 1355 (C![[double bond, length as m-dash]](https://www.rsc.org/images/entities/char_e001.gif) S, stretch). 1H-NMR (DMSO-d6) δ 7.58 (d, J = 4.00 Hz, 2H, furan-H's), 8.03 (s, 2H), 8.62 (d, J = 4.00 Hz, 2H, furan-H's), 12.46 (s, 2H, 2× N–H), 12.52 (s, 2H, 2× N–H). 13C-NMR; δ 114.40 (2C), 115.58 (2C), 129.04 (2C), 135.55 (2C), 149.71 (2C), 151.71 (2C), 159.92 (2C), 161.41 (2C), 178.20 (2C) ppm. MS (EI) m/z (rel. int.) C18H10N4O6S2 (442.42); 442.44 (M+, 15.27), 433.39 (100). Anal. calcd. For C18H10N4O6S2 (442.42): C, 48.87; H, 2.28; N, 12.66. Found. C, 49.11; H, 2.43; N, 12.77.
S, stretch). 1H-NMR (DMSO-d6) δ 7.58 (d, J = 4.00 Hz, 2H, furan-H's), 8.03 (s, 2H), 8.62 (d, J = 4.00 Hz, 2H, furan-H's), 12.46 (s, 2H, 2× N–H), 12.52 (s, 2H, 2× N–H). 13C-NMR; δ 114.40 (2C), 115.58 (2C), 129.04 (2C), 135.55 (2C), 149.71 (2C), 151.71 (2C), 159.92 (2C), 161.41 (2C), 178.20 (2C) ppm. MS (EI) m/z (rel. int.) C18H10N4O6S2 (442.42); 442.44 (M+, 15.27), 433.39 (100). Anal. calcd. For C18H10N4O6S2 (442.42): C, 48.87; H, 2.28; N, 12.66. Found. C, 49.11; H, 2.43; N, 12.77.
4,4′-(3,3′-[2,2′-Bifuran]-5,5′-diyl)bis(2-cyanoacryloyl)bis(azanediyl)dibenzoicacid (HB-4). Compound HB-4 (73% yield, deep red ppt), mp = >360 °C, IR (KBr) ν′/cm−1: 3405 (OH & NH, stretch), 2204 (CN, stretch), 1683 (C
![[double bond, length as m-dash]](https://www.rsc.org/images/entities/char_e001.gif) O, stretch), 1594, 1525, 1437 (C
O, stretch), 1594, 1525, 1437 (C![[double bond, length as m-dash]](https://www.rsc.org/images/entities/char_e001.gif) C, stretch). 1H-NMR (DMSO-d6) δ 7.17 (d, J = 4 Hz, 2H, furan-H's), 7.61–7.93 (m, 10H, Ar-H's), 8.21 (s, 2H, methine-H's), 10.63 (s, 2H, 2× N–H), 12.92 (s, 2H). MS (EI) m/z (rel. int.) C30H18N4O8 (562.49); 562.26 (M+, 25.12), 338.22 (100). Anal. calcd. For C30H18N4O8 (562.49): C, 64.06; H, 3.23; N, 9.96. Found. C, 63.96; H, 3.11; N, 10.21.
C, stretch). 1H-NMR (DMSO-d6) δ 7.17 (d, J = 4 Hz, 2H, furan-H's), 7.61–7.93 (m, 10H, Ar-H's), 8.21 (s, 2H, methine-H's), 10.63 (s, 2H, 2× N–H), 12.92 (s, 2H). MS (EI) m/z (rel. int.) C30H18N4O8 (562.49); 562.26 (M+, 25.12), 338.22 (100). Anal. calcd. For C30H18N4O8 (562.49): C, 64.06; H, 3.23; N, 9.96. Found. C, 63.96; H, 3.11; N, 10.21.
3,3′-([1,1′-Biphenyl]-4,4′-diyl)bis(2-cyanoacrylic acid) (HB-5). Compound HB-5 (81% yield, pale yellow ppt), mp = 296–298 °C, IR (KBr) ν′/cm−1: 3321 (OH, stretch), 3045 (CH, stretch), 2221 (CN, stretch), 1751 (C
![[double bond, length as m-dash]](https://www.rsc.org/images/entities/char_e001.gif) O, stretch), 1604, 1541, 1495 (C
O, stretch), 1604, 1541, 1495 (C![[double bond, length as m-dash]](https://www.rsc.org/images/entities/char_e001.gif) C, stretch). 1H-NMR (DMSO-d6) δ 7.22 (s, 2H, H's of carboxylic exchangeable with D2O), 7.97 (d, J = 8.00 Hz, 4H, Ar-H's), 8.09 (d, J = 8.00 Hz, 4H, Ar-H's), 8.20 (s, 2H). 13C-NMR; δ: 117.08 (2C), 127.56 (6C), 131.06 (4C), 131.95 (2C), 142.12 (2C), 151.63 (2C), 163.17 (2C) ppm, MS (EI) m/z (rel. int.) C20H12N2O4 (344.33); 344 (M+, 27), 300 (M+–CO2, 100), 256 (M+–2CO2, 29). Anal. calcd. For C20H12N2O4 (344.33): C, 69.77; H, 3.51; N, 8.14. Found. C, 69.46; H, 3.58; N, 8.23.
C, stretch). 1H-NMR (DMSO-d6) δ 7.22 (s, 2H, H's of carboxylic exchangeable with D2O), 7.97 (d, J = 8.00 Hz, 4H, Ar-H's), 8.09 (d, J = 8.00 Hz, 4H, Ar-H's), 8.20 (s, 2H). 13C-NMR; δ: 117.08 (2C), 127.56 (6C), 131.06 (4C), 131.95 (2C), 142.12 (2C), 151.63 (2C), 163.17 (2C) ppm, MS (EI) m/z (rel. int.) C20H12N2O4 (344.33); 344 (M+, 27), 300 (M+–CO2, 100), 256 (M+–2CO2, 29). Anal. calcd. For C20H12N2O4 (344.33): C, 69.77; H, 3.51; N, 8.14. Found. C, 69.46; H, 3.58; N, 8.23.
5,5′-([1,1′-Biphenyl]-4,4′-diylbis(methanylylidene))bis(pyrimidine-2,4,6(1H,3H,5H)-trione) (HB-6). Compound HB-6 (74% yield, yellow ppt), mp = >360 °C, IR (KBr) ν′/cm−1: 3202 (NH, stretch), 3091 (CH, stretch), 1750, 1677 (C
![[double bond, length as m-dash]](https://www.rsc.org/images/entities/char_e001.gif) O, stretch), 1572, 1493 (C
O, stretch), 1572, 1493 (C![[double bond, length as m-dash]](https://www.rsc.org/images/entities/char_e001.gif) C, stretch), 1H-NMR (DMSO-d6) δ 7.92 (d, J = 8.0 Hz, 4H, Ar-H's), 8.24 (d, J = 9.00 Hz, 4H, Ar-H's), 8.31 (s, 2H, methine-H's), 11.27 (s, 2H, 2× N–H), 11.41 (s, 2H, 2× N–H), MS (EI) m/z (rel.int.) C22H14N4O6 (430.38); 430 (M+, 2.5), 55 (100). Anal. calcd. For C22H14N4O6 (430.38): C, 61.40; H, 3.28; N, 13.02. Found. C, 61.28; H, 3.47; N, 12.87.
C, stretch), 1H-NMR (DMSO-d6) δ 7.92 (d, J = 8.0 Hz, 4H, Ar-H's), 8.24 (d, J = 9.00 Hz, 4H, Ar-H's), 8.31 (s, 2H, methine-H's), 11.27 (s, 2H, 2× N–H), 11.41 (s, 2H, 2× N–H), MS (EI) m/z (rel.int.) C22H14N4O6 (430.38); 430 (M+, 2.5), 55 (100). Anal. calcd. For C22H14N4O6 (430.38): C, 61.40; H, 3.28; N, 13.02. Found. C, 61.28; H, 3.47; N, 12.87.
5,5′-([1,1′-Biphenyl]-4,4′-diylbis(methanylylidene))bis(2-thioxodihydropyrimidine-4,6(1H,5H)-dione) (HB-7). Compound HB-7 (70% yield, orange ppt), mp = >360 °C, IR (KBr) ν′/cm−1: 3451 (NH, stretch), 3223 (CH, stretch), 1674 (C
![[double bond, length as m-dash]](https://www.rsc.org/images/entities/char_e001.gif) O, stretch), 1559, 1526, 1447 (C
O, stretch), 1559, 1526, 1447 (C![[double bond, length as m-dash]](https://www.rsc.org/images/entities/char_e001.gif) C, stretch), 1415 (C
C, stretch), 1415 (C![[double bond, length as m-dash]](https://www.rsc.org/images/entities/char_e001.gif) S, stretch). 1H-NMR (DMSO-d6) δ 7.96 (d, J = 8.50 Hz, 4H, Ar-H's), 8.31 (d, J = 8.80 Hz, 4H, Ar-H's), 8.35 (s, 2H, methine-H's), 12.40 (s, 2H, 2× N–H), 12.50 (s, 2H, 2× N–H), MS (EI) m/z (rel. int.) C22H14N4O4S2 (462.5); 462.61 (M+, 43), 455.99 (100). Anal. calcd. For C22H14N4O4S2 (462.5): C, 57.13; H, 3.05; N, 12.11. Found. C, 57.46; H, 2.84; N, 12.34.
S, stretch). 1H-NMR (DMSO-d6) δ 7.96 (d, J = 8.50 Hz, 4H, Ar-H's), 8.31 (d, J = 8.80 Hz, 4H, Ar-H's), 8.35 (s, 2H, methine-H's), 12.40 (s, 2H, 2× N–H), 12.50 (s, 2H, 2× N–H), MS (EI) m/z (rel. int.) C22H14N4O4S2 (462.5); 462.61 (M+, 43), 455.99 (100). Anal. calcd. For C22H14N4O4S2 (462.5): C, 57.13; H, 3.05; N, 12.11. Found. C, 57.46; H, 2.84; N, 12.34.
4,4′-(3,3′-([1,1′-Biphenyl]-4,4′-diyl)bis(2-cyanoacryloyl)bis(azanediyl))dibenzoic acid (HB-8). Compound HB-8 (75% yield, golden yellow ppt), mp = >360 °C, IR (KBr) ν′/cm−1: 3369 (OH & NH, stretch), 2208 (CN, stretch), 1691 (C
![[double bond, length as m-dash]](https://www.rsc.org/images/entities/char_e001.gif) O, stretch), 1593, 1524, 1405 (C
O, stretch), 1593, 1524, 1405 (C![[double bond, length as m-dash]](https://www.rsc.org/images/entities/char_e001.gif) C, stretch). 1H-NMR (DMSO-d6) δ 7.75 (d, J = 8.50 Hz, 4H, Ar-H's of biphenyl ring), 7.92 (d, J = 8.00 Hz, 4H, Ar-H's of biphenyl ring), 8.06 (d, J = 9.00 Hz, 4H, Ar-H's of phenylacetamide ring), 8.13 (d, J = 9.00 Hz, 4H, Ar-H's of phenylacetamide ring), 8.38 (s, 2H, methine-H's), 10.77 (s, 2H, 2× N–H). MS (EI) m/z (rel. int.) C34H22N4O6 (582.57); 582.24 (M+, 24.25), 159.66 (100). Anal. calcd. For C34H22N4O6 (582.57): C, 71.32; H, 3.92; N, 8.71. Found. C, 70.87; H, 3.79; N, 8.31.
C, stretch). 1H-NMR (DMSO-d6) δ 7.75 (d, J = 8.50 Hz, 4H, Ar-H's of biphenyl ring), 7.92 (d, J = 8.00 Hz, 4H, Ar-H's of biphenyl ring), 8.06 (d, J = 9.00 Hz, 4H, Ar-H's of phenylacetamide ring), 8.13 (d, J = 9.00 Hz, 4H, Ar-H's of phenylacetamide ring), 8.38 (s, 2H, methine-H's), 10.77 (s, 2H, 2× N–H). MS (EI) m/z (rel. int.) C34H22N4O6 (582.57); 582.24 (M+, 24.25), 159.66 (100). Anal. calcd. For C34H22N4O6 (582.57): C, 71.32; H, 3.92; N, 8.71. Found. C, 70.87; H, 3.79; N, 8.31.
3. Results and discussion
3.1. Synthesis
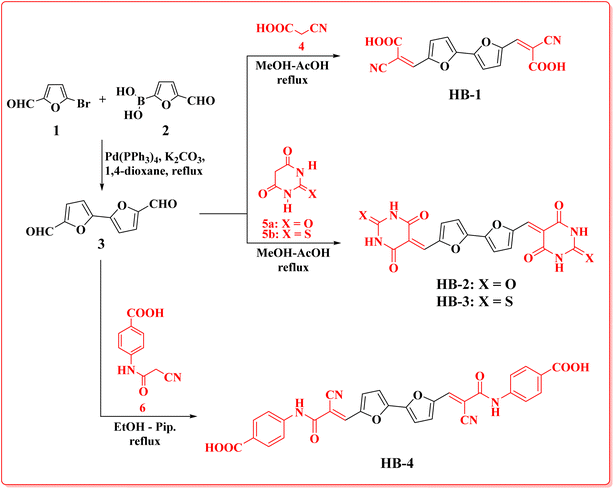
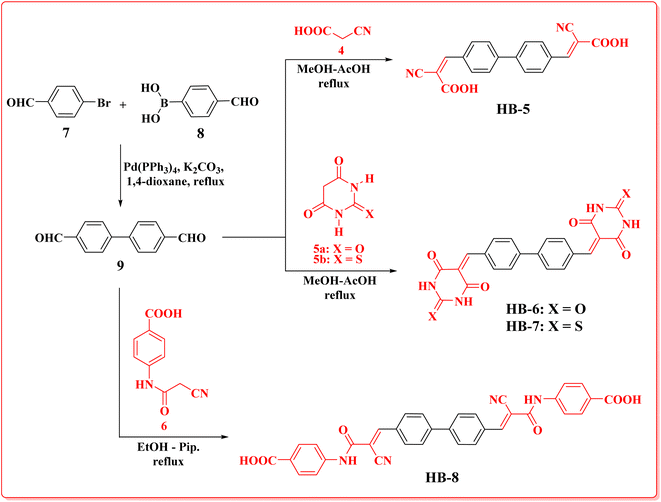
Bifuran structures HB-1–3 (Scheme 1) were prepared via condensation reaction of 2,2′-bifuran-5,5′-dicarbaldehyde (3) with cyanoacetic acid (4), barbituric acid (5a), thiobarbituric acid (5b), in methanol–acetic acid as a solvent with reflux. Dye HB-4 was prepared by refluxing dialdehyde 3 with 4-(2-cyanoacetamido)benzoic acid (6) in ethanol as a solvent and piperidine as a catalyst. The bifuran-dialdehyde 3 was made via a Suzuki coupling reaction of 5-bromofuran-2-carbaldehyde (1) with (5-formylfuran-2-yl)boronic acid (2). Structures of the newly synthesized dyes HB-1–4 were assigned based on their elemental and spectral analyses. IR spectra of HB-1 and HB-4 displayed the stretching vibrations of nitrile groups at 2228 cm−1 (HB-1) and 2204 cm−1 (HB-4), plus OH stretching vibrations at 3423 cm−1 (HB-1) and 3405 cm−1 (HB-4/OH NH). The 1H-NMR spectrum of HB-1 showed the related protons of the furan ring at δ 7.13, as well as 7.62 ppm (two protons each) as two doublet signals with a coupling constant of J = 4.00 Hz, two singlet signals δ 8.12 (2H, methine-H's), δ 13.88 (2H, carboxylic-H's). The 13C-NMR spectrum of HB-1 displayed eight carbon signals with the characteristic carbon of the carboxylic group at δ 163.44 ppm. Furthermore, MS of HB-1 gave a peak m/z at 324.25, confirming its molecular weight. The 1H-NMR spectrum of HB-3 showed the related protons for the furan ring at δ 7.58 and 8.62 ppm (two protons each) with a coupling constant of J = 4 Hz, three singlet signals at δ 8.03 (2H, methine-H's), δ 12.46 (2H, 2× NH), 12.52 (2H, 2× NH). The 13C-NMR spectrum of HB-3 displayed nine carbon signals with the characteristic carbon of the thione group at δ 178.20 ppm, δ 161.41, 159.92 ppm of two amidic carbonyl groups of the thiobarbituric moiety with one of the higher chemical shifts due to the anisotropic effect of the π-bonds of the furan ring. The mass spectrum of HB-3 gave a molecular ion peak m/z at 442.44.The new biphenyl dyes HB-5–8 (Scheme 2) were prepared via condensation reaction of biphenyl-4,4′-dicarbaldehyde (9) with cyanoacetic acid (4), barbituric acid (5a), thiobarbituric acid (5b), in methanol–acetic acid as a solvent with reflux. Dye HB-8 was prepared by refluxing dialdehyde 9 with 4-(2-cyanoacetamido)benzoic acid (6) in ethanol as a solvent and piperidine as a catalyst. The biphenyl-dialdehyde 9 was made via a Suzuki coupling reaction of 4-bromobenzaldehyde (7) with the 4-formylphenylboronic acid (8).
3.2. Optical properties
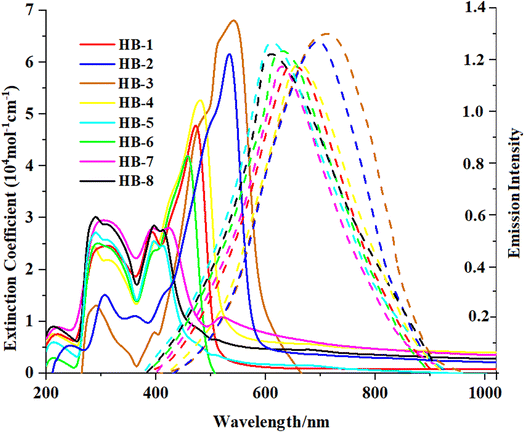
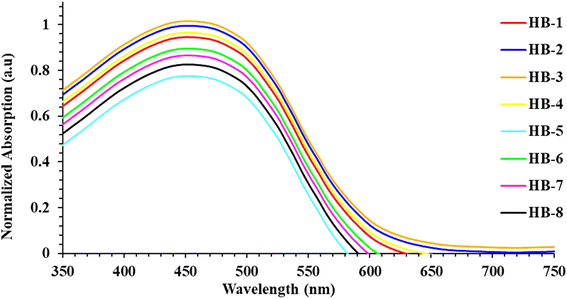
The absorption spectra of HB-1–8 were exposed in DMF solution and are shown in Fig. 2. The resultant values are revealed in Table 1. The absorption spectra of the standard dye N3 is presented in the ESI (Fig. S30†).| Sensitizer | λabs (nm) | ε (104 M−1 cm−1) | λem (nm) | Experimental, E0–0a (eV) |
|---|---|---|---|---|
| a E0–0 were calculated from the intersection between the absorption and emission profiles. | ||||
| HB-1 | (316, 465) | (2.41, 4.84) | 640 | 2.44 |
| HB-2 | (285, 508) | (1.51, 6.13) | 710 | 2.21 |
| HB-3 | (293, 547) | (1.30, 6.73) | 716 | 2.11 |
| HB-4 | (290, 484) | (2.50, 5.24) | 645 | 2.33 |
| HB-5 | (287, 410) | (2.80, 2.53) | 614 | 2.73 |
| HB-6 | (294, 459) | (2.51, 4.17) | 636 | 2.52 |
| HB-7 | (314, 431) | (2.93, 2.69) | 641 | 2.61 |
| HB-8 | (293, 417) | (3.01, 2.37) | 616 | 2.64 |
Fig. 2 shows the UV-vis absorption spectra of HB-1–8 in DMF (2 × 10⁻⁵ M), and Table 1 describes the findings. The chromophore's π–π* electron transition is responsible for the bands appearing in the shorter-wavelength regions. Meanwhile, an intramolecular charge transfer (ICT) occurs from the donors to their associated acceptors and is reflected by an absorption band from 410 to 595 nm.19 The maximum absorption wavelengths (λmax) were recorded for HB-1–8 with the increasing order HB-3 > HB-2 > HB-4 > HB-1 > HB-6 > HB-7 > HB-8 > HB-5. From the emission spectra, it is clear that the dyes show strong luminescence maxima in the region of 616–617 nm. The optical band gap was also calculated from the intersection between the normalized absorption and emission spectra.20 The maximum absorption of HB-3 with the furan and thiobarbituric acid had a bathochromic-shift of 39 nm relative to that of HB-2 with the barbituric acid acceptor, and it was red-shifted by the same amount relative to that of HB-7 with the biphenyl donor and the same acceptor.21 The reason for this is the improved electron delocalization caused by the π-conjugated sensitizer, as well as the use of furan as a linker in this D–π framework. Therefore, these data demonstrate that HB-3 has superior light-harvesting capabilities compared to the other investigated bifuran and biphenyl sensitizers. Additionally, the emission spectra of HB-1–8 were recorded in DMF (2 × 10⁻⁵ M), and their corresponding spectra are shown in Fig. 2. The corresponding data are displayed in Table 1.
We have also recorded the absorption spectra for when the dyes are adsorbed to the TiO2, as illustrated in Fig. 3. Unlike the absorption spectra in DMF, the HB-1–4 sensitizers had broader absorption bands and blue shifts, which is beneficial to light-harvesting, as well as the JSC value.22 The formation of the H-type aggregation, in particular, is responsible for the blue shift caused by the bifuran dyes' intense interactions with the semiconductor surface.23 When compared to the spectral responses of other organic dyes in DMF solution, HB-5–8 exhibited red-shifted spectra that can be explained by the interaction of the anchoring groups of the dyes with the surface of TiO2, and the stronger tendency to form a J-type aggregation on the TiO2 surface.24 It is clear that the absorption range before 350–600 nm is compensated well. So, the difference in number and type of anchoring groups in the dyes may result in a different arrangement of the dyes on the surface of TiO2.25 HB-3 has a broadening absorption spectrum, indicating better characteristics for the short current value (JSC). The presence of the H-aggregate in the device initiated by dye HB-3 leads to a decrease in the HB-3 sensitizer's *π energy level, and thus broadens its absorption spectrum.25 When compared to other dyes and N3, HB-5 had the lowest absorbance, which is determined by the strength of the anchoring and acceptor groups. The absorption profile of N3 over TiO2 is introduced in the ESI (Fig. S31†).
3.3. Interaction with the TiO2 surface
Therefore, in this paper, we use a combination of FT-IR spectroscopy and density functional theory (DFT) calculations to explore the various anchoring modes onto the TiO2 surface.26 In addition to simulating the IR spectra of the surface-adsorbed species, we consider monodentate and bidentate binding modes and compare their relative energies at different theoretical levels (Fig. S32 in the ESI†). In the FT-IR spectra of HB-1 and HB-5, notable peaks at 2228 and 2221 cm−1 stretching and 1728 and 1751 cm−1 stretching were observed. These peaks correlate to (–CN and –CO) and indicate that the cyano and carbonyl groups of the COOH units are linked to the surface of TiO2, as shown in their IR spectra adsorbed to a TiO2 film. Additionally, the FT-IR spectra of bis-barbituric acid-containing HB-2 and HB-6 after being anchored on TiO2 rule out physisorption, and point to the dye being chemisorbed onto the TiO2 surface through bidentate binding modes involving the carbonyl and NH groups with the emergence of new peaks. Furthermore, the binding type may be determined by using the Deacon and Phillips assumptions of vibrational frequency study.27 Anchoring groups participate in dye adsorption by either bidentate chelation or abridging of the top titanium ions, as shown by the frequency shifts in the NH and CO bands seen for HB-3 and HB-7, both of which contain thiobarbituric acid. The HB-4 and HB-8 sensitizers followed the same pattern. Furthermore, there was a shift in frequency for the (NH), (CN), and (CO) bands, suggesting that the cyanoacetamide groups play a role in the dye-adsorption process (Fig. S33–S40†).3.4. Electrochemical properties
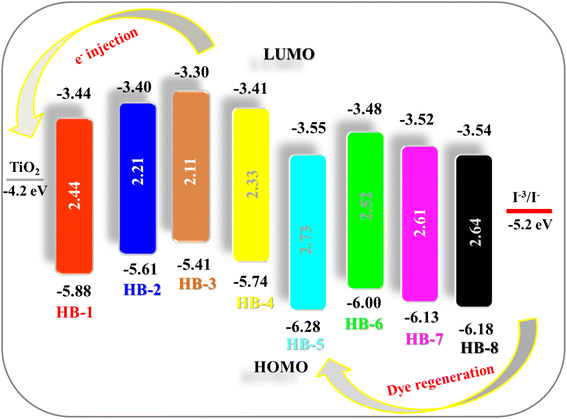
The process for the injection of the electrons into TiO2 and the regeneration of the electrons represent essential behavior in DSSCs. So, the use of cyclic voltammetry (CV) experiments, which is the primary criterion for selecting organic dyes for DSSC applications, has allowed researchers to better understand these processes, as shown in Fig. S41 in ESI.† The excited state oxidation potential (ESOP) is estimated by eqn (1)28 as follow:| ESOP = [(GSOP (eV) + 4.7) − E0–0] eV | (1) |
The position of the HOMO and the LUMO within the molecular structure of the dye is essential for the performance in DSSCs. The energy of the LUMO level must be greater than the energy potential of the semiconductor (TiO2), so that electrons can spontaneously enter the semiconductor. The dye HOMO level must be lower in energy than the redox potential of the electrolyte (−5.2 eV) that facilitates the retention of the electron back to the dye. As shown in Fig. 4 and Table 2, the HOMO levels obtained for the dyes are in the order HB-3 (−5.41 eV) > HB-2 (−5.61 eV) > HB-4 (−5.74 eV) > HB-1 (−5.88 eV) > HB-6 (−6.00 eV) > HB-7 (−6.13 eV) > HB-8 (−6.18 eV) > HB-5 (−6.28 eV), compared to (−4.20 eV) for the conduction band of TiO2.29 From the data, HB-3's HOMO is higher than the electrolyte potential, indicating a stronger and more efficient reduction force for the oxidized dye. So, it is plausible that the thiobarbituric acid acceptors present in the HB-3 dye might improve the device efficiency of HB-3 relative to that of other dyes.30 Furthermore, HB-3 gives the most negative LUMO level (−3.30 eV), indicating that the electron injection process from the excited dye molecule to the TiO2 conduction band is more efficient for HB-3. The schematic energy levels of the bifuran/biphenyl sensitizers HB-1–8 based on the absorption and electrochemical data are shown in Fig. 4.
| Dye | Experimental (eV) | Calculated (eV) | ||||||||
|---|---|---|---|---|---|---|---|---|---|---|
| E0–0 | HOMO | LUMO | Eoxdonset | ΔGinj | ΔGrec | ΔGreg | E0–0 | HOMO | LUMO | |
| HB-1 | 2.44 | −5.88 | −3.44 | 1.18 | −0.76 | −1.68 | −0.68 | 2.43 | −5.85 | −3.42 |
| HB-2 | 2.21 | −5.61 | −3.40 | 0.91 | −0.80 | −1.41 | −0.41 | 2.20 | −5.60 | −3.40 |
| HB-3 | 2.11 | −5.41 | −3.30 | 0.71 | −0.90 | −1.21 | −0.21 | 2.02 | −5.41 | −3.39 |
| HB-4 | 2.33 | −5.74 | −3.41 | 1.04 | −0.79 | −1.54 | −0.54 | 2.31 | −5.74 | −3.43 |
| HB-5 | 2.73 | −6.28 | −3.55 | 1.58 | −0.65 | −2.08 | −1.08 | 2.75 | −6.25 | −3.50 |
| HB-6 | 2.52 | −6.00 | −3.48 | 1.30 | −0.72 | −1.80 | −0.80 | 2.53 | −5.96 | −3.43 |
| HB-7 | 2.61 | −6.13 | −3.52 | 1.40 | −0.68 | −1.93 | −0.93 | 2.64 | −6.09 | −3.45 |
| HB-8 | 2.64 | −6.18 | −3.54 | 1.48 | −0.66 | −1.98 | −0.98 | 2.67 | −6.14 | −3.47 |
Understanding the various thermodynamic processes that occur at the dye/electrolyte/semiconductor interfaces is critical for designing an efficient device.31 The driving forces, ΔGinj, ΔGrec, and ΔGreg, were calculated to gain insight into the viability of dye injection, recombination, and regeneration processes by using eqn (2)–(4).
 | (2) |
| ΔGrec (eV) = EdyeOX − ECB | (3) |
| ΔGreg (eV) = EdyeOX − Eredox | (4) |
As can be observed from the data, all of the ΔG values obtained are negative, indicating the thermodynamic feasibility of all of the aforementioned processes.32 Based on the electrochemical data obtained, it is possible to conclude that HB-3 is a potential dye with greater electron injection feasibility than recombination. The values of ΔGinj of HB-1–8 were found to be as follows: HB-3 (−0.90 eV) > HB-2 (−0.80 eV) > HB-1 (−0.76 eV) > HB-4 (−0.81 eV) > HB-6 (−0.72 eV) > HB-7 (−0.68 eV) > HB-8 (−0.66 eV) > HB-5 (−0.65 eV). Based on the above results, it seems that the di-anchoring HB-3 has the highest ΔGinj value (−0.90 eV) compared to the other studied sensitizers, which permits it to inject electrons more effectively into TiO2's CB.33 HB-3 also had the highest ΔGrec value, indicating that it has superior recombination resistance, which can be influenced by the presence of di symmetric anchoring moieties. Furthermore, all of the bifuran/biphenyl sensitizers HB-1–8 were shown to have sufficient driving force Greg values for their regeneration process in order to prevent recombination between the photo-oxidized state and injected electrons, resulting in a higher cell JSC value.34 Also, the ΔGreg value of (−1.21 eV) for HB-3 indicates the highest performance of the dye due to the better regeneration of the oxidized dye. Based on the electrochemical data obtained, it is possible to conclude that the sensitizer HB-3 is a potential dye with greater electron injection and recombination feasibility.
3.5. Molecular modeling
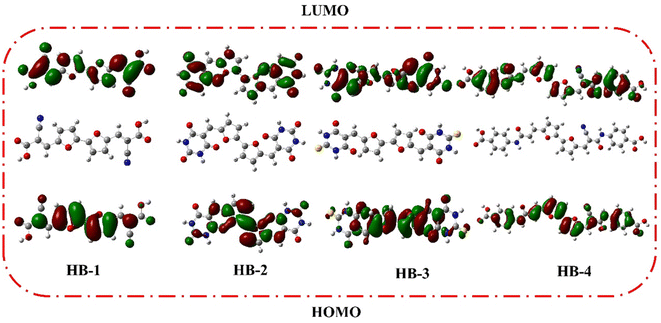
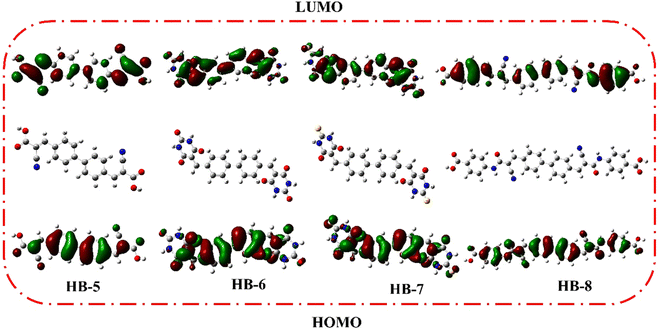
DFT calculations were performed on bifuran/biphenyl sensitizers HB-1–8 by the B3LYP/6–311G using Gaussian09 software to gain insight into the molecular structure of the dyes, as depicted in Fig. 5.35 The optimized molecular configurations and charge density dispersion at their FMO energies are shown in Fig. 5. The HOMO levels of HB-1–4 show that the electron cluster is concentrated chiefly on the furan moiety, which then precisely moved from an electron-donating substituent to electron acceptors (cyanoacetic acid, barbituric acid, thiobarbituric acid, and 4-carboxylcyanoacetamide) at their LUMO levels, but this occurred to varying degrees for each of these compounds because of their specific electron-receiving properties. The symmetric bifuran substituent of HB-3 has HOMO, and the LUMO electron density is completely localized on the anchoring thiobarbituric acid substituent, as shown by the findings; this allows for electronic interactions between the LUMO electron density and the TiO2 d-orbitals, and the coexistence between the HOMO and LUMO levels guarantees a rapid photo-induced transfer of electrons from the donating part to the acceptor group. Because of this increased charge separation, HB-3 has a much higher photovoltaic efficiency than other sensitizers.From Fig. 6, the HOMO for HB-5–8 is randomly distributed throughout the framework, whereas the LUMOs were located in the anchoring parts (barbituric, thiobarbituric acid units) through the biphenyl-spacer. For HB-5–8, this means that the LUMO electron destination does not really tightly coincide with TiO2's conduction band (CB), which could lead to poor electron injection efficiency from the dyes' LUMO.
3.6. Molecular electrostatic potential (MEP)
Molecular electrostatic potentials (MEP) HB-1–8 dyes help to understand the molecular orbital behavior.36 As shown in Fig. S42 in the ESI,† the negative (red) low potentials are located on the carbonyl group and cyano group for HB-1 and HB-6, but located for the carbonyl of the barbituric moiety for HB-2 and HB-7. For HB-3 and HB-7 containing thiobarbituric acid as acceptor, it is localized over the carbonyl group. In contrast, the donating components, like the bifuran and biphenyl regions, are in the MEP map's blue positive zone, suggesting that they are good candidates for nucleophilic attack. Analyzing the MEP of the HB-1–8 bichalcophene sensitizers' surfaces reveals how many free electrons are available to interact with other atomic species. Based on this finding, we may infer the composition of the ICT in all HB-1–8 sensitizers after adsorption on TiO2.4. Photovoltaic device characterizations
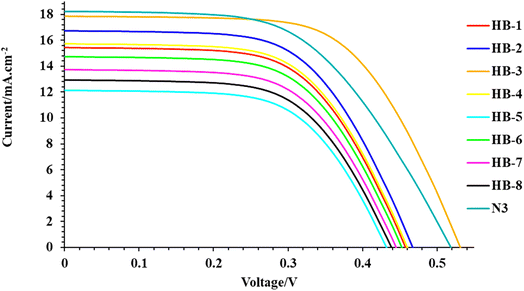
The photocurrent density–photovoltage (J–V) curves of the DSSCs based on HB-1–8 compared to N3 are shown in Fig. 7, and the key parameters including short-circuit current density (JSC), open-circuit voltage (VOC), fill factor (FF) and overall power conversion efficiency (η) are summarized in Table 3. It is clear that the photovoltaic performances of the DSSCs can be clearly affected by the anchoring group in the dye molecules. The PCE increases in the order of N3 (5.61%) > HB-3 (5.51%) > HB-2 (5.00%) > HB-4 (4.07%) > HB-1 (3.96%) > HB-6 (3.50%) > HB-7 (3.44%) > HB-8 (2.93%) > HB-5 (2.91%). Under the same conditions, the cells sensitized with HB-1–8 and N3 gave increasing JSC in the following order: N3 (18.22) > HB-3 (17.84) > HB-2 (16.73) > HB-4 (15.72) > HB-1 (15.43) > HB-6 (14.73) > HB-7 (13.73) > HB-8 (12.93) > HB-5 (12.13) mA cm−2 and VOC HB-3 (515) > N3 (505) > HB-2 (460) > HB-4 (459), HB-1 (459) > HB-6 (441) > HB-7 (440) > HB-8 (421) > HB-5 (420) mV, respectively. Among the bifuran/biphenyl HB-1–8 dyes, HB-3 outperforms the other dyes in solar cell performance, especially in JSC and VOC, because of its strong anchoring property with TiO2, which facilitated the injection of electrons into the TiO2 surface.37 The increased JSC value of HB-3 in comparison to the other bifuran/biphenyl dyes is primarily attributable to its relatively superior light harvesting capability (broad absorption spectrum and high molar extinction coefficient), which is reflected in its superior IPCE spectrum.37 Compared to N3 dyes, HB-3 had significantly higher VOC values, indicating that its thiobarbituric acid group has a high tendency to inject electrons from the LUMO to the TiO2 conduction band. The reason for this is that the bulky N3 dye adsorbs poorly on the semiconductor surface, producing bigger spaces in between the attached organic molecules.38| Sensitizer (0.2 mM) | VOC (mV) | JSC (mA cm−2) | FF | η (%) |
|---|---|---|---|---|
| N3 | 505 | 18.22 | 0.61 | 5.61 |
| HB-1 | 459 | 15.43 | 0.56 | 3.96 |
| HB-2 | 460 | 16.73 | 0.65 | 5.00 |
| HB-3 | 515 | 17.84 | 0.60 | 5.51 |
| HB-4 | 459 | 15.72 | 0.56 | 4.07 |
| HB-5 | 420 | 12.13 | 0.57 | 2.90 |
| HB-6 | 441 | 14.73 | 0.54 | 3.50 |
| HB-7 | 440 | 13.73 | 0.57 | 3.44 |
| HB-8 | 421 | 12.93 | 0.54 | 2.93 |
However, when compared to other sensitizer-based devices, HB-5 exhibited the lowest VOC and JSC values. This may be primarily due to the poor interaction between the sensitizer and TiO2, resulting in the lowest efficiency.
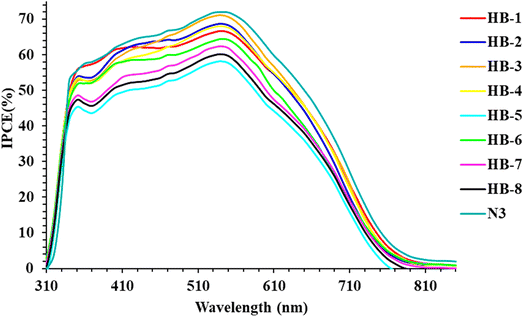
Fig. 8 displays the wavelength dependence of the incident photon-to-electron conversion efficiency (IPCE) for fabricated cells using the four dyes as photosensitizers. Fig. 8 shows that the IPCE of the bifuran/biphenyl sensitizers is greater than 40% within the wavelength scale from 410 to 520 nm; HB-5 exhibited a significant value of 57.6% at 500 nm. Dye HB-1–8 sensitizers have narrower IPCE spectra than N3, resulting in lower photocurrent and lower photovoltaic effectiveness.39 The relatively higher IPCE for HB-3 in comparison to other dyes is consistent with the UV-vis absorption properties' tendency.40 In comparison, HB-1–4 bearing a bifuran attached to various acceptor moieties exhibits a broader IPCE spectrum compared to HB-5–8 containing a biphenyl with various acceptors. The HB-3 sensitized TiO2 electrodes achieve the maximum conversion yield among the investigated bifuran/biphenyl dyes due to their higher and broader IPCE values than those of the other sensitizers in the remaining region.
4.1. Electrochemical impedance spectroscopy (EIS)
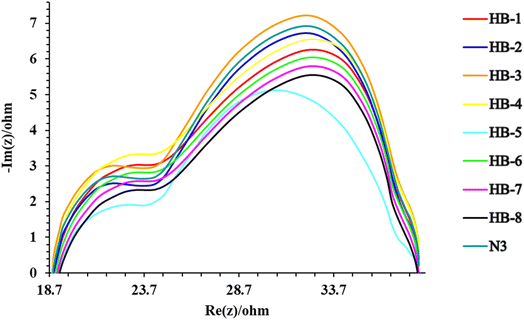
Electrochemical impedance spectroscopy (EIS) measurements were performed to characterize the charge transfer resistances of the cells. Fig. 9 shows the electrochemical impedance spectra for the DSSCs based on the three sensitizers (HB-1–8). EIS experiments were carried out to assess the interfacial charge recombination and carrier transit mechanisms in the manufactured DSSCs.41,42 The Nyquist plots of the DSSCs made with sensitizers HB-1–8 and N3 are shown in Fig. 9. In the Nyquist plots of the sensitized devices, two semicircles were demonstrated, and it was interesting to note that the radius of the second semicircle of the produced DSSCs was found to be in the order: HB-3 > N3 > HB-2 > HB-4 > HB-1 > HB-6 > HB-7 > HB-8 > HB-5. According to the results, HB-3 plays a crucial role in reducing the overall dark current/back response in the sensitized DSSCs. Based on the VOC levels associated with the manufactured cells listed in Table 3, the aforementioned result is consistent.5. Conclusion
We have synthesized, described, and implemented new bifuran/biphenyl derivatives that contain cyanoacetic acid, barbituric acid, thiobarbituric acid, and 4-carboxylcyanoacetamide acceptors in dye-sensitized solar cells. As a result of thiobarbituric acid's electron-withdrawing ability, HB-3 dye has the biggest maximum absorption wavelength and maximum molar absorption coefficient. In comparison to other dyes, the DSSC based on HB-3 with bifuran and thiobarbituric units has a higher average conversion efficiency (5.51%). In comparison to other dyes, DSSCs based on HB-3 with the bifuran and thiobarbituric units have a higher average conversion efficiency (5.51%). DSSCs based on bifuran/biphenyl sensitizers showed good conversion efficiencies and short-circuit currents that are consistent with the electrochemical impedance spectroscopy results. The photovoltaic performance is highly variable depending on the electron-acceptors in the organic sensitizers.Data availability
The data supporting the findings of this study are available on request from the corresponding author.Author contributions
Heba M. El-Shafeai and Safa A. Badawy: data curation, formal analysis, methodology, and software; Mohamed A. Ismail and Ehab Abdel-Latif: investigation and writing – review & editing; Ahmed A. Fadda: supervision and project administration; Mohamed R. Elmorsy: conceptualization, formal analysis, investigation, writing – original draft.Conflicts of interest
The authors declare no conflict of interest, financial or otherwise.Acknowledgements
The authors are thankful to Mansoura University, Egypt, for their support under project ID: MU-SCI-22-31.References
- M. Grätzel, Nature, 2001, 414, 338–344 CrossRef PubMed
.
- D. Luo, W. Jang, D. D. Babu, M. S. Kim, D. H. Wang and A. K. K. Kya, J. Mater. Chem. A, 2022, 10, 3255–3295 RSC
.
- M. Grätzel, J. Photochem. Photobiol., C, 2003, 4, 145–153 CrossRef
.
- M. K. Nazeeruddin, A. Kay, I. Rodicio, R. Humphry-Baker, E. Müller, P. Liska, N. Vlachopoulos and M. Grätzel, J. Am. Chem. Soc., 1993, 115, 6382–6390 CrossRef CAS
.
- A. M. Aldusi, A. A. Fadda, M. A. Ismail and M. R. Elmorsy, Appl. Organomet. Chem., 2022, e6893 CAS
.
- L. Lyu, R. Su and A. El-Shafei, ChemistrySelect, 2022, 7, e202202183 CrossRef CAS
.
- P. S. Gangadhar, A. Jagadeesh, M. N. Rajesh, A. S. George, S. Prasanthkumar, S. Soman and L. Giribabu, Mater. Adv., 2022, 3, 1231–1239 RSC
.
- C. Liao, H. Wu, H. Tang, L. Wang and D. Cao, Sol. Energy, 2022, 240, 399–407 CrossRef CAS
.
- J. Zou, Y. Tang, G. Baryshnikoy, Z. Yang, R. Mao, W. Feng, J. Guan, C. Li and Y. Xie, J. Mater. Chem. A, 2022, 10, 1320–1328 RSC
.
- R. Grisorio, L. De Marco, G. Allegretta, R. Giannuzzi, G. P. Suranna, M. Manca and G. Gigli, Dyes Pigm., 2013, 98(2), 221–231 CrossRef CAS
.
- F. H. Abdelhamed, M. A. Ismail, E. Abdel-Latif, A. A. Abdel-Shafi and M. R. Elmorsy, J. Mater. Sci.: Mater. Electron., 2022, 1–14 Search PubMed
.
- B.-Y. Zhu, L. Wu, Q. Ye, J.-R. Gao and L. Han, Tetrahedron, 2017, 73, 6307–6315 CrossRef CAS
.
- X. Ren, S. Jiang, M. Cha, G. Zhou and Z. S. Wang, Chem. Mater., 2012, 24, 3493 CrossRef CAS
.
- S. Jiang, S. Fan, X. Lu, G. Zhou and Z. S. Wang, J. Mater. Chem. A, 2014, 2, 17153–17164 RSC
.
- X. Ren, S. Jiang, M. Cha, G. Zhou and Z. S. Wang, Chem. Mater., 2012, 24, 3493–3499 CrossRef CAS
.
- R. Sirohia, D. H. Kim, S. C. Yu and S. H. Lee, Dyes Pigm., 2012, 92, 1132 CrossRef
.
- B. Taljaard and G. J. Burger, Adv. Synth. Catal., 2002, 344, 1111–1114 CrossRef CAS
.
- S. Dwivedi, S. Bardhan, P. Ghosh and S. Das, RSC Adv., 2014, 4, 41045–41050 RSC
.
- C. X. Xia, N. Wang, P. P. Sun, S. X. Tang, X. D. Xu, Y. B. Tan and X. Xin, Soft Matter, 2020, 16, 7390–7399 RSC
.
- G. Wu, F. Kong, Y. Zhang, X. Zhang, J. Li, W. Chen and S. Dai, Dyes Pigm., 2014, 105, 1–6 CrossRef CAS
.
- B. Hosseinzadeh, A. S. Beni, A. N. Chermahini, R. Ghahary and A. Teimouri, Synth. Met., 2015, 209, 1–10 CrossRef CAS
.
- M. R. Elmorsy, R. Su, E. Abdel-Latif, S. A. Badawy, A. El-Shafei and A. A. Fadda, J. Mater. Sci.: Mater. Electron., 2020, 31, 7981–7990 CrossRef CAS
.
- G. Wu, F. Kong, Y. Zhang, X. Zhang, J. Li, W. Chen, C. Zhang and S. Dai, Dyes Pigm., 2014, 105, 1–6 CrossRef CAS
.
- R. Sanchez-de-Armas, M. A. San Miguel, J. Oviedo and J. F. Sanz, Phys. Chem. Chem. Phys., 2012, 14, 225–233 RSC
.
- B. Hosseinzadeh, A. S. Beni, A. N. Chermahini, R. Ghahary and A. Teimouri, Synth. Met., 2015, 209, 1–10 CrossRef CAS
.
- N. A. Wazzan, J. Comput. Electron., 2019, 18, 375–395 CrossRef CAS
.
- L. da Silva, M. Sánchez, M. Ibarra-Rodriguez and H. S. Freeman, J. Mol. Struct., 2021, 1250, 131749 CrossRef
.
- M. R. Elmorsy, S. A. Badawy, E. Abdel-Latif, M. A. Assiri and T. E. Ali, Dyes Pigm., 2023, 214, 111206 CrossRef CAS
.
- B.-Y. Zhu, L. Wu, Q. Ye, J.-R. Gao and L. Han, Tetrahedron, 2017, 73, 6307–6315 CrossRef CAS
.
- J. Xu, L. Zhang, J. Chen, P. Shen, M. Ye, N. Y. Yuan and J. N. Ding, Thin Solid Films, 2018, 645, 129–133 CrossRef
.
- M. Pazoki, U. B. Cappel, E. M. J. Johansson, A. Hagfeldt and G. Boschloo, Energy Environ. Sci., 2017, 10, 672–709 RSC
.
- R. Kesavan, F. Attia, R. Su, P. Anees, A. El-Shafei and A. V. Adhikari, J. Phys. Chem. C, 2019, 123, 24383–24395 CrossRef CAS
.
- K. Sun, Y. Ma, W. Zhang, Y. Wen, L. Wang and J. Zhang, Dyes Pigm., 2017, 139, 148–156 CrossRef CAS
.
- X. Zarate, F. Claveria-Cadiz, D. Arias-Olivares, A. Rodriguez-Serrano, N. Inostroza and E. Schott, Phys. Chem. Chem. Phys., 2016, 18, 24239–24251 RSC
.
- M. Lundberg, T. Kawatsu, T. Vreven, M. J. Frisch and K. Morokuma, J. Chem. Theory Comput., 2009, 222–234 CrossRef CAS PubMed
.
- M. R. Elmorsy, E. Abdel-Latif, H. E Gaffer, S. A. Badawy and A. A. Fadda, J. Mol. Struct., 2022, 1255, 132404 CrossRef CAS
.
- J. Zhang, H.-C. Zhu, R.-L. Zhong, L. Wang and Z.-M. Su, Org. Electron., 2018, 54, 104–113 CrossRef CAS
.
- Y.-J. Chen, Y.-C. Chang, L.-Y. Lin, W.-C. Chang and S.-M. Chang, Electrochim. Acta, 2015, 178, 414–419 CrossRef CAS
.
- K. S. Keremane, A. Planchat, Y. Pellegrin, D. Jacquemin, F. Odobel and A. V. Adhikari, ChemSusChem, 2022, 15, e202200520 CrossRef CAS PubMed
.
- P. Naik, R. Su, M. R. Elmorsy, A. El-Shafei and A. V. Adhikari, Dyes Pigm., 2018, 149, 177–187 CrossRef CAS
.
- G. Oskam, B. V. Bergeron, G. J. Meyer and P. C. Searson, J. Phys. Chem. B, 2001, 105, 6867–6873 CrossRef CAS
.
- Y. Hua, B. Jin, H. Wang, X. Zhu, W. Wu, M.-S. Cheung, Z. Lin, W.-Y. Wong and W.-K. Wong, J. Power Sources, 2013, 237, 195–203 CrossRef CAS
.
Footnote |
| † Electronic supplementary information (ESI) available. See DOI: https://doi.org/10.1039/d3ra00609c |
| This journal is © The Royal Society of Chemistry 2023 |

