 Open Access Article
Leaching of phosphate ores with lower dissolution of metallic impurities: the dual role of sodium oleate†
Yuhe Zhoua,
Guocan Zhengab,
Shaodou Cena,
Renlong Liu *ac and
Changyuan Taoac
aCollege of Chemistry and Chemical Engineering, Chongqing University, Chongqing 400044, China. E-mail: lrl@cqu.edu.cn
bAnalytical and Testing Center, Chongqing University, Chongqing 400044, China
cState Key Laboratory of Coal Mine Disaster Dynamics and Control, Chongqing University, Chongqing 400044, China
First published on 3rd April 2023
Abstract
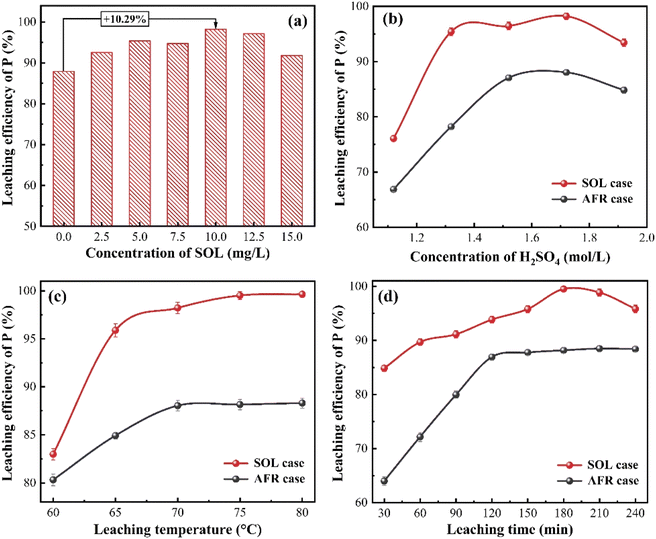
In this work, we report the use of surfactants to improve the performance of phosphate ore leaching while reducing the concentration of metallic impurities in the leaching solution. Based on the zeta potential analysis, sodium oleate (SOL) is determined as a suitable surfactant because it can change interfacial properties and improve ionic diffusion. This is experimentally demonstrated by the high leaching performance. After that, the reaction conditions on the leaching performance are systematically investigated. Under the optimal experimental conditions (SOL concentration of 10 mg L−1, sulfuric acid concentration of 1.72 mol L−1, leaching temperature of 75 °C, and leaching time of 180 min), a high phosphorus leaching efficiency of 99.51% is achieved. Meanwhile, the leaching solution presents a lower content of metallic impurities. Further measurements performed on the leaching residues indicate that the additive SOL can promote the growth of platy crystals and facilitate PO leaching. Overall, this work demonstrates that the SOL-assisted leaching method allows for highly-efficient utilization of PO and high-purity phosphoric acid production.
1. Introduction
Phosphoric acid is widely used as an important feedstock for the production of fertilizers, food products, cosmetics, and detergents.1,2 In 2020, the global phosphoric acid production capacity reached over 58 million metric tons.3,4 Different approaches such as thermal and wet processes are mainly employed to produce phosphoric acid from phosphate ores (PO).5,6 The wet process is by far the most common route and the acid can be used in phosphate fertilizer production.7 In such a hydrometallurgical process, leaching is typically the first step. Sulfuric acid leaching is currently considered the most viable and versatile of the available processes, which is also adopted for the wet process. In the production of wet-process phosphoric acid, PO is reacted with sulfuric acid to produce phosphoric acid and phosphogypsum (PG) via the dihydrate process, as described by the reaction below.8,9| Ca5(PO4)3F + 5H2SO4 + 10H2O → 3H3PO4 + 5CaSO4·2H2O + HF |
However, reserves of high grade PO are depleting due to the extensive utilization, compelling the use of medium and low grade PO.10 There are a number of approaches to improve the quality of medium and low grade PO, including grinding and classifying,11 gravity concentration,12 and flotation.13 Despite this, the efficient utilization of medium and low grade PO is increasingly important. Different methods have been proposed for the efficient utilization of PO by reducing the loss of phosphorus content, such as advanced oxidation processes,14 foam control,8 and organic acid leaching.15,16 Generally speaking, the leaching performance is efficiently improved by selecting appropriate agents or adopting intensification methods.
Surfactants, consisting of both hydrophilic and lipophilic groups, are oriented on the liquid surface to regulate liquid interfacial properties.17–19 They have been widely used in the petroleum chemical industry, medicine, and flotation of minerals.20–22 In mineral leaching processes, surfactants can change interfacial properties and improve ionic diffusion, therefore increasing leaching efficiency.23–25 For example, Zhang et al.26 enhanced the copper extraction from chalcopyrite using polyoxyethylene nonyl phenyl ether, and the copper concentration in the leaching solution increased from 385.62 to 930.91 mg L−1. Stearyl trimethyl ammonium chloride was used to promote the leaching of nickel from laterite ores, achieving a high efficiency of 94.7% under the optimal conditions.27 Thus, the utilization of surfactants is an effective way to facilitate mineral leaching.
In addition to the efficient utilization, the dissolution of metallic impurities (e.g., iron, aluminum, and magnesium) from the medium and low grade PO should be carefully considered because such impurities decrease the quality of phosphoric acid.28,29 The metallic impurities also cause difficulties in downstream purification and sedimentation. For instance, the impurities in the PO affect the size and shape of the PG crystals.30 The density and viscosity of acid solutions increase as the concentration of dissolved metallic impurities increases.31,32 Therefore, reducing the impurities in the acid solutions is crucial to improve the quality of phosphoric acid and facilitate downstream purification and sedimentation. Karavasteva33 studied a set of surfactants on the acid leaching of zinc calcine and found that the concentration of impurities in the solution decreased in the presence of surfactants. This can be attributed to that surfactants selectively form complexes with cationic ions. Thus, the use of surfactants offers a practical way to decrease the content of impurities in leaching solutions.
In this study, to improve the leaching performance and reduce the dissolution of metallic impurities, we use the surfactants as additives to facilitate the extraction of phosphorus from medium-low grade PO. The optimal experimental condition is determined by investigating the effects of surfactant concentration, sulfuric acid concentration, leaching temperature, and leaching time on the overall leaching performance. The produced leaching solution and residue are measured and analyzed using different analytical techniques. Additionally, measurements on the leaching solution (i.e., surface tension and viscosity) and PO (i.e., the variation in the zeta potential) are performed to better understand the leaching mechanism. Computational simulations are conducted to reveal the adsorption interaction energy between SOL particles and PG surfaces and the corresponding preferential adsorption sites.
2. Materials and methods
2.1. Materials and chemicals
The raw PO is provided by Hubei Xingfa Chemicals Group Co., Ltd., China. It is dried at 60 °C and filtered to maintain particles with a diameter of less than 150 μm. Five surfactants are used for the leaching of PO, including sodium dodecylbenzene sulfonate (SDBS), sodium oleate (SOL), cetyltrimethylammonium bromide (CTAB), polyvinyl pyrrolidone (PVP), and lauryl sulfobetaine (LSB). Details of these surfactants and the sulfuric acid are provided in Table S1.† Deionized water is produced by a water purification system (HMC-WS10, Human Corporation, Korea).2.2. Experiments
 | (1) |
| ηs = ms/Vl | (2) |
2.3. Analytical techniques
PO samples and leaching residues are analyzed by an X-ray diffractometer (XRD-6000, Shimadzu Corporation, Japan) using Cu Kα radiation as the X-ray source (2θ = 5–90°), an X-ray fluorescence (XRF) spectrometer (XRF-1800, Shimadzu Corporation, Japan), and a scanning electron microscopy (SEM) (Quattro S, Thermo Fisher Scientific, US) equipped with an energy dispersive spectroscopy (EDS). The concentration of phosphorus is determined by a UV-Visible (UV-vis) spectrophotometer (722S, Lengguang Tech., China) using ammonium molybdate as the reagent. The concentration of metal ions is determined via an inductively coupled plasma optical emission spectroscopy (ICP-OES) (SPECTROGREEN, SPECTRO Analytical Instruments, Germany). The size and shape of leaching residue particles are analyzed by a dynamic image analyzer (QICPIC/L02-OM, Sympatec, Germany). The surface tension of the solutions is analyzed by a surface tension apparatus (JK99C, POWEREACH, China). The zeta potentials of PO and leaching residues are measured by dynamic light scattering (NanoBrook Omni, Brookhaven Instruments, UK). The viscosity of the leaching solution is measured by a digital rotational viscometer (SNB-2, Jingtian, China).3. Results and discussion
3.1. Characterization of PO samples
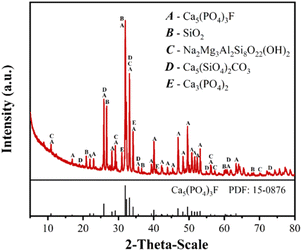
Table 1 tabulates the elemental composition of PO analyzed by the XRF spectrometer. The PO samples mainly contain CaO, P2O5, SiO2, and Al2O3 with mass fractions of 45.79%, 31.69%, 11.39%, and 3.24%, respectively. This can also be observed from the SEM-EDS profile in Fig. S2.† In addition, as can be seen from the XRD pattern in Fig. 1, the PO mainly consists of fluorapatite (Ca5(PO4)3F) and quartz (SiO2), along with a small fraction of other mineralogical phases such as glaucophane (Na2Mg3Al2Si8O22(OH)2), spurrite (Ca5(SiO4)2CO3), and calcium phosphate (Ca3(PO4)2).| Constituent | CaO | P2O5 | SiO2 | Al2O3 | F | MgO |
| Mass fraction (wt%) | 45.79 | 31.69 | 11.39 | 3.24 | 2.40 | 1.44 |
| Constituent | K2O | S | Fe2O3 | Na2O | TiO2 | Others |
| Mass fraction (wt%) | 1.23 | 1.08 | 0.92 | 0.35 | 0.19 | 0.28 |
3.2. Zeta potential analysis and surfactant selection
Many researchers have demonstrated that surfactants can modify the interfacial properties of ore particles and improve ionic diffusion, therefore accelerating the reaction.34,35 Zeta potential is widely used to measure the magnitude of electrostatic repulsion/attraction between particles.36,37 A high zeta potential (in absolute values) indicates high electrical stability. Fig. 2a compares the zeta potential of PO in different solutions at 25 °C. As a benchmark, the zeta potential of PO in an aqueous solution is −16.35 mV. Higher zeta potentials (in absolute values) are observed for PO in CTAB and SOL solutions, whereas PO in other solutions has relatively low zeta potentials. With a negative zeta potential, PO particles can attract hydrogen ions to accelerate the reaction. Therefore, SOL could be a suitable surfactant for the acid leaching of PO. A preliminary experiment of PO leaching verifies that the SOL is the optimal surfactant due to the corresponding high leaching efficiency (cf. Fig. 2b). The experimental results are in good agreement with the previous analysis of zeta potential. The surfactant with a larger negative zeta potential generally has a higher leaching performance. In subsequent experiments, SOL is added to accelerate the acid leaching.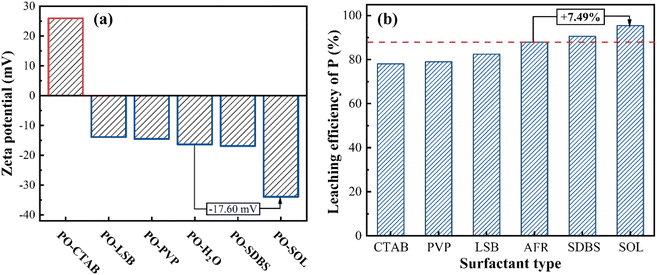 | ||
| Fig. 2 (a) Zeta potential of PO particles in different solutions and (b) leaching efficiency using different surfactants. | ||
3.3. Optimization of experimental conditions
Different experimental variables (i.e., surfactant concentration, sulfuric acid concentration, leaching temperature, and leaching time) are investigated in this section. Table S2† tabulates the values of experimental variables to be optimized. The leaching without surfactants provides a benchmark against the SOL-assisted leaching, hereinafter referred to as AFR and SOL, respectively.Based on the experimental data, the statistical significance of experimental variables is analyzed using Design-Expert. All investigated experimental variables are identified as significant terms in the experiments (cf. Table S3†), indicating the importance of optimizing experimental conditions. Under the optimal experimental condition, the leaching solution and residue are separately obtained for further investigations.
3.4. Metallic impurities in leaching solution
As mentioned above, a lower concentration of metallic impurities in the leaching solution is crucial to improve the quality of phosphoric acid and facilitate downstream purification and sedimentation. Under the optimal experimental condition, the concentrations of iron, aluminum, and magnesium ions in the leaching solution are measured at different lengths of leaching time. Fig. 4 shows that the concentration of metal ions increases with the extension of leaching time. This is easy to understand. The SOL case presents a reduced amount of Mg, Al, and Fe ions in the leaching solution. This indicates that the addition of SOL mitigates the dissolution of metallic impurities from PO. A likely explanation is that metallic impurities and SOL are co-sedimented during the PO leaching. | ||
| Fig. 4 Concentration of metallic impurities including (a) magnesium, (b) aluminum, and (c) iron ions in the leaching solution. | ||
3.5. Sedimentation of leaching solution
The sediment (i.e., sludge) and acid solution are separately obtained after the sedimentation of the leaching solution. The amount of sludge in the SOL case is generally lower than that of the AFR case (cf. Fig. S4†). The main phases of the sludge in different leaching cases are measured by the XRD (cf. Fig. 5a). In the AFR case, the main compositions of sludge are CaSO4·2H2O, CaSO4·0.5H2O, and Al(H2PO4)3. For the SOL case, the main components of the sludge are CaSO4·2H2O and Ca(Si6Al2)O16·4H2O. The X-ray photoelectron spectroscopy spectra (XPS) in Fig. 5b, c and S5† are used to better interpret the compositions of the sludge samples, for both AFR and SOL cases (with the corresponding XPS data tabulated in Table S4†). The survey spectra in Fig. 5b show the identified characteristic peaks for sludges. A P 2p peak located at 134.9 eV is observed for the AFR case, indicating that a certain amount of phosphorus is sedimented from the leaching solution. The detailed high-resolution P 2p peaks in Fig. 5c show that the amount of phosphorus in the AFR sludge is higher than that in the SOL sludge. This is demonstrated by surface atomic compositions determined by semi-quantitative XPS (presented in Table S5†). The P 2p peak of the AFR sludge can be deconvoluted into two peaks that are assigned to H3PO4 and Ca3(PO4)2.40,41 Overall, the addition of SOL can reduce the loss of phosphorus due to the generated sludges. | ||
| Fig. 5 (a) XRD patterns of the sludge samples, (b) overall XPS spectra of the sludge samples, and (c) deconvoluted XPS spectra for P 2p. | ||
Furthermore, to examine the presence of SOL, a triple quadrupole mass spectrometer is used to deduce the structure of the compound in the acid solution using both negative and positive ion mode electrospray ionization. Fig. 6a shows that the oleic acid anion (C18H33O2−) peaks at 281.25 Da based on the LCMS (liquid chromatography-mass spectrometry) analysis. However, the oleic acid anion is not observed in either AFR or SOL cases. This indicates that no oleic acid anions remain in the acid solution. Additionally, in the positive ion mode, there is no apparent match between the SOL reagent and acid solution (see Fig. 6b). Overall, the SOL is not presented in the acid solution.
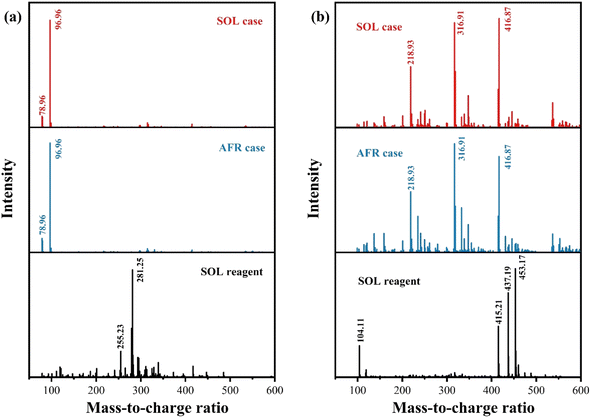 | ||
| Fig. 6 LCMS analysis of the SOL reagent (purity ≥ 98.5%) and the acid solutions in AFR and SOL cases in (a) negative ion mode and (b) positive ion mode. | ||
3.6. Analysis of leaching residues
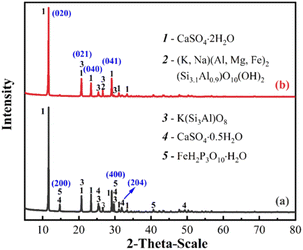
The main elemental compositions of the leaching residue are SO3, CaO, P2O5, SiO2, Al2O3, K2O, Fe2O3 and MgO (cf. Table S6†). The amount of phosphorus remaining in the residue is 2.02% and 0.50% for AFR and SOL cases, respectively. It demonstrates that the addition of SOL facilitates PO leaching. The XRD pattern in Fig. 7 suggests that the main component of the leaching residue is CaSO4·2H2O (i.e., PG). The main diffraction peaks at 14.72°, 29.69°, and 31.90° are respectively assigned to (200), (204), and (400) facets of CaSO4·0.5H2O for the AFR residue.The morphology of the leaching residue is analyzed by SEM. From Fig. 8a, acicular morphology is observed for the AFR leaching residue. However, for the SOL case, platy structures are mainly observed as shown in Fig. 8b. To further confirm this, the box-counting method is used to analyze the fractal dimension of the leaching residue. The fractal dimension plays a vital role to analyze the complexity of objects.42–44 A higher fractal dimension indicates higher complexity and irregularity. As shown in Fig. 8c and d, the SOL leaching residue has a lower geometrical complexity for its smaller fractal dimension. SEM images in Fig. S6† show the formation of crystals in the AFR and SOL leaching residues over time, with acicular and platy crystals observed respectively.
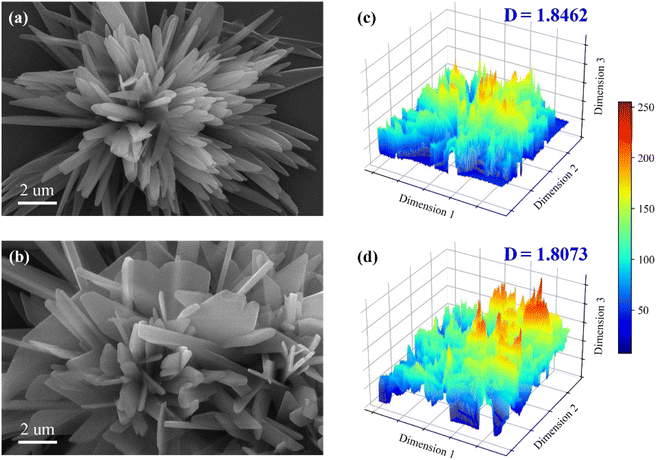 | ||
| Fig. 8 SEM analysis of the leaching residue in (a) AFR and (b) SOL cases and the analysis of fractal dimension (D) for the leaching residue in (c) AFR and (d) SOL cases. | ||
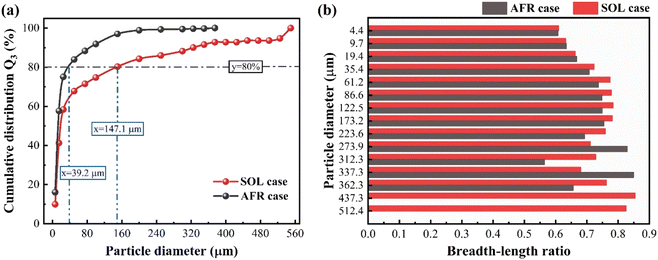
Additionally, we compare particle size and shape of leaching residues using the particle analyzer QICPIC. Fig. 9a shows that the particles of the SOL leaching residue have larger diameters and over 80% of particles have a diameter larger than 147.1 μm. This indicates that more uniform, large, and platy crystals are formed during the SOL-assisted PO leaching. Fig. 9b provides a comparison of the breadth-to-length ratio of leaching residues. The crystal of SOL leaching residues mainly has a breadth-to-length ratio between 0.60 and 0.80. This is due to the co-sedimentation of metallic impurities and SOL, facilitating the growth of PG toward large and uniform crystals.
As mentioned above, the main solid product is PG. The adsorption energy between SOL and different PG surfaces is calculated based on density functional theory (DFT). The optimization of unit cells of crystals and molecules is performed using Materials Studio. The DMol3 module is used to simulate the molecular dynamics of the SOL adsorption on the surface of crystals. More details of the DFT calculations can be found in our previous work.45 Fig. 10 shows the PG crystal structure optimized by Materials Studio, with the structural information of the unit cell tabulated in Table S7.† Fig. 10b–e presents (020), (021), (040), and (041) surfaces of PG crystals, which are also in line with previous reports.46,47 The adsorption of SOL on surfaces (020), (021), (040), and (041) of CaSO4·2H2O are visualized in Fig. S7,† and the corresponding adsorption energy is 0.44, −2.33, −1.13, and −6.72 eV, as tabulated in Table 2. A higher binding energy (absolute value) indicates stronger and more favorable adsorption. Therefore, SOL exhibits a stronger chelating ability with the (041) surface of PG. Therefore, the preferential adsorption of SOL on the (041) surface increases the exposure of the (041) surface, promoting the formation of platy PG crystals.
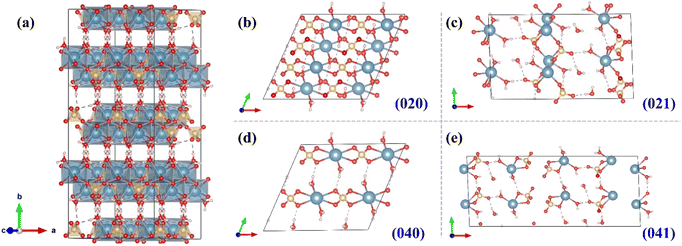 | ||
| Fig. 10 Visualization of (a) the unit cell and (b–e) (020), (021), (040), and (041) surfaces of the PG crystal. | ||
| Crystal surface | EPG-SOL (eV) | EPG (eV) | ESOL (eV) | ΔEads (eV) |
|---|---|---|---|---|
| (020) | −360![[thin space (1/6-em)]](https://www.rsc.org/images/entities/char_2009.gif) 420.86 420.86 |
−332![[thin space (1/6-em)]](https://www.rsc.org/images/entities/char_2009.gif) 741.90 741.90 |
−27![[thin space (1/6-em)]](https://www.rsc.org/images/entities/char_2009.gif) 679.40 679.40 |
0.44 |
| (021) | −360![[thin space (1/6-em)]](https://www.rsc.org/images/entities/char_2009.gif) 414.90 414.90 |
−332![[thin space (1/6-em)]](https://www.rsc.org/images/entities/char_2009.gif) 733.19 733.19 |
−27![[thin space (1/6-em)]](https://www.rsc.org/images/entities/char_2009.gif) 679.38 679.38 |
−2.33 |
| (040) | −194![[thin space (1/6-em)]](https://www.rsc.org/images/entities/char_2009.gif) 049.17 049.17 |
−166![[thin space (1/6-em)]](https://www.rsc.org/images/entities/char_2009.gif) 368.62 368.62 |
−27![[thin space (1/6-em)]](https://www.rsc.org/images/entities/char_2009.gif) 679.42 679.42 |
−1.13 |
| (041) | −360![[thin space (1/6-em)]](https://www.rsc.org/images/entities/char_2009.gif) 393.52 393.52 |
−33![[thin space (1/6-em)]](https://www.rsc.org/images/entities/char_2009.gif) 2707.41 2707.41 |
−27![[thin space (1/6-em)]](https://www.rsc.org/images/entities/char_2009.gif) 679.39 679.39 |
−6.72 |
The above investigations on the leaching residue indicate that the SOL inhibits the growth of (200), (400), and (204) surfaces of PG crystals. Platy PG crystals with larger particle sizes and larger breadth-to-length ratios are obtained. SOL promotes the detachment of PG from PO, thereby facilitating the PO leaching and improving the leaching performance.
4. Analysis of enhancement mechanism
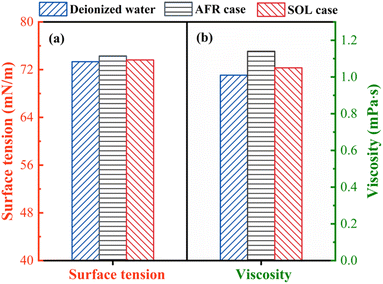
Surface tension and viscosity of the leaching solution are measured to explain the effect of SOL on the PO leaching. The addition of surfactant reduced the surface tension of the solution, which increased the wettability of particles and reduced particle–particle interaction.48 Fig. 11a shows the surface tension of the leaching solution for both AFR and SOL cases, benchmarking against the deionized water. The SOL leaching solution shows a lower surface tension than that of the AFR leaching solution, which allows for improved ionic diffusion and liquid–solid contact. Additionally, the viscosity of the solution also has an important effect on the leaching because a high solution viscosity hinders mass transfer.49 Fig. 11b presents the viscosity of the deionized water and the leaching solutions obtained from AFR and SOL cases. The viscosity of the SOL leaching solution is lower than that of the AFR leaching solution, allowing for a higher overall mass transfer coefficient. Therefore, the low surface tension and viscosity could explain the high performance of the SOL-assisted leaching.Phosphorus in PO mainly exists in the form of fluorapatite (Ca5(PO4)3F). To better illustrate the adsorption behavior of SOL on PO, we visualized the fluorapatite crystal structure to showcase its interaction with SOL. A unit cell of fluorapatite (cf. Fig. 12a) is constructed based on the structural information obtained from the American Mineralogist Crystal Structure Database50 (tabulated in Table S8†). The (001) surface of fluorapatite crystals is used to illustrate the interaction because it is the most exposed and stable (i.e., with the lowest surface energy).51,52 SOL is a common anionic surfactant, whose polar group presents electronegative.53 When SOL is added into the system, the polar group is adsorbed on the fluorapatite surface and the nonpolar group is oriented towards leaching solution externally, as shown in Fig. 12b. The PO particles will be in a stable dispersion state due to the electrostatic repulsion, which also contributes to the contact between the PO surface and the leaching solution. Thus, such interactions between SOL and PO would promote the dissolution of PO and therefore improve the leaching efficiency.
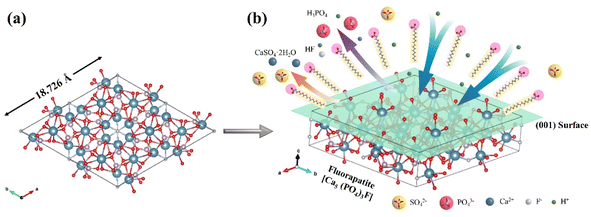 | ||
| Fig. 12 Visualization of (a) the fluorapatite crystal and (b) the adsorption of SOL on the PO surface. | ||
5. Conclusion
This study adopted SOL as an additive to investigate its performance in facilitating PO leaching. The SOL is determined as a suitable surfactant based on the zeta potential analysis. Under the optimal experimental condition (SOL concentration of 10 mg L−1, sulfuric acid concentration of 1.72 mol L−1, leaching temperature of 75 °C, and leaching time of 180 min), a high leaching efficiency of 99.51% is achieved. It is 12.89% higher than the leaching without the addition of SOL. In addition, SOL-assisted leaching presents a lower concentration of metallic impurities in the leaching solution. This increases the quality of phosphoric acid and could promote downstream purification and sedimentation. The low surface tension and viscosity of the leaching solution are beneficial for ionic diffusion and liquid–solid contact, therefore leading to the high performance of SOL-assisted leaching. The DFT-based calculation indicates that SOL is preferentially adsorbed on the (041) surface of PG crystals, tuning the PG morphology from the acicular shape to the platy shape. Overall, this study demonstrates the advantages of SOL in improving the leaching performance and reducing the metallic impurities in the leaching solution, enabling the high-efficient utilization of PO and the production of high-purity phosphoric acid.Despite that a lower content of metallic impurities is achieved, it is still insufficient for subsequent nucleation and crystallization to produce high-quality products. Thus, a further investigation of thorough removal of metallic impurities is necessary to ensure the quality of the final products. Additionally, from the perspective of industrial production, a huge amount of sludge will be produced, which deserves further investigation. Therefore, the recovery and utilization of the deposited sludge could also be an interesting and meaningful topic for future work. Moreover, further research in the study of crystallization kinetics would be of great help in understanding the mechanism of crystal growth and for controlling the crystal shape.
Author contributions
Yuhe Zhou: investigation, conceptualization, formal analysis, writing – original draft. Guocan Zheng: resources, funding acquisition. Shaodou Cen: software. Renlong Liu: supervision, project administration, funding acquisition, writing – review & editing. Changyuan Tao: supervision.Conflicts of interest
There are no conflicts to declare.Acknowledgements
This work is supported by the National Key Research and Development Program of China under grant [number 2019YFC1905800] and the National Natural Science Foundation of China under grant [number U180220150]. We thank Prof. Zuohua Liu for the generous support on this work.References
- H. Zhuang, Y. Zhong and L. Yang, Chin. J. Chem. Eng., 2020, 28, 2758–2770 CrossRef CAS
.
- S. Pavón, N. Haneklaus, K. Meerbach and M. Bertau, Miner. Eng., 2022, 182, 107569 CrossRef
.
- Statista, 2022, https://www.statista.com/statistics/1289304/global-phosphoric-acid-production-capacity/.
- Z. Ren, W. Zeng, H. Liu, Y. Jia, X. Peng and Y. Peng, Process Saf. Environ. Prot., 2021, 156, 121–133 CrossRef CAS
.
- P. Becker, Phosphates and phosphoric acid: raw materials, technology, and economics of the wet process. revised and expanded, Marcel Dekker, Inc., 1989 Search PubMed
.
- H. Ma, X. Feng and B. Zeng, Process Saf. Environ. Prot., 2018, 118, 330–347 CrossRef CAS
.
- H. Tayibi, M. Choura, F. A. Lopez, F. J. Alguacil and A. Lopez-Delgado, J. Environ. Manage., 2009, 90, 2377–2386 CrossRef CAS PubMed
.
- H. Li, W. Ge, J. Zhang, R. M. Kasomo, J. Leng, X. Weng, Q. Chen, Q. Gao, S. Song, L. Xiao and C. Tian, Hydrometallurgy, 2020, 195, 105364 CrossRef CAS
.
- B. Ji, Q. Li, Q. Huang and W. Zhang, J. Cleaner Prod., 2021, 319, 128654 CrossRef CAS
.
- X. Shao, H. Yao, S. Cui, Y. Peng, X. Gao, C. Yuan, X. Chen, Y. Hu and X. Mao, Sci. Total Environ., 2021, 780, 146550 CrossRef CAS PubMed
.
- A. Z. Abouzeid, Int. J. Miner. Process., 2008, 85, 59–84 CrossRef CAS
.
- B. Issa and T. A. Aleksandrova, IOP Conf. Ser.: Mater. Sci. Eng., 2019, 582, 012022 CAS
.
- T. Aleksandrova, A. Elbendari and N. Nikolaeva, Miner. Process. Extr. Metall. Rev., 2022, 43, 22–27 CrossRef CAS
.
- Y. Zhou, G. Zheng, Y. Long, Z. Liu, C. Tao and R. Liu, Hydrometallurgy, 2022, 210, 105842 CrossRef CAS
.
- D. E. Lazo, L. G. Dyer and R. D. Alorro, Miner. Eng., 2017, 100, 115–123 CrossRef CAS
.
- M. Gharabaghi, M. Irannajad and M. Noaparast, Hydrometallurgy, 2010, 103, 96–107 CrossRef CAS
.
- B. Li, H. Peng and J. Guo, Appl. Sci., 2019, 9, 1684 CrossRef CAS
.
- Z. Lin, F. Xu, L. Wang, L. Hu, L. Zhu, J. Tan, Z. Li and T. Zhang, Chin. J. Chem. Eng., 2021, 34, 53–60 CrossRef CAS
.
- M. Clotilde Apua and M. S. Madiba, J. Taiwan Inst. Chem. Eng., 2021, 121, 313–320 CrossRef CAS
.
- C. Liu, S. Liu, Y. Qin, J. Ma, Z. Wu, J. Zhou, R. Lyu and C. Wang, Sep. Purif. Technol., 2019, 212, 89–100 CrossRef CAS
.
- W. Pan, H. Jin, Z. Liu, J. Tang and S. Cheng, Process Saf. Environ. Prot., 2020, 137, 289–299 CrossRef CAS
.
- N. Saxena, N. Pal, S. Dey and A. Mandal, J. Taiwan Inst. Chem. Eng., 2017, 81, 343–355 CrossRef CAS
.
- P. Zhang, L. Sun, H. Wang, J. Cui and J. Hao, J. Cleaner Prod., 2019, 228, 1–7 CrossRef CAS
.
- X. Zeng, J. Shu, M. Chen, J. Wang, D. He, Y. Wei, Y. Deng, T. Lei, Z. Liu, D. Tan and Q. Zhang, Hydrometallurgy, 2022, 211, 105870 CrossRef CAS
.
- D. Wu, W. Ma, S. Wen, J. Deng and S. Bai, Miner. Eng., 2017, 114, 1–7 CrossRef CAS
.
- H. Zhang, D. Wei, W. Liu, D. Hou and R. Zhang, Miner. Eng., 2021, 173, 107237 CrossRef CAS
.
- P. Zhang, H. Wang, J. Hao and J. Cui, Front. Chem. Sci. Eng., 2021, 15, 562–570 CrossRef CAS
.
- A. Hannachi, D. Habaili, C. Chtara and A. Ratel, Sep. Purif. Technol., 2007, 55, 212–216 CrossRef CAS
.
- B. Wang, L. Yang and J. Cao, ACS Sustainable Chem. Eng., 2021, 9, 14365–14374 CrossRef CAS
.
- W. W. F. Annalize Kruger, Z. Kwela and R. Fowles, Ind. Eng. Chem. Res., 2001, 40, 1364–1369 CrossRef
.
- M. E. D. W. E. Cate, J. Chem. Eng. Data, 1970, 15, 291–295 CrossRef
.
- H. Abdel-Ghafar, E. Abdel-Aal, M. Ibrahim, H. El-Shall and A. J. H. Ismail, Hydrometallurgy, 2019, 184, 1–8 CrossRef CAS
.
- M. Karavasteva, Hydrometallurgy, 2001, 62, 151–156 CrossRef CAS
.
- J. Yu, Y. Ge, X. Guo and W. Guo, Sep. Purif. Technol., 2016, 161, 88–95 CrossRef CAS
.
- C. Zhang, P. Li, Y. Cao, H. Hao, W. Peng, D. Teng and G. Fan, Sep. Purif. Technol., 2022, 284, 120283 CrossRef CAS
.
- D. Al Mahrouqi, J. Vinogradov and M. D. Jackson, Adv. Colloid Interface Sci., 2017, 240, 60–76 CrossRef CAS PubMed
.
- Q. Cao, J. Cheng, S. Wen, C. Li, S. Bai and D. Liu, Miner. Eng., 2015, 78, 114–121 CrossRef CAS
.
- Z. Sakhaei and M. Riazi, Process Saf. Environ. Prot., 2022, 161, 758–770 CrossRef CAS
.
- A. Shadloo, K. Peyvandi and A. Shojaeian, J. Mol. Liq., 2022, 347, 117971 CrossRef CAS
.
- Y. Barbaux, M. Dekiouk, D. Le Maguer, L. Gengembre, D. Huchette and J. J. A. C. A. G. Grimblot, Appl. Catal., A, 1992, 90, 51–60 CrossRef CAS
.
- S. H. Dittma, Z. Naturforsch., B: J. Chem. Sci., 1974, 29, 312–317 CrossRef
.
- R. J.-F. Soille Pierre, J. Visual Commun. Med., 1996, 7, 217–229 Search PubMed
.
- X. Yang and M. Wang, Constr. Build. Mater., 2021, 270, 121376 CrossRef
.
- X. Xing, Z. Zhao and J. Wu, Chin. J. Chem. Eng., 2020, 28, 466–476 CrossRef CAS
.
- Y. Zhou, S. Wu, R. Liu, Z. Liu and C. Tao, J. Water Process. Eng., 2022, 45, 102532 CrossRef
.
- X. Sun, G. Zhang and P. Cui, RSC Adv., 2019, 9, 21601–21607 RSC
.
- S. Zhang, H. Qu, Z. Yang, C.-e. Fu, Z. Tian and W. Yang, Desalination, 2017, 419, 152–159 CrossRef CAS
.
- S. Pattanaik, P. K. Parhi, D. Das and A. K. Samal, J. Taiwan Inst. Chem. Eng., 2019, 99, 193–200 CrossRef CAS
.
- E. Karami, L. Kuhar, A. Bona and A. N. Nikoloski, Miner. Eng., 2021, 170, 107029 CrossRef CAS
.
- A. Eskanlou, Q. Huang, Y. Foucaud, M. Badawi and A. H. Romero, Appl. Surf. Sci., 2022, 572, 151499 CrossRef CAS
.
- J. Xie, X. Li, S. Mao, L. Li, B. Ke and Q. Zhang, Appl. Surf. Sci., 2018, 444, 699–709 CrossRef CAS
.
- P. Rulis, H. Yao, L. Ouyang and W. Y. Ching, Phys. Rev. B, 2007, 76, 245410 CrossRef
.
- Z. Yuan, X. Zhao, Q. Meng, Y. Zhang and Y. Xu, Miner. Eng., 2021, 171, 107128 CrossRef CAS
.
Footnote |
| † Electronic supplementary information (ESI) available. See DOI: https://doi.org/10.1039/d3ra00897e |
| This journal is © The Royal Society of Chemistry 2023 |

