 Open Access Article
Research on the physical properties of LiMn0.5Fe2O4 spinel ferrites by the combination of optical, magnetic, and dielectric behaviors
Ibtihel Soudani a,
Khawla Ben Brahim
 *b,
Abderrazek Oueslati
 b,
Abdelhedi Aydia,
Kamel Khirounic,
A. Benalide,
E. Dhahri
 d and
M. A. Valente
 e
e
aLaboratory of Multifunctional Materials and Applications (LaMMA), LR16ES18, Faculty of Sciences of Sfax, University of Sfax, BP 1171, 3000 Sfax, Tunisia
bLaboratory for Spectroscopic and Optical Characterization of Materials (LaSCOM), Faculty of Sciences, University of Sfax, B. P. 1171, 3000 Sfax, Tunisia. E-mail: benbrahimkhawla75@gmail.com
cLaboratory of Physics of Materials and Nanomaterials Applied to the Environment (LaPHYMNE), Faculty of Sciences, University of Gabès Cited Erriadh, 6079 Gabès, Tunisia
dLaboratoire de Physique Appliquée, Faculté des Sciences, Université de Sfax, B.P. 1171, 3000, Sfax, Tunisia
ePhysics Department, I3N, University of Aveiro, Campus de Santiago, Aveiro, Portugal
First published on 20th March 2023
Abstract
Ferrite compounds have recently attracted significant interest because of their multifunctional properties. This work investigates the optical, magnetic, and dielectric properties of a LiMn0.5Fe2O4 ferrite prepared by a solid-state reaction. Raman spectroscopy analysis substantiated the presence of the 5 active modes representing the vibration of the oxygen anion at both tetrahedral and octahedral sites. The direct optical band gap was estimated to be 3.51 eV, which indicates the semiconductor behavior of the compound. A theoretical modulation of the hysteresis loop was done to confirm the dominance of the ferromagnetic contribution over the antiferromagnetic one. Furthermore, the dielectric permittivity result indicated a colossal value of the order of 103. The dielectric losses are characterized by the Giuntini law to extract the relaxation process, which is hidden by the DC-conductivity process. Our results indicate the potential of LiMn0.5Fe2O4 for applications in multifunctional devices.
1 Introduction
Research in nanotechnology is a fast-growing field at the forefront of physics and is attracting special interest from the scientific community.1 Multifunctional materials, in particular, are investigated for their advantageous properties that are combined in one smart compound.2,3 A broad range of intelligent materials have been proposed and among them, ferrites have drawn significant attention and are deemed to be promoter hosts due to their extremely prominent features.4,5Significant findings in this category of ceramics generally reveal excellent physicochemical properties, such as environmental benignity,6 chemical stability,7 high electrical resistivity,8 and availability at low cost.9 It is noteworthy to mention that a promising path has been paved for spinel ferrites to be useful for potential technological applications. Some outstanding review articles have indicated that using spinel ferrites for biomedical applications may become inevitable due to their high biocompatibility10 and low toxicity.6 It has also been shown that they have special properties for magnetic hyperthermia, and magnetic resonance imaging.11,12 Similarly, many discoveries have confirmed the development of this type of material as a suitable approach for ferrofluid technology,13 wastewater treatment,14 catalysts,14 selective sun absorbers,15 and medical tools.16
Some achievements and review reports relating to different spinel ferrites are proposed and investigated in detail for their properties, including lithium-based ferrites Li-Co,17 Li-Zn,18 Li-Mg,19 and Ni–Li.20 Lithium ferrites are among the striking chief ferrite materials on account of their low eddy current losses, high spontaneous magnetization, excellent ferromagnetic squareness, high Curie temperature, and catalytic behavior.21–24 Various reports have indicated that Li-based ferrites are usually electrically highly resistive.25 However, under an applied external electric field in the microwave and radio frequency ranges, they provoke high dielectric losses.
Several strategies and synthesis pathways are used for the formation of Li-based spinel ferrites, including solid-state reactions, co-precipitation,26 hydrothermal,27 microemulsion,28 and sol–gel methods,29 and the cation distribution and crystal structure change from one ferrite to another. All these factors prevent the materials from keeping the usual properties of a typical spinel ferrite structure10 but different preparation processes and thermal treatment allow such difficulties to be overcome.
Lithium manganese ferrite is one of the most interesting ferrite materials. The XRD diffraction peaks correspond to those of the cubic LiMn0.5Fe2O4 spinel.30 Our previous results30 revealed that the compound could be a multifunctional material with the potential to drive technological innovation forward. The electrical properties of the compound have proven that it can be used in various applications such as optoelectronics, photodetectors, photovoltaics, and full-cell low temperature-co-fired ceramics (LTCCs).30 Moreover, our sample can be suitable for device performance ameliorating the sensitivity of uncooled infrared bolometers after comparing its (TCR) with other previous works. It also represents anomalous behaviors because it combines magnetic and non-magnetic elements. In this kind of ferrite, the magnetic properties are governed by the spin coupling of the 3d electrons.31
Our previous electrical search30 is insufficient to evaluate, describe, and clarify all possible fields where it is suitable for use. Therefore, in this scientific report, an attempt has been made to analyze the magnetic, and optical properties. Besides, we have undertaken further studies about dielectric relaxation and modulus formalism depending on temperature and we present an exhaustive idea about the studied sample to make it useful in diverse applications.
2 Experimental details
2.1 Preparation method
The conventional solid-state method was used to prepare the LiMn0.5Fe2O4 spinel ferrite ceramic. The protocol for preparation is depicted in detail in our previous paper.30All precursors (Li2CO2, MnO, Fe2O3) were purchased from Sigma-Aldrich (purity of 99.99%) and utilized without further purification. The pure chemical reactants were at first dried and intimately mixed in stoichiometric quantities according to the reaction as follows:
| 1/2Li2CO3 + 1/2MnO + Fe2O3 → LiMn0.5Fe2O4 + 1/2CO2 |
The obtained mixture was well-ground and pressed into a pellet (disk-shaped) of about 1 mm in thickness, which is essential for a homogenous mixture of reactants and to facilitate element diffusion. The pellet was calcined at 850 °C in an electrical muffle furnace for 7 h. In the final step, it was subjected to many sintering heating cycles up to 1100 °C for 2 h, accompanied by grinding and pelletizing yields to obtain a homogenous, pure, and compact crystallized sample.
2.2 Characterization techniques
Raman scattering measurements were recorded at room temperature using a SENTERRA Spectrometer (Bruker) with green laser excitation of 540 nm. Fourier-transform infrared (FTIR) spectra were obtained on a Bruker Tensor 27 spectrophotometer.To determine the energy bandgap (Eg) and confirm the semiconductor nature of the sintered sample from the absorption spectra, UV-vis spectroscopy analysis was employed. The hysteresis cycle of the ferrite was carried out using a SQUID magnetometer at 5 K and the ambient temperature (300 K) under a magnetic field up to 10 T.
To prepare the sample for dielectric measurement, a thin layer of silver was coated on both faces of the LiMn0.5Fe2O4 pellet by a vacuum thermal evaporator. The measurements were deduced from impedance spectroscopy with a Janis VPF800 cryostat and an Agilent 4294A analyzer in the explored range of frequency [100–10 MHz]. We measured the real and imaginary parts of the complex impedance Z* versus the frequency.
3 Results and discussion
3.1 X-ray diffraction analysis
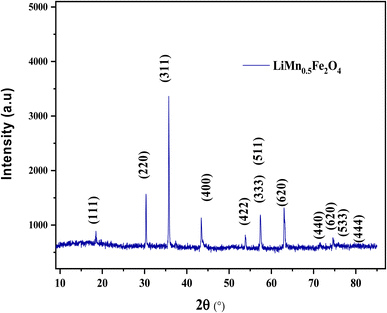
The X-ray diffractogram patterns of the LiMn0.5Fe2O4 sample were recorded at room temperature, as shown in Fig. 1. All the reflection peaks are well indexed in the cubic system with Fd![[3 with combining macron]](https://www.rsc.org/images/entities/char_0033_0304.gif) m space group. The absence of impurity peaks proves the pure and high quality of the produced compound. All the structural parameters deduced from the Rietveld analysis were mentioned in our previous work.30
m space group. The absence of impurity peaks proves the pure and high quality of the produced compound. All the structural parameters deduced from the Rietveld analysis were mentioned in our previous work.30
3.2 Scanning electron microscopy analysis
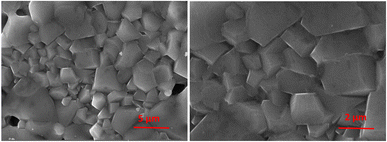
The morphology of the LiMn0.5Fe2O4 sample, carried out by scanning electron microscopy (SEM), is depicted in Fig. 2. The grains are polygonal-shaped and polyhedron-shaped. The average estimated diameter of the grain was relatively large, of the order of 2.48 μm, as detailed in our preceding paper.303.3 Raman spectroscopy
Raman spectroscopy is broadly used as an effective microscopic technique to determine more structural properties and complementary details of the prepared compounds. It is also used to explore the short-range cationic disorder due to its high sensitivity and its lofty spatial resolution to investigate the vibrational levels in spinel ferrites.32The factor group process foretells the subsequent vibrational modes in spinel by the following:
| Γ = A1g(R) + Eg(R) + 3F2g(R) | (1) |
![[3 with combining macron]](https://www.rsc.org/images/entities/char_0033_0304.gif) m space group30 and according to group theory, 5 Raman active modes (A1g + Eg + 3F2g), acquired under ambient conditions, are recognized for this structure space group. They are dependent on the motion of both A and B site cations and oxygen ions.33
m space group30 and according to group theory, 5 Raman active modes (A1g + Eg + 3F2g), acquired under ambient conditions, are recognized for this structure space group. They are dependent on the motion of both A and B site cations and oxygen ions.33
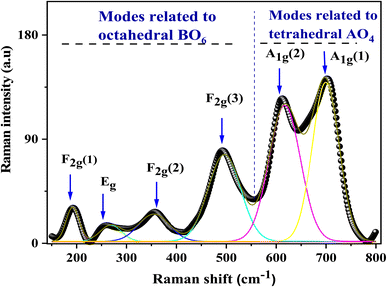
The Raman spectrum was acquired at room temperature in the spectral range varying from 150 to 800 cm−1 and illustrated in Fig. 3. It was properly analyzed and deconvoluted via fitting by the Lorentzian peak shape function to evaluate the full width at half maximum (FWHM), and the positions of obtained bands. The different peaks were assigned pursuant to the theoretical vibrational mode. The detected Raman modes match well with the literature reports. They were centered at 192, 259, 360, 490, and 612 cm−1 and allocated to F2g (1), Eg, F2g (2), F2g (3), and A1g (1) Raman vibrational modes, respectively, as shown in Table 1.
| Position (cm−1) | Raman mode | FWHM (cm−1) | Assigned polyhedron |
|---|---|---|---|
| 192 | F2g (1) | 118 | FeO6 |
| Octahedron | |||
| 259 | Eg | 120 | FeO6 |
| Octahedron | |||
| 360 | F2g (2) | 120 | FeO6 |
| Octahedron | |||
| 490 | F2g (3) | 121 | FeO6 |
| Octahedron | |||
| 611 | A1g | 120 | FeO4 |
| Tetrahedron |
The A1g mode attributed to the uppermost frequency is represented as though a symmetric stretching exists between the oxygen atom and the iron metal ion located in tetrahedral sites.34 The Eg Raman mode is assigned to the symmetric bending motion of the oxygen anion with respect to the iron situated at the octahedral site. The second highest frequency F2g (3) mode is the anti-symmetric bending motion of the oxygen anion within the octahedral site. F2g (2) is the mode antisymmetric stretching vibration mode of the oxygen anion with respect to the iron at the octahedral site (it is displaced in differing directions) and the fifth active Raman mode F2g (1) represents a complete translation development of the whole at the octahedral unit in the spinel lattice.
Raman peak frequencies higher than 600 cm−1 were assigned to the Raman active mode A1g, related to the motion of O2− ions within the tetrahedral sublattice (site A), while the rest of the peaks are due to the vibration of the oxygen atom and octahedral group (site B).35 The absence of peaks attributed to any foreign oxide phase (iron oxide phase) is probing the chemical purity of the sample.
The Raman spectrum detects the attendance of extra peaks at 611 cm−1 and 705 cm−1 attributed to A1g (1) and A1g (2). Biplab K. Chatterjee et al.36,37 suggested that they are probably linked to a breakdown of the momentum conservation rule because the wavelength of exciting radiation is higher than the diameter of the particle. Other authors estimate that this behavior is a typical feature of a mixed or inverse spinel structure.38
3.4 FTIR studies
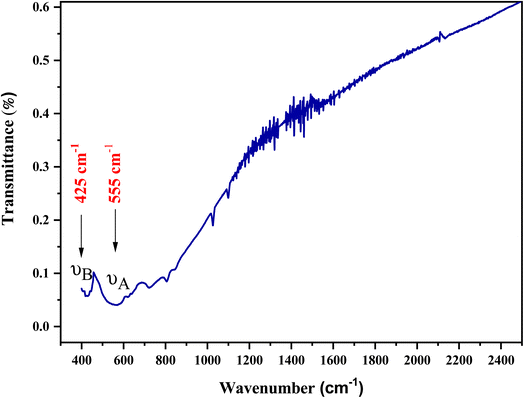
Fourier transform infrared (FTIR) measurements aid in determining and monitoring the degree of crystallization in the studied crystalline compound. The FTIR results of LiMn0.5Fe2O4 after absorption in the wave number range of 400–2500 cm−1 can be viewed in Fig. 4. The presence of two infrared absorption bands in the high-energy region (at low frequency) proves that our sample is well-crystallized and confirms the presence of the spinel structure, as reported in Waldron's classification.39 The absorption band (νB) observed at 425 cm−1 is attributed to metal–oxygen stretching in the octahedral site while the second band (νA) at 555 cm−1 is related to the stretching of metal–oxygen at the tetrahedral site. Given that the bond length in the octahedral is longer than that in the tetrahedral site, this can explain the fact that the band frequency of the stretching vibration in the tetrahedral site is higher than that of the octahedral site.403.5 Absorption study
Our target in this section is to estimate the light efficiency and the quality of our prepared spinel ferrite compound by presenting and discussing its fundamental optical properties. The ultraviolet-visible absorbance spectrum was registered in the range extending from 200 to 800 nm at ambient temperature (Fig. 5). According to previous reports on spinel ferrites, the absorption can be related to the Fe3+ transitions (from 3d5 to 3d4 4s1) or the photoexcitation process, which appears where the electron leaves the valence band (VB) (O2p level) to go to the conduction band (CB) (Fe3d level) after excitation by visible light.41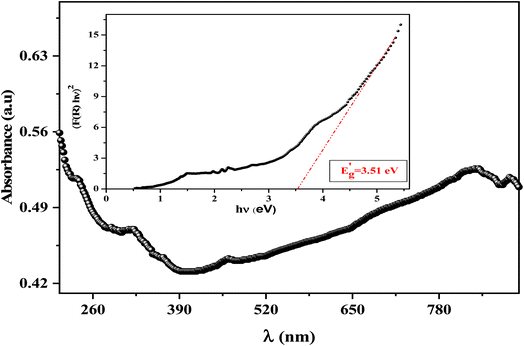 | ||
| Fig. 5 UV-visible absorbance spectra of LiMn0.5Fe2O4 at room temperature; the inset shows the Tauc plot for the determination of the bandgap value for the LiMn0.5Fe2O4 compound. | ||
The optical bandgap  denotes the photon energy that should be absorbed by the electron to transit from the (VB) to (CB). This value is obtained by using both the Kubelka–Munk function and the Tauc plot.42
On the one hand, the Kubelka–Munk function is as follows:
 | (2) |
On the other hand,  , where A1 is a steady parameter that reveals the degree of disorder in the structure of our compound, hν is the incident photon's energy and the exponent n has 2 values (1/2, and 2) according to the type of allowed optical transition. n is equal to 1/2 in the direct transition and equal to 2 for the indirect transition. LiMn0.5Fe2O4 shows a direct band gap like other compounds belonging to the spinel ferrite family.41,43,44 The inset in Fig. 5 exhibits the variation of (F(R)hν)2 as a function of hν, the forbidden band value (Eg) is obtained by the extrapolation line of the curve to the energy axis (at the origin of the y-axis). The optical bandgap of the sample is 3.51 eV which falls in the range of a semiconductor bandgap. The semiconducting nature of this material makes it a promising candidate for photodetectors and photovoltaics applications.44
To ensure the value of the energy gap, the curve of dR/dλ versus wavelength was plotted in Fig. 6. It gives a shred of evidence for the presence of an optical bandgap that lies at 3.57 eV, close to what is obtained by Kubelka–Munk. Thereby, we confirmed the direct type of transition and the semiconducting nature of the synthesized ceramic.
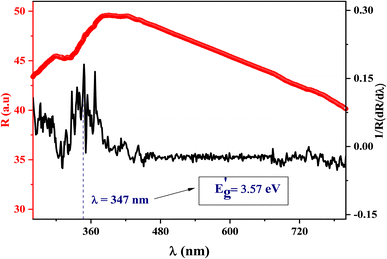 | ||
| Fig. 6 The smoothed reflectance spectra of LiMn0.5Fe2O4 with its first derivative (1/R) (dR/dλ) curve. | ||
The energy gap value is significantly higher than the energy prerequisite for water splitting (E > 1.23 eV). This allows the use of the material for photocatalysis under visible light.41 The refractive index (n0) has an essential role in the control of the optical and electric properties of the studied material. Also, the knowledge of the index n0 indicates the compactness of our sample and aids in gaining insight into its good quality.45
In this paper, the refractive index of ferrite is determined according to Moss's empirical relation as reported:32
 | (3) |
The obtained value of the refractive index was 2.37. This reflects the good quality of our compound. Likewise, the high-frequency optical dielectric constant (ε∞) of our prepared ferrite is related to the refractive index (n0) as stated in the following relation:32
| ε∞ = n02 | (4) |
The optical dielectric is equal to 5.62. The refractive index and high-frequency dielectric constant are similar to those obtained for the material, which is considered a good candidate in the modeling of heterostructure solar cells as well as in laser optoelectronic devices.46 Ultimately, the prepared spinel ferrite LiMn0.5Fe2O4 is full of promise in the optical domain.
3.6 Magnetic study
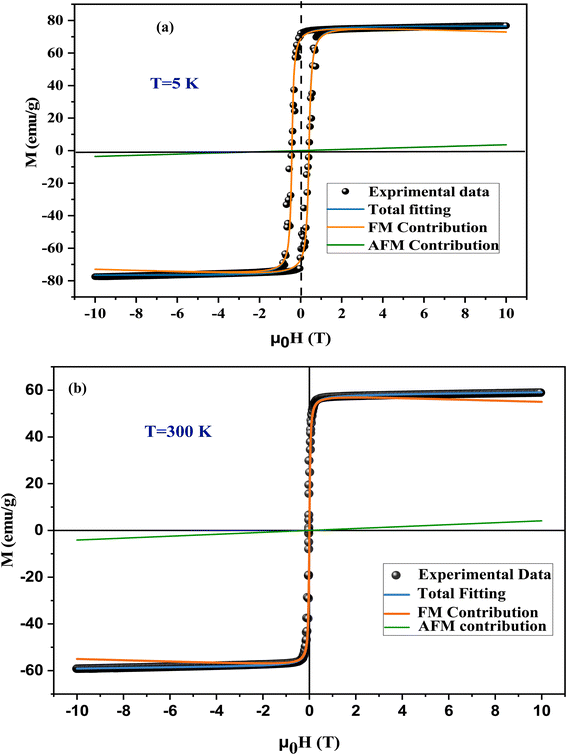
The magnetic hysteresis loop M(H) of the LiMn0.5Fe2O4 powder at 5 K and 300 K are depicted in Fig. 7a and b, respectively, with the applied field reaching 10 T. At room temperature, the hysteresis loop shows a small surface area that highlights the low energy loss over the magnetization–demagnetization procedure.47 Hence, the LiMn0.5Fe2O4 is suitable for magnetic refrigeration application.The hysteresis cycle at 5 K showed a significant remanence which became negligible at 300 K (Fig. 7(b)). The coercivity is low, which may be related to the superparamagnetic behavior of this material. The large size of particles DSEM deduced from scanning emission microscopy (DSEM is about 2.48 μm (ref. 30)) indicates great potential for developing and improving superparamagnetic nanoparticles from metal oxide material, especially spinel ferrite.48
This makes the studied sample suitable for the biomedical domain as a contrast improvement instrument for magnetic resonance imaging (MRI) and hypothermia, as well as for designing polyvalent tools to change magnetization with a low outer magnetic field.47
We found that the magnetization reached saturation at weak fields below 0.5 T. This behavior is explained by the alignment of the spins of the fine nanoparticles in the direction of the applied field. Two types of interactions can exist in the sample, namely, antiferromagnetism (AFM) and ferromagnetism (FM). In the next step, we aspired to better understand the origin of magnetization and segregate the antiferromagnetic (AFM) and ferromagnetic (FM) contributions in the synthesized sample. A theoretical modulation of hysteresis loops was done according to the following equation:49
 | (5) |
| AFM contribution | HCI (Oe g−1) | FM contribution | % | ||||
|---|---|---|---|---|---|---|---|
| χ (10−5 emu × Oe g−1) | M (10 T) | MSFM (emu g−1) | MRFM (emu g−1) | FM | AFM | ||
| 5 (K) | 2.776 | 4241 | 76.62 | 73.02 | 68.51 | 95.3 | 4.7 |
| 300 (K) | 3.1267 | 40 | 59.10 | 54.97 | 1.01 | 93 | 7 |
In the framework of investigation in the relation between the saturation magnetization (Ms) and coercive field (Hc), Stoner–Wohlfarth estimates the value of constant anisotropy related to the coercivity using the below relation:50
 | (6) |
This relation shows that constant anisotropy K1 is proportional to HC and inversely proportional to Ms which is confirmed by other studies.32
To go further, we ascertained whether our sample is useful for high-frequency microwave devices. Here, we determined the microwave frequency (ωm) utilizing the given relation:32
| ωm = δ18π2MS | (7) |
3.7 Dielectric study
The dielectric permittivity affords important insight into the prepared material. It represents the ability of the material to polarize under the effects of applied electric fields.53 Spinel ferrites are usually good dielectric materials,54 depending firmly on some variables such as the cation distribution among the interstitial sites, grain size, stoichiometries, and the synthesis procedure. The complex permittivity of the studied material was expressed by the following relation:53
 | (8) |
It is well known that ε′ is the real part of the dielectric permittivity that gives an idea of the stored energy and ε′′ is the imaginary part that describes dissipation energy in the material. C0 denotes the vacuum capacitance and ω is the angular frequency (=2πf).
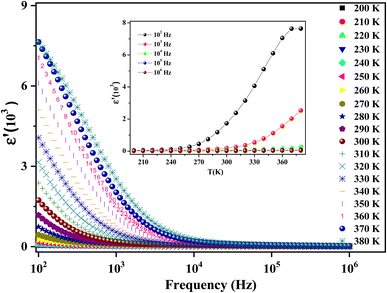
The recorded dielectric data of the real permittivity ε′ is plotted in Fig. 8. A high dielectric permittivity value is presented in the low-frequency region, which is promising in many technological applications.55 The dielectric constant diminishes continuously with increasing frequency. This decreasing trend is observed in many investigations of different spinel materials.56,57 Exploring the structure of ferrites, which are generally composed of grains separated by grain boundaries, aids in understanding the behavior of ε′. Pubby et al.58 suggested that grain boundaries impose dielectric properties at low frequencies.59 Mostly, the grains are good conductors and the grain boundaries are poor conductors. This conductivity difference induces an accumulation of load carriers at boundaries, which creates space charge polarization. The authors explain the effect of the behavior of the real part of the permittivity with the variation of the temperature and the frequency by the reduction of the polarization.60 There exist 4 types of polarization, namely, interfacial, electronic, ionic, and dipolar polarization, which have an apparent effect on the dielectric constant evolution but their contribution declines with frequency.61
On our measurement frequency range, we can only identify dipolar or interfacial polarization. These types of polarization are highly temperature-dependent.
Fig. 8 (inset) depicts the temperature dependence of the dielectric constant of our compound at selected frequencies. In the range [200–250 K], ε′ increases gradually with temperature but its variation is less marked and almost invariant with the increase in frequency. This result may be due to the orientation of polarization, which is related to the molecule's thermal motion.62 It is explained by the fact that the dipoles remain frozen and cannot orient themselves at low temperatures.63 In the temperature range (>250 K), the dipoles can rotate loosely and the molecular interaction energy effect becomes lower than the thermal energy. The bound load carriers gradually obtained thermal excitation energy. This in turn makes them able to reply to the change in the externally applied field more easily.62 Therefore, it enhances their contribution to the polarization, resulting in an increase in the dielectric constant with temperature.
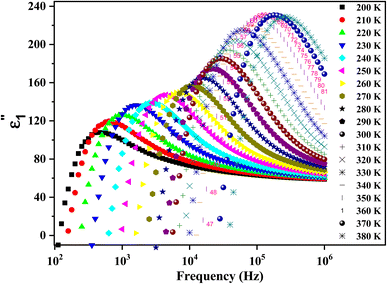
Fig. 9 shows the variation of ε′′ as a function of frequency in a temperature range of [200–380 K]. It is clear that ε′′ also decreases with the frequency until it becomes stable in the high-frequency range (above 104 Hz). This behavior can be explained by the migration of electrons between Fe2+ and Fe3+ and the ion polarization loss, which can be considered as the cause of the very high value of dielectric loss ε′′ at low frequency. Above 104 Hz, only the exchange ions can go along with the applied electric field frequency guide to the decrease in ε′′ across the studied temperature range.
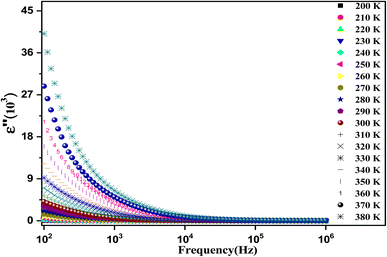 | ||
| Fig. 9 The recorded dielectric data of the imaginary permittivity (ε′′) at several temperatures [200–380 K] for the synthesized ferrite. | ||
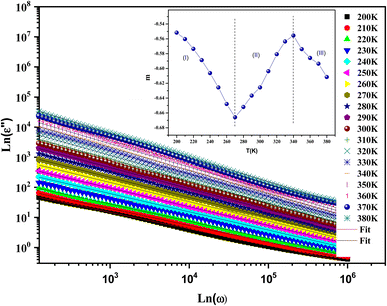
Fig. 10 shows the evolution of ε′′ as a function of frequency at serval temperatures on a logarithmic scale. ln![[thin space (1/6-em)]](https://www.rsc.org/images/entities/char_2009.gif) ε′′ can be analyzed according to Guitini's theory, as given by the following:64
ε′′ can be analyzed according to Guitini's theory, as given by the following:64
 | (9) |
This law can be simplified in another form:65
| ε′′ = C(T)ωm | (10) |
 | (11) |
In this expression, kB is the Boltzmann constant and Wm is the energy required for charge carriers to leap above the potential barrier. The obtained values of parameter m versus temperature are shown in the inset in Fig. 10. We observed that the variation of m was proportional to the temperature. The exponent m decreased with increasing temperature in the intervals [200–270 K] and [340–380 K], which matches well with the correlated barrier hopping (CBH) model. Nevertheless, m increases with temperature in the intermediary region, so the nonoverlapping small polaron tunneling (NSPT) mechanism is predominant. These results are well correlated with our previous electrical findings for this material.30
Studying the temperature effect on the evolution of the imaginary part of the dielectric permittivity can give us a clear insight into the dielectric relaxation number within a system. From Fig. 10, we observed the absence of the relaxation phenomenon in the frequency range, which was concealed by the DC-conductivity mechanism. It can be elicited using the following relation:66
 | (12) |
 is the contribution of DC-conductivity to the imaginary part of the dielectric permittivity, it can be calculated by the following equation:66
 | (13) |
3.8 Polarizability study
A new method was suggested by Scaife68 to investigate the dielectric response of the sample. It is based on the substitution of the complex permittivity by the polarizability according to the relation:69| α* = α′ − iα′′ | (14) |
 | (15) |
Complex polarizability usually refers to the tendency of the studied material to polarize and ease the analysis of the dielectric results of various samples. It unveils the new relaxations and clarifies the previous ones. The dependence temperature of α′′ is plotted in Fig. 12(a). It exhibits well-separated relaxation peaks that are centered at angular frequency ωα (where ωα = 2πfα) and move towards the high frequency with the increase in temperature.
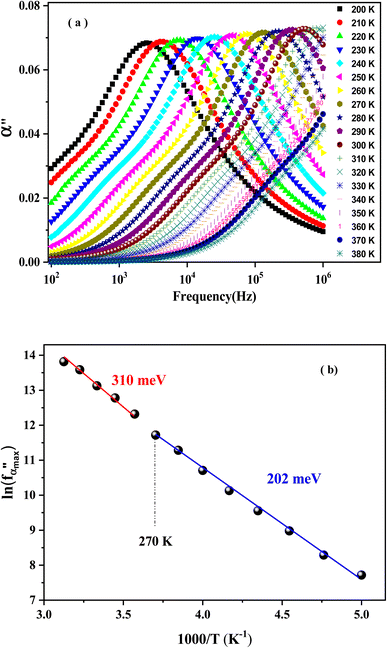 | ||
Fig. 12 The frequency dependence of polarizability at different temperatures (a). The variation of  vs. (1000/T) (b). vs. (1000/T) (b). | ||
The logarithmic variation of ωα versus the inverse of the temperature is illustrated in Fig. 12(b). This curve can be described according to the Arrhenius relation:61
 | (16) |
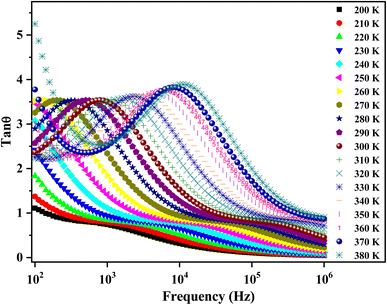
The quantitative loss of energy (the dielectric loss tangent) in an assorted dielectric material is generally caused by different physical processes, for example, electrical conduction, or dielectric relaxation.69 Fig. 13 exhibits the temperature-dependent loss tangent (tan![[thin space (1/6-em)]](https://www.rsc.org/images/entities/char_2009.gif) θ). tan
θ). tan![[thin space (1/6-em)]](https://www.rsc.org/images/entities/char_2009.gif) θ increases with the increase in temperature. The peaking behavior may be related to the arising relaxation effect.70 The applied electric field period fits well with those of the relaxation process. The peaks move towards the higher frequency side (>104 Hz) with increasing temperatures, showing a pronounced thermally activated relaxation phenomenon. The latter is associated with the curtailment of resistance with the increasing frequencies.61
θ increases with the increase in temperature. The peaking behavior may be related to the arising relaxation effect.70 The applied electric field period fits well with those of the relaxation process. The peaks move towards the higher frequency side (>104 Hz) with increasing temperatures, showing a pronounced thermally activated relaxation phenomenon. The latter is associated with the curtailment of resistance with the increasing frequencies.61
3.9 Modulus study
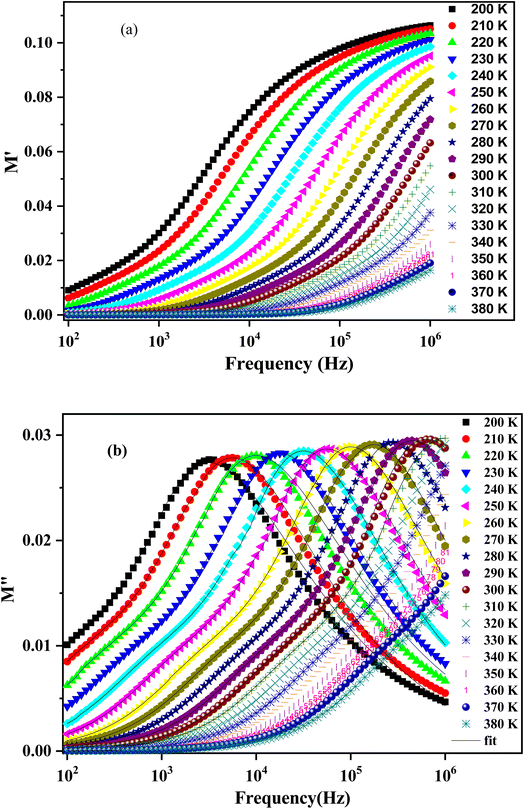
In this section, we pay attention to the utility of modulus formalism. Its main role is to supply us with an idea about the electrical process implicated in our investigated material and to study the same as the function of temperature over a broad range of frequencies.The total complex electric modulus follows the equation71
| M* = M′ + M′′ = iωC0Z* | (17) |
Fig. 14 depicts the frequency dependence of the imaginary part of the modulus at different temperatures. The curves of M′ illustrate a broad peak that represents the assembly of the two peaks at temperatures below 310 K. For the rest, we assume the presence of a broad peak in the high frequencies exceeding the scale of our available impedance analyzer. The peak in the lower frequency range is related to the grain boundaries effect.73 The pronounced peaks in the higher frequency range are associated with the bulk effect (the grain's effect).67 The more the temperatures increase, the peaks shift towards the higher region of frequencies, indicating the existence of a thermally activated relaxation process. Thus, we can differentiate two frequency regions according to the frequency corresponding to the modulus peak maxima positions. At the frequency region below the peak, there is the pure conduction process,74 where the load carrier drifts loosely across long distances. However, in the second region above the peak, the load carriers are spatially restricted and can move only over short distances.75
The experimental data of the imaginary part of the modulus plot can be interpreted by the modified function Kohlraush–Williams–Watts (KWW). This fitting approach (KWW) is proposed by Bergman according to the following formula:76
 | (18) |
 and
and  are the maximum peaks value of the imaginary part of modulus match to grain and grain boundary, respectively. βg and βgb designate the deviation of the line from the linear exponential, known as the stretching factor corresponding to the grain and grain boundary, respectively. It is broadly placed in the range 0 <β < 1.
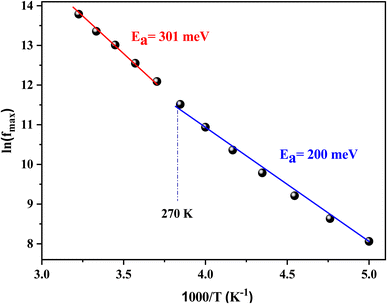
The theoretical parameters deduced from the fitting of modulus data are summarized in Table 3. The value of the stretching factor does not exceed unity, and this kind of information bears out the non-Debye behavior of the examined compound. Fig. 15 illustrates the variation of ln(fmax) versus the temperature, which obeys the Arrhenius relation. The values of activation energy estimated from the slopes of lines in the plot are 288 meV and 192 meV for [200–270 K] and [280–310 K], respectively. These values are almost the same as those obtained from the imaginary part of the polarizability. This suggests that transport in the studied sample is decided by the electron-hopping mechanism.42
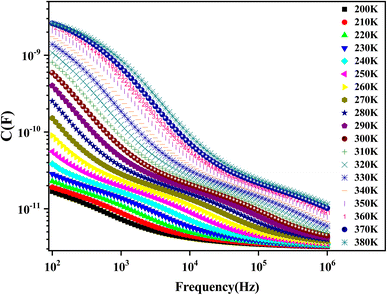
The variation of capacitance versus frequency at various temperatures is shown in Fig. 16. The high value of capacitance can be obtained in the region of lower frequencies that can be related to the existence of interface states that can follow the alternating current (AC) signal.77 The capacitance decreases with frequency. This behavior is typically similar to that of a material with traps. This can be explained by the interface states' inability to follow the applied electric field.67
Finally, these results prove that the investigated sample could be suitable for many technological applications (Li-ion batteries, electronic devices, microwaves, fuel cells, and low-temperature cofired ceramics applications).42
4 Conclusion
This study has examined the optical, magnetic, and dielectric properties of LiMn0.5Fe2O4 prepared by the solid-state reaction. Vibrational modes were further analyzed by Raman spectra confirming the bonding of oxygen with cations in the octahedral and tetrahedral sites. The optical band gap value shows semiconductor behavior that was estimated at 3.51 eV, which was deduced from the absorption spectrum. Hence, the sample can be considered good candidates for various applications such as optoelectronics, photodetectors, photovoltaics, and gas sensors. The magnetic hysteresis loops were well investigated by the ferromagnetic (FM) and antiferromagnetic (AFM) contributions to understanding the origin of our studied sample. It was found that the ferromagnetic contribution is the most dominant. It depicts the presence of superparamagnetic behavior and a high value of microwave frequency. Therefore, the LiMn0.5Fe2O4 ferrite material is a promising compound for the domain of microwave frequency bands and biomedical applications. The dielectric results represent a colossal value of dielectric permittivity, which proves the importance of ferrites as promising materials for electronic devices. The dielectric relaxations are hidden by the direct current conductivity (σdc) process and can be extracted from dielectric measurements.This study is just a step that can be taken further. It gives interesting perspectives and makes way for new horizons to be explored, exploited, and for practical applications of this family of ferrites compounds in multiple technological fields.
Conflicts of interest
The authors declare that there are no competing interests regarding the publication of this paper.References
- M. D. Hossain, A. T. M. K. Jamil, M. S. Hossain, S. J. Ahmed, H. N. Das, R. Rashid and M. N. I. Khan, RSC Adv., 2022, 12, 4656 RSC.
- J. M. Gonçalves, M. N. Silva, K. K. Naik, P. R. Martins, D. P. Rocha, E. Nossol and C. S. Rout, J. Mater. Chem., 2021, 9, 3095 RSC.
- C. Yao, M. Ismail, A. Hao, S. K. Thatikonda, W. Huang, N. Qin and D. Bao, RSC Adv., 2019, 9, 12615 RSC.
- M. Chandel, D. Moitra, P. Makkar, H. Sinha, H. S. Hora and N. N. Ghosh, RSC Adv., 2018, 8, 27725 RSC.
- Z. Li, Z. L. Wang and Z. Wang, RSC Adv., 2018, 8, 23522 RSC.
- N. M. Malima, M. D. Khan, J. Choi, R. K. Gupta, P. Mashazi, T. Nyokong and N. Revaprasadu, RSC Adv., 2021, 11, 31002 RSC.
- K. Jangam, K. Patil, S. Balgude, S. Patange and P. More, RSC Adv., 2020, 10, 42766 RSC.
- M. Bastianello, S. Gross and M. T Elm, RSC Adv., 2019, 9, 33282 RSC.
- N. Kobylinska, D. Klymchuk, A. Shakhovsky, O. Khainakova, Y. Ratushnyak, V. Duplij and N. Matvieieva, RSC Adv., 2021, 11, 26974 RSC.
- T. N. Pham, T. Q. Huy and A. T. Le, RSC Adv., 2020, 10, 31622 RSC.
- A. Manohar, K. Chintagumpala and K. H. Kim, Ceram. Int., 2021, 47, 7052 CrossRef CAS.
- K. K. Kefeni, T. A. M. Msagati, T. T. I. Nkambule and B. B. Mamba, Mater. Sci. Eng., 2020, 107, 110314 CrossRef CAS PubMed.
- P. B. Kharat, M. V. Shisode, S. D. Birajdar, D. N. Bhoyar and K. M. Jadhav, AIP Conf. Proc., 2017, 1832, 050122 CrossRef.
- S. Taneja, P. Thakur, B. Ravelo and A. Thakur, Mater. Res. Bull., 2022, 154, 111937 CrossRef CAS.
- J. H. Kim, H. E. Kim, J. H. Kim and J. S. Lee, J. Mater. Chem. A, 2020, 8, 9447 RSC.
- S. B. Somvanshi, S. A. Jadhav, M. V. Khedkar, P. B. Kharat, S. D. More and K. M. Jadhav, Ceram. Int., 2020, 46, 13170 CrossRef CAS.
- M. Junaid, M. A. Khan, Z. M. Hashmi, G. Nasar, N. A. Kattan and A. Laref, J. Mol. Struct., 2020, 1221, 128859 CrossRef CAS.
- N. Singh, A. Agarwal and S. Sanghi, Curr. Appl. Phys., 2011, 11, 783 CrossRef.
- F. Gandomi, S. M. Peymani-Motlagh, M. Rostami, A. Sobhani-Nasab, M. Fasihi-Ramandi, M. Eghbali-Arani and M. R. Ganjali, J. Mater. Sci.: Mater. Electron., 2019, 30, 19691 CrossRef CAS.
- J. Jing, L. Liangchao and X. Feng, J. Rare Earths, 2007, 25, 79 CrossRef.
- M. M. Hessien, J. Magn. Magn. Mater., 2008, 320, 2800 CrossRef CAS.
- D. Ravinder and P. Vijaya Bhasker Reddy, Mater. Lett., 2003, 57, 4344 CrossRef CAS.
- A. M. Shaikh, S. C. Watawe, S. S. Bellad, S. A. Jadhav and B. K. Chougule, Mater. Chem. Phys., 2000, 65, 46 CrossRef CAS.
- T. Nakamura, M. Naoe and Y. Yamada, J. Magn. Magn. Mater., 2006, 305, 120 CrossRef CAS.
- P. Hernández-Gómez, J. M. Muñoz, M. A. Valente and M. P. F. Graça, Mater. Res. Bull., 2019, 112, 432 CrossRef.
- M. Anis-ur-Rehman, W. Mahmood, H. Ghazanfar, M. A. A. Khan and A. Haq, J. Supercond. Nov. Magn., 2019, 32, 2787 CrossRef CAS.
- E. K. Al-Shakarchi, S. H. Lafta, A. M. Musa, M. Farle and R. Salikov, J. Supercond. Nov. Magn., 2016, 29, 923 CrossRef CAS.
- M. K. Abbas, M. A. Khan, F. Mushtaq, M. F. Warsi, M. Sher, I. Shakir and M. F. A. Aboud, Ceram. Int., 2017, 43, 5524 CrossRef CAS.
- I. H. Gul and E. Pervaiz, Mater. Res. Bull., 2012, 47, 1353 CrossRef CAS.
- I. Soudani, K. B. Brahim, A. Oueslati, H. Slimi, A. Aydi and K. Khirouni, RSC Adv., 2022, 12, 18697 RSC.
- M. A. Maksoud, A. El-Ghandour, A. H. Ashour, M. M. Atta, S. Abdelhaleem, A. H. El-Hanbaly and A. S. Awed, J. Rare Earths, 2021, 39, 75 CrossRef.
- A. Kumar, S. K. Sharma, V. Grover, Y. Singh, V. Kumar, V. K. Shukla and P. K. Kulriya, J. Nucl. Mater., 2022, 564, 153682 CrossRef CAS.
- V. D'Ippolito, G. B. Andreozzi, D. Bersani and P. P. Lottici, J. Raman Spectrosc., 2015, 46, 1255 CrossRef.
- G. Datt, M. S. Bishwas, M. M. Raja and A. C. Abhyankar, Nanoscale, 2016, 8, 5200 RSC.
- D. K. Pradhan, S. Kumari, V. S. Puli, P. T. Das, D. K. Pradhan, A. Kumar and R. S. Katiyar, Phys. Chem. Chem. Phys., 2017, 19, 210 RSC.
- B. K. Chatterjee, K. Bhattacharjee, A. Dey, C. K. Ghosh and K. K. Chattopadhyay, Dalton Trans., 2014, 43, 7930 RSC.
- M. Virumbrales-del Olmo, A. Delgado-Cabello, A. Andrada-Chacón, J. Sánchez-Benítez, E. Urones-Garrote, V. Blanco-Gutiérrez and R. Sáez-Puche, Phys. Chem. Chem. Phys., 2017, 19, 8363 RSC.
- D. Bouokkeze, J. Massoudi, W. Hzez, M. Smari, A. Bougoffa, K. Khirouni, E. Dhahri and L. Bessais, RSC Adv., 2019, 9, 40940 RSC.
- R. D. Waldron, Phys. Rev., 1955, 99, 1727 CrossRef CAS.
- I. El Heda, J. Massoudi, R. Dhahri, E. Dhahri, F. Bahri and B. F. O. Costa, J. Alloys Compd., 2023, 931, 167479 CrossRef CAS.
- J. Massoudi, D. Bouekkeze, A. Bougoffa, K. Khirouni, E. Dhahri and L. Bessais, Adv. Powder Technol., 2020, 31, 4714 CrossRef CAS.
- P. Kubelka and F. Munk, Z. Phys. D, 1931, 12, 259 Search PubMed.
- A. Ghoudi, K. B. Brahim, A. Oueslati, K. Khirouni and A. Aydi, J. Mater. Sci.: Mater. Electron., 2022, 33, 1 CrossRef.
- A. Hadded, J. Massoudi, E. Dhahri, K. Khirouni and B. F. O. Costa, RSC Adv., 2020, 10, 42542 RSC.
- R. Mguedla, A. B. J. Kharrat, O. Taktak, H. Souissi, S. Kammoun, K. Khirouni and W. Boujelben, Opt. Mater., 2020, 101, 109742 CrossRef CAS.
- P. Chand, S. Vaish and P. Kumar, Phys. B, 2017, 524, 53 CrossRef CAS.
- N. Amri, J. Massoudi, K. Nouri, M. Triki, E. Dhahri and L. Bessais, RSC Adv., 2021, 11, 13256 RSC.
- Q. Chen and Z. J. Zhang, Appl. Phys. Lett., 1998, 73, 3156 CrossRef CAS.
- L. R. Shah, H. Zhu, W. G. Wang, B. Ali, T. Zhu, X. Fan and J. Q. Xiao, J. Phys. D, 2010, 43, 035002 CrossRef.
- S. E. Shirsath, S. S. Jadhav, B. G. Toksha, S. M. Patange and K. M. Jadhav, J. Appl. Phys., 2011, 110, 013914 CrossRef.
- M. N. Akhtar, M. Saleem and M. A. Khan, J. Phys. Chem. Solids, 2018, 123, 260 CrossRef CAS.
- M. Akhtar, M. Babar, S. Qamar, Z. Rehman and M. A. Khan, Ceram. Int., 2019, 45, 10187 CrossRef CAS.
- G. Sahu, M. Das, M. Yadav, B. P. Sahoo and J. Tripathy, Polymers, 2020, 12, 374 CrossRef CAS PubMed.
- M. M. L. Sonia, S. Anand, V. M. Vinosel, M. A. Janifer, S. Pauline and A. Manikandan, J. Magn. Magn. Mater., 2018, 466, 238 CrossRef CAS.
- M. H. Dhaou, S. Hcini, A. Mallah, M. L. Bouazizi and A. Jemni, Appl. Phys. A, 2016, 123, 1 Search PubMed.
- M. Saha, S. Mukherjee, P. Bera, M. M. Seikh and A. Gayen, Ceram. Int., 2022, 48, 35719 CrossRef CAS.
- A. Thakur, P. Mathur and M. Singh, J. Phys. Chem. Solids, 2007, 68, 378 CrossRef CAS.
- K. Pubby, K. Vijay Babu and S. Bindra Narang, Mater. Sci. Eng. B, 2020, 255, 114513 CrossRef CAS.
- A. M. Shaikh, S. S. Bellad and B. K. Chougule, J. Magn. Magn. Mater., 1999, 195, 384 CrossRef CAS.
- M. C. Dimri, A. Verma, S. C. Kashyap, D. C. Dube, O. P. Thakur and C. Prakash, Mater. Sci. Eng. B, 2006, 133, 42 CrossRef CAS.
- Y. B. Taher, A. Oueslati, K. Khirouni and M. Gargouri, J. Clust. Sci., 2015, 5, 1655 CrossRef.
- I. S. Yahia, N. A. Hegab, A. M. Shakra and A. M. AL-Ribaty, Phys. B, 2012, 13, 2476 CrossRef.
- N. J. Tharayil, S. Sagar, R. Raveendran and A. V. Vaidyan, Phys. B, 2007, 399, 1 CrossRef CAS.
- J. C. Giuntini, J. V. Zanchetta, D. Jullien, R. Eholie and P. Houenou, J. Non-Cryst. Solids, 1981, 45, 57 CrossRef CAS.
- K. M. Batoo, S. Kumar, C. G. Lee and A. Alimuddin, Curr. Appl. Phys., 2009, 9, 1397 CrossRef.
- A. Ben Jazia Kharrat, M. Bourouina, N. Moutia, K. Khirouni and W. Boujelben, J. Alloys Compd., 2018, 741, 723 CrossRef CAS.
- R. Mguedla, A. Ben Jazia Kharrat, N. Moutia, K. Khirouni, N. Chniba-Boudjada and W. Boujelben, J. Alloys Compd., 2020, 836, 155186 CrossRef CAS.
- B. K. P. Scaife, Proc. Phys. Soc., 1963, 81, 124 CrossRef CAS.
- M. Amghar, A. Bougoffa, A. Trabelsi, A. Oueslati and E. Dhahri, RSC Adv., 2022, 12, 20348 RSC.
- S. Saha and T. P. Sinha, Phys. Rev., 2002, 65, 134103 Search PubMed.
- P. Norouzzadeh, K. Mabhouti, M. M. Golzan and R. Naderali, J. Mater. Sci., 2020, 31, 7335 CAS.
- N. K. Mohanty, S. K. Satpathy, B. Behera, P. Nayak and R. N. P. Choudhary, J. Adv. Ceram., 2012, 1, 221 CrossRef CAS.
- P. Oruc, P. Turan, Y. Demirolmez, A. Seckin, S. Cavdar, H. Koralav and N. Tugluoglu, J. Mater. Sci., 2021, 32, 15837 CAS.
- C. Bharti and T. P. Sinha, Solid State Sci., 2010, 4, 498 CrossRef.
- K. Holderna-Natkaniec, M. Ouled Mohamed Sghaier, P. Ławniczak, M. Zdanowska-Frączek, A. Wozniak-Braszak and S. Chaabouni, Polyhedron, 2015, 85, 131 CrossRef CAS.
- R. Bergman, J. Appl. Phys., 2000, 88, 1356 CrossRef CAS.
- D. M. Taylor and H. L. Gomes, J. Phys. D: Appl. Phys., 1995, 28, 2554 CrossRef CAS.
| This journal is © The Royal Society of Chemistry 2023 |

