 Open Access Article
Formation of a PVP-protected C/UO2/Pt catalyst in a direct ethanol fuel cell
Zhanjun Zhang a,
Qipeng Liua,
Dashu Pan
 b,
Yubing Xue
 b,
Xiaojuan Liub,
Jing Zhaob,
Yinggen Ouyang
 b,
Xiaofan Dinga,
Songtao Xiao*b and
Qingyuan Yang
 *a
*a
aCollege of Chemical Engineering, Beijing University of Chemical Technology, Beijing 100029, China
bDepartment of Radiochemistry, China Institute of Atomic Energy, Beijing 102413, China
First published on 26th May 2023
Abstract
In order to solve the problem that UO2 in direct ethanol fuel cell anode catalysts is easily lost in acidic solution, resulting in the degradation of catalytic performance, this paper prepared a C/UO2/PVP/Pt catalyst in three steps by adding polyvinylpyrrolidone (PVP). The test results by XRD, XPS, TEM and ICP-MS showed that PVP had a good encapsulation effect on UO2, and the actual loading rates of Pt and UO2 were similar to the theoretical values. When 10% PVP was added, the dispersion of Pt nanoparticles was significantly improved, which reduced the particle size of Pt nanoparticles and provided more ethanol electrocatalytic oxidation reaction sites. The test results by electrochemical workstation showed that the catalytic activity as well as the stability of the catalysts were optimized due to the addition of 10% PVP.
1. Introduction
With the increase of environmental problems and energy problems in recent years, people have an urgent need for new technologies that do not rely on fossil fuels. Fuel cell technology involves the direct conversion of chemical energy into electrical energy, exhibiting higher thermodynamic efficiency and lower greenhouse gas emissions than conventional combustion.1–3In this context, polymer electrolyte membrane fuel cells (PEMFCs) have been regarded as a kind of device that provides clean and sustainable power by directly converting chemical energy stored in fuel molecules into electrical energy.4–6 Among them, the direct ethanol fuel cell (DEFC), a proton exchange membrane fuel cell using ethanol as fuel, has attracted wide attention because of its high sustainability and low emission.7
However, the research and development of DEFCs is still in its infancy, and the development of commercialization is still facing huge problems.8 At present, Pt based catalysts is the most widely used DEFC anode catalysts, but its catalytic activity and stability are relatively poor, and the precious metal Pt is easy to be poisoned. Carbon monoxide, an intermediate product of partial oxidation of ethanol, is easy to be strongly adsorbed on the surface of Pt, forming stable Pt-COads compounds, resulting in Pt surface poisoning and seriously reducing the electrochemical performance of the catalyst. Therefore, it is very important for Pt to improve the electrochemical activity and the ability to resist CO poisoning of DEFC catalysts.
Uranium is a natural radioactive element and consists of several natural isotopes (238U, 235U and 234U, with natural abundances of 99.275%, 0.720% and 0.005%, respectively). Among them, 238U has a very long half-life of approximately 4.5 billion years, and thus it has higher safety when it is used in a small amount of catalyst. Uranium has a variety of oxidation valence states, such as +2, +3, +4, +5 and +6. Uranium oxides can be used as candidate materials for fuel cell catalysts.9–11
Yubing Xue et al.12 introduced radioactive ThO2 catalyst additive by hydrothermal method into platinum–carbon catalyst for the first time. The results showed that the best catalytic activity and resistance to CO poisoning were obtained when the mass fraction of Pt was 20% and the mass fraction of ThO2 was 6.67%. Dongliang Gao et al.13 prepared graphene oxide (GO) by Hunners method. Using uranyl nitrate as precursor, graphene oxide supported on uranium trioxide (U3O8/rGO) was prepared by hydrothermal method, which was used to catalyze cathodic redox reaction (ORR) of direct methanol fuel cell (DMFC). Compared with Pt/C, graphene oxide showed higher catalytic activity and stability. Radioactive uranium dioxide powder was prepared by Dashu Pan et al.14 through hydrothermal method, and a series of Pt-xUO2/C catalysts were synthesized by impregnation method, which were used to solve the problem of low activity and easily poisoning of anodic Pt/C catalyst for direct ethanol fuel cell. Through a series of characterization, it is proved that Pt-10% UO2/C has high catalytic activity, and it is proposed that the improvement of catalytic performance is due to the fact that UO2 improves the resistance to CO poisoning by releasing O2 stored in the lattice space, while the α-particles released by 235U can also generate ˙OH and promote the oxidative desorption of CO from the Pt surface.
However, we found that the supported UO2 is easy to soluble in acid solution, which greatly reduces the electrochemical performance of the catalyst. Therefore, in this experiment, polyvinylpyrrolidone (PVP) was introduced as a coating agent to reduce the loss of UO2 and improve the electrochemical performance of the catalyst.
The monomer of PVP is N-vinylpyrrolidone, which can exist stably at room temperature.15,16 At present, there are many examples of applying PVP to catalysts.17–19 Zehui Yang et al.20–22 reduced the loss of Pt particles by introducing polyvinylphosphoric acid (PVPA) and polyvinylpyrrolidone to coat Pt particles. And they found that the Pt-OHads formed rapidly on the surface of the catalyst could remove the COads adsorbed by Pt and improve the resistance of platinum to CO poisoning. Tsunoyama et al.23 synthesized gold nanoparticles with high catalytic activity by adding polyvinylpyrrolidone, and the metal particles were small, which effectively enhanced their catalytic activity.
In this paper, PVP is introduced into the catalyst to reduce the loss of UO2 and improve the electrochemical performance of the catalyst. As shown in Fig. 1, Our design ideas of synthetic samples is to first adsorb UO2 particles on the surface of carbon black, then coat a layer of PVP on the surface of carbon black, and finally adsorb Pt particles. PVP membrane can effectively protect UO2, reduce the loss, and make UO2 continue to play a role. At the same time, PVP can effectively change the hydrophilicity of the catalyst,24 and more water molecules would accelerate the hydrolysis of platinum to produce a large amount of Pt-OHads. Then, through the oxidation reaction (Pt-COads + OHα → Pt + CO2 + H+ + e−), quickly remove the CO adsorbed by Pt, release the active sites of Pt, and improve the electrochemical performance of the catalyst.25,26 The important role played by the other components of the catalyst is further explained here for better understanding. Among them, Pt as the main catalyst plays a major role in the oxidation of ethanol,27 UO2 is a co-catalyst, and the catalytic activity of the catalyst is enhanced by the synergistic effect of Pt and UO2, while the addition of UO2 improves the resistance of Pt to CO poisoning.14 Carbon black has a large specific surface area, good electrical conductivity and good chemical stability. The addition of carbon black can improve the dispersibility of Pt nanoparticles and play the role of a carrier.28 According to the action mechanism of PVP, we synthesized C/UO2/PVP/Pt catalysts with different PVP contents, characterized the structure and tested the electrochemical performance of the catalysts, and compared them with C/UO2/Pt and Pt/C catalysts. Besides, we further improved the action mechanism of UO2 in fuel cells and effectively realized the “self-reactivation” of the catalysts.
2. Experimental
2.1. Materials
Hexachloroplatinic acid (H2PtCl6·6H2O), ethanol (CH3CH2OH) were purchased from Shanghai Aladdin Biochemical Technology Co. Ltd. Uranium nitrate (UO2(NO3)2·6H2O) was purchased from China institute of atomic energy. 5 wt% Nafion solution was purchased from Du Pont. Vulcan XC-72 carbon was purchased from Cabot. Isopropyl Alcohol (IPA) was purchased from Shanghai McLean Biochemical Technology Co. Ltd. Ethylene glycol ((CH2OH)2) was purchased from Macklin reagent. Hydrazine hydrate (N2H4·H2O), sodium hydroxide (NaOH), sulfuric acid (H2SO4) was purchased from Sinopharm Chemical Reagent Co. Ltd.All reagents were used in this work without further treatment.
2.2. Preparation of working electrode
Glassy carbon (GC) rod (Φ = 3 mm) served as the working electrode substrate. Prior to use, the electrode was polished successively by using alumina powder of sizes 0.3 and 0.05 μm, and cleaned ultrasonically. For the electrode preparation, 10 mg catalyst was dispersed in mixed solution (3.6 mL, 100 μL Nafion solution and 1.3 mL IPA) to obtain the catalyst ink. The 5 μL of the ink was spread on the surface of the glassy carbon electrode and then the electrode was dried at room temperature to eliminate the solven.All electrochemical experiments were carried out at room temperature and under ambient pressure. All solutions were purged with a stream of pure N2 gas (99.99%) for 30 min prior to experiments.
2.3. Synthesis of UO2 particle
In our study, the uranium dioxide was prepared by hydrothermal method. Weigh 5 g of UO2(NO3)2·6H2O and dissolve it into 25 mL of ultrapure water, add 3 mL of N2H4·H2O into 25 mL of ultrapure water, pour the two sets of solutions into 100 mL of PTFE liner in turn, stir well and then put the liner into the reaction kettle and heat in the oven at 200 °C for 48 h. After the reaction kettle is cooled down, wash it 3 times with ultrapure water, dry it at 60 °C and then obtain UO2 blue-black powder after grinding.142.4. Synthesis of C/UO2/Pt and C/PVP/Pt catalysts
139 mg of carbon black was ultrasonically dispersed in 70 mL of ethylene glycol. Then weighed 22 mg of UO2 (or PVP) and dispersed it in 5 mL ultrapure water, poured the two sets of solutions into a 250 mL of flask which contained the required amount of H2PtCl6 solution. After stirring well, the flask was placed in an oil bath at 140 °C and stirred continuously under nitrogen atmosphere for 2 h. After the reaction was completed, the resulting solution was washed by centrifugation, dried at 60 °C for 12 h, and ground to obtain C/UO2/Pt and C/PVP/Pt catalyst powders.2.5. Synthesis of C/UO2/PVP/Pt catalyst
Disperse 119 mg of carbon black and 22 mg of UO2 in 70 mL of ethylene glycol and 5 mL of deionized water respectively, sonicate for 20 min, stir for 30 min, add the UO2 suspension slowly to the carbon black suspension, stir well, add 22 mg of PVP powder slowly, sonicate and stir for 2 h, wash the solution obtained after the adsorption by centrifugation, dry at 60 °C for 12 h, and C/UO2/PVP powder was obtained after grinding. The C/UO2/PVP powder was placed in a flask dissolved with 70 mL ethylene glycol, stirred well, and then 3.5 mL of 11.68 mg mL−1 chloroplatinic acid solution was slowly added, stirred for 30 min. Placed the flask in an oil bath at 140 °C and stirred continuously under nitrogen atmosphere for 2 h. After the reaction was completed, the resulting solution was washed by centrifugation, dried at 60 °C for 12 h, and ground to obtain C/UO2/PVP/Pt catalyst powder.In this study, the loadings of Pt in the catalysts were all 20% and the loadings of UO2 were 10%. The actual loadings of PVP were not tested by a thermogravimetric analyzer due to the presence of the radioactive element U. Therefore, the PVP loadings in the experiments of this work are only the relative contents.
2.6. Physical characterizations
The X-ray diffraction (XRD) patterns was performed on a Brüker D8 Advance diffractometer at 40 kV and 40 mA for Cu Kα radiation (λ = 1.5406 Å) and a test angle of 10–90°. Transmission electron microscopy (TEM) measurements were performed on JEM-F200. The samples were prepared by placing a drop of the catalyst powder dispersion in deionized water on a Cu grid, followed by drying under ambient conditions. X-ray photoelectron spectroscopy (XPS) was used to characterize the composition and structure of the material surface. The instrument used for this experiment was VG Multilab 2000. The excitation light source was Al K line, and the photon energy was 1486.7 eV. The actual metal loadings on the working electrode for all the catalysts were determined by inductively coupled plasma-mass spectrometry (ICP-MS, Agilent 7850). The precious metals in the catalyst were completely dissolved with freshly prepared aqua regia and diluted with 2% nitric acid. In this way, the nominal concentration of each precious metal in the test solution was kept in the range of 1–10 ng mL−1, which would ensure accurate determination of each of the precious metals in the solution.3. Results and discussion
3.1. Physical characterization results
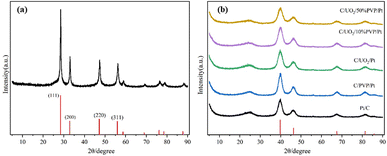
Fig. 2(a) shows the XRD patterns of the prepared UO2 by hydrothermal method with the peak positions and relative intensities of the diffraction peaks corresponding to the UO2 standard PDF card 75-0420. Fig. 2(b) shows the XRD patterns of the prepared Pt/C, C/PVP/Pt, C/UO2/Pt and C/UO2/PVP/Pt catalysts with different PVP loadings, from which we can observe four distinct diffraction peaks located at 39.7°, 46.3°, 67.4° and 81.3° attributed to the Pt face-centered cubic structure (fcc) of the (111), (200), (220), and (311) crystal planes, proving the successful loading of Pt.29 As is indicated in the figure, the diffraction peaks of the U-element are not obvious, which may be due to the Pt particles covered by Pt ions after their reduction. The stronger XRD diffraction peak of Pt makes the characteristic peak of U masked, the closer diffraction peaks of element U and element Pt may jointly contribute to the formation of the 46.3° diffraction peak, which is strongly supported by the larger diffraction peak half-width of the peak located at 46.3° when loaded with UO2 compared to the Pt/C catalyst.In order to examine the surface composition of the synthesized catalysts, XPS tests were performed. Fig. 3(a) shows the XPS patterns of the prepared Pt/C, C/UO2/Pt, and C/UO2/PVP/Pt catalysts, showing distinct C 1s, O 1s, Pt 4f, and U 4f diffraction peaks. The Pt 4f patterns of the synthesized catalysts are shown in Fig. 3(b) where Pt 4f shows two distinct diffraction peaks belonging to Pt 4f7/2 and Pt 4f5/2, respectively,30–32 where the two orbital peaks of Pt/C catalyst have binding energies of 71.08 eV (Pt 4f7/2) and 74.48 eV (Pt 4f5/2), respectively, but after the introduction of UO2 particles, the Pt 4f diffraction peaks of the prepared C/UO2/Pt catalysts underwent a significant backward shift, which reached 71.78 eV (Pt 4f7/2) and 74.90 eV (Pt 4f5/2), respectively, indicating that there was an obvious interaction between the metal Pt and the metal oxide UO2 particles, and this mutual synergy was associated with the enhancement of the electrochemical activity of the catalysts closely related. And after the introduction of PVP, the binding energies of the two orbital peaks of the C/UO2/PVP/Pt catalyst were 71.68 eV (Pt 4f7/2) and 74.80 eV (Pt 4f5/2), respectively, which were less shifted compared to the position of the Pt 4f diffraction peak of the C/UO2/Pt catalyst, which we believe is mainly because the PVP film formed on the surface of UO2 by PVP weakened the interaction between Pt and UO2 before, but the Pt 4f diffraction peak is still significantly shifted back compared to the Pt/C catalyst, which will have a positive effect on the improvement of the electrochemical activity of the catalyst. Fig. 3(c) shows the diffraction peaks of U for catalyst-loaded UO2, and the two orbital peaks represent U 4f7/2 and U 4f5/2, respectively.33 Compared with the diffraction peaks of U for C/UO2/Pt catalyst, the diffraction peaks of U for C/UO2/PVP/Pt catalyst are relatively weak in intensity, which is related to the coating of PVP film, which indirectly proves the good coating effect of PVP, and this suggests that this will effectively reduce the loss of UO2 in solution.
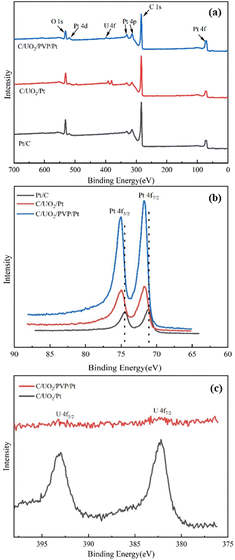 | ||
| Fig. 3 (a) XPS spectra of Pt/C, C/UO2/Pt and C/UO2/PVP/Pt catalysts; (b) Pt 4f XPS spectra of Pt/C, C/UO2/Pt and C/UO2/PVP/Pt; (c) U 4f XPS spectra of C/UO2/PVP/Pt and C/UO2/Pt. | ||
The morphology and dispersion of Pt particles loaded on the four prepared catalysts Pt/C, C/UO2/Pt, C/UO2/10% PVP/Pt and C/UO2/40% PVP/Pt were tested by TEM, as shown in Fig. 4, and 5 presents the particle size of Pt particles for different catalysts. The Pt particles are dispersed uniformly on the carbon black carrier, but the Pt/C catalyst shown in Fig. 4(a) still has an aggregation of Pt particles. As shown in Fig. 4(b), the particle size of Pt particles, after the introduction of UO2 particles, increased to 3.95 nm compared to the Pt particle size of 3.75 nm in Pt/C Fig. 5(a), while the particle size of Pt in the C/UO2/PVP/Pt catalyst shown in Fig. 4(c) decreased to only 3.6 nm after the introduction of 10% PVP. This is because PVP has good dispersion which makes the dispersion of Pt particles more uniform. When 40% PVP was introduced, the particle size of Pt in the C/UO2/PVP/Pt catalyst shown in Fig. 4(d) increased significantly, which was due to the fact that some Pt particles entered the PVP film when excess PVP was stored, which reduced the dispersion effect and finally led to the increase of Pt particles. Besides, it can also be found that the dispersion uniformity of Pt particles differed, which would lead to significant differences in the electrochemical activity of the catalysts.
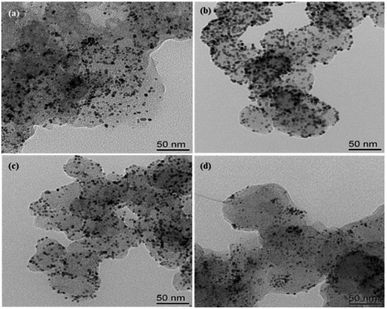 | ||
| Fig. 4 TEM micro graphs of the synthesized catalysts (a) Pt/C; (b) C/UO2/Pt; (c) C/UO2/10% PVP/Pt; (d) C/UO2/40% PVP/Pt. | ||
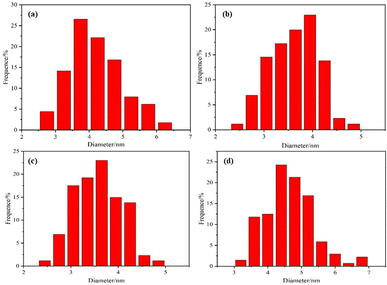 | ||
| Fig. 5 Pt particle size distribution images of the synthesized (a) Pt/C; (b) C/UO2/Pt; (c) C/UO2/10% PVP/Pt; (d) C/UO2/40% PVP/Pt. | ||
The catalyst was disintegrated with aqua regia, dissolved Pt and UO2, and the content of Pt and U elements in the solution was tested using an inductively coupled plasma mass spectrometer (ICP-MS), and the actual loading percentages of Pt and UO2 in the catalyst were measured as shown in Table 1 The actual loadings of Pt and UO2 on carbon black were relatively close to the theoretical values. And as the PVP loading gradually increases, the amount of Pt loaded on the catalyst decreases, which is mainly due to the poor adsorption ability of PVP on Pt. Therefore, the reduction of platinum adsorption will seriously affect the catalytic activity of the catalyst when excessive PVP is loaded.
| Catalysts | Pt | UO2 |
|---|---|---|
| C/10% UO2/50% PVP/20% Pt | 16.20% | 9.10% |
| C/10% UO2/40% PVP/20% Pt | 17.31% | 9.32% |
| C/10% UO2/30% PVP/20% Pt | 17.95% | 9.71% |
| C/10% UO2/20% PVP/20% Pt | 18.23% | 9.83% |
| C/10% UO2/10% PVP/20% Pt | 18.45% | 9.42% |
| C/10% UO2/5% PVP/20% Pt | 17.91% | 9.55% |
| C/10% UO2/20% Pt | 18.05% | 9.23% |
| C/10% PVP/20% Pt | 18.78% | 0 |
| 20% Pt/C | 18.01% | 0 |
3.2. Catalytic performance for ethanol oxidation reaction (EOR)
Electrochemical active area (ECSA) is an important parameter to characterize the strength of electrochemical activity of catalysts. In the experiment, we tested the ECSA of the catalyst in 0.5 mol L−1 H2SO4 solution. The test results are shown in Fig. 6. The hydrogen desorption peaks in the −0.2–0.1 V voltage band of the catalyst samples with Pt/C, C/PVP/Pt, Pt/UO2/C and different PVP loadings of C/UO2/PVP/Pt in Fig. 6 are integrated and converted into ECSA, and the results are shown in Table 2. The ECSA of the catalyst 20% Pt/C is 39.43 m2 g−1 compared to 43.90 m2 g−1 for C/10% UO2/20% Pt, which indicates that the introduction of UO2 facilitates the enhancement of electrochemical active area relating to the interaction between Pt and U. After the introduction of PVP, the ECSA of C/10% UO2/10% PVP/20% Pt reached 71.62 m2 g−1, which indicates that the introduction of PVP can effectively increase the electrochemically active area of the catalyst, and we speculate that this is because PVP, as a dispersant, makes the Pt particles smaller in size leading to the significant increase of ECSA, and the ECSA of the C/PVP/Pt catalyst was 49.95 m2 g−1 compared to 39.43 m2 g−1 for Pt/C. It can also be found that, the significant effect of PVP on the ECSA enhancement of the Pt/C catalyst. With the continuous addition of PVP, the ECSA gradually decreases. This suggests that, the presence of excess PVP makes the catalyst particles with core–shell structure larger in size, and also PVP covers a small amount of Pt particles, which makes the ECSA of the catalyst decrease significantly, and also the agglomeration of particles is an important factor for the decrease of ECSA.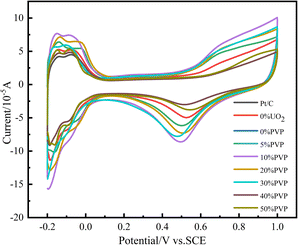 | ||
| Fig. 6 Cyclic voltammograms of catalyst systems in 0.5 mol L−1 H2SO4 solution at 25 °C at a scan rate of 50 mV s−1. | ||
| Catalysts | Hydrogen desorption region (10−6 V A) | ECSA (m2 g−1) |
|---|---|---|
| C/10% UO2/50% PVP/20% Pt | 9.22 | 43.90 |
| C/10% UO2/40% PVP/20% Pt | 9.41 | 44.81 |
| C/10% UO2/30% PVP/20% Pt | 10.72 | 51.05 |
| C/10% UO2/20% PVP/20% Pt | 14.81 | 70.52 |
| C/10% UO2/10% PVP/20% Pt | 15.04 | 71.62 |
| C/10% UO2/5% PVP/20% Pt | 13.14 | 62.57 |
| C/10% UO2/20% Pt | 9.22 | 43.90 |
| C/10% PVP/20% Pt | 10.49 | 49.95 |
| 20% Pt/C | 8.28 | 39.43 |
The catalytic activity and stability are important indicators to evaluate the performance of electrocatalysts. In our experiments, we obtained CV curves by testing in a nitrogen-saturated mixture of 0.5 mol L−1 H2SO4 and 0.5 mol L−1 CH3CH2OH. The ethanol oxidation peak current density of the 1st cycle voltammetric curve was used as an index to evaluate the catalytic activity, as shown in Fig. 7, and the ethanol oxidation peak current density of the new cycle CV curve after every 200 cycles of the CV curve was used as an index to evaluate the electrochemical stability. The data are compiled in Table 3. From the CV curve of the first cycle, it can be seen that the oxidation peak current density of catalyst C/10% UO2/20% Pt reached 6.4 mA cm−2 compared to 4.87 mA cm−2 for 20% Pt/C catalyst, which is a significant increase in catalytic activity, probably due to the interaction the interaction between U and Pt. After the introduction of PVP, the ethanol oxidation peak of catalyst C/10% UO2/10% PVP/20% Pt catalyst had the highest peak current density of 9.82 mA cm−2, compared with 6.4 mA cm−2 of C/10% UO2/20% Pt, and the catalytic activity this indicates that PVP has a greater influence on the catalytic activity of the catalyst, probably due to the interaction caused by the difference in particle size of the catalyst. The addition of the appropriate amount of PVP makes the catalyst more dispersed, with smaller particle size and more active sites of Pt, which results in a very high catalytic activity.
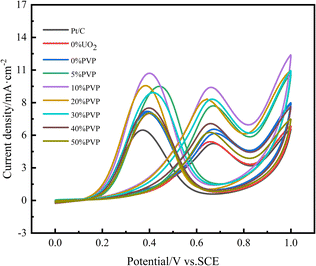 | ||
| Fig. 7 Cyclic voltammograms of ethanol oxidation on catalyst systems in a mixture of 0.5 mol L−1 H2SO4 + 0.5 mol L−1 C2H5OH solution at 25 °C at a scan rate of 50 mV s−1. | ||
| Catalysts | 1st current density/mA cm−2 | 201th current density/mA cm−2 | 401th current density/mA cm−2 | 601th current density/mA cm−2 | 801th current density/mA cm−2 | 1001th current density/mA cm−2 |
|---|---|---|---|---|---|---|
| C/10% UO2/50% PVP/20% Pt | 5.91 | 3.44 | 2.94 | 2.79 | 2.69 | 1.92 |
| (100%) | (58.2%) | (49.7%) | (47.2%) | (45.5%) | (32.5%) | |
| C/10% UO2/40% PVP/20% Pt | 5.98 | 5.62 | 5.08 | 4.68 | 3.78 | 3.37 |
| (100%) | (94.0%) | (84.9%) | (78.3%) | (63.2%) | (56.4%) | |
| C/10% UO2/30% PVP/20% Pt | 8.79 | 7.87 | 6.08 | 5.86 | 5.57 | 4.91 |
| (100%) | (89.5%) | (69.2%) | (66.7%) | (63.4%) | (55.9%) | |
| C/10% UO2/20% PVP/20% Pt | 8.81 | 7.98 | 6.56 | 5.91 | 5.16 | 5.01 |
| (100%) | (90.6%) | (74.5%) | (67.1%) | (58.6%) | (56.9%) | |
| C/10% UO2/10% PVP/20% Pt | 9.82 | 9.03 | 8.06 | 7.14 | 6.49 | 6.34 |
| (100%) | (92.0%) | (82.1%) | (72.7%) | (66.1%) | (64.6%) | |
| C/10% UO2/5% PVP/20% Pt | 8.21 | 7.44 | 6.11 | 5.93 | 5.19 | 4.46 |
| (100%) | (90.6%) | (74.4%) | (72.2%) | (63.2%) | (54.3%) | |
| C/10% UO2/20% Pt | 6.40 | 5.92 | 5.64 | 4.87 | 4.07 | 3.3 |
| (100%) | (92.5%) | (88.1%) | (76.1%) | (63.6%) | (51.6%) | |
| C/10% PVP/20% Pt | 5.03 | 4.66 | 4.28 | 3.76 | 3.30 | 2.55 |
| (100%) | (92.6%) | (85.9%) | (74.8%) | (65.6%) | (50.7%) | |
| 20% Pt/C | 4.87 | 4.52 | 4.28 | 3.27 | 3.01 | 2.35 |
| (100%) | (92.8%) | (87.9%) | (67.1%) | (61.8%) | (48.3%) |
After 1000 cycles of cyclic voltammetric scanning (CV) test, the catalytic activity of each catalyst decreased, because as the test proceeded, the incomplete oxidation of ethanol produced COads, which formed stable Pt-COads with Pt and occupied the active site of Pt, causing the decrease of catalytic activity, while the acidic solution had a certain corrosive effect on the catalyst, and small particles of Pt dissolved in the solution, causing a decrease in electrocatalytic activity, and UO2 particles are more easily lost in acidic solutions, reducing the anti-poisoning effect of UO2 on the catalyst. After 1000 cycles, the catalytic activity retention of the C/10% UO2/20% Pt catalyst was 51.6%, which is a significant improvement compared to 48.3% for Pt/C. This is mainly due to the fact that UO2 is a fluorite structure, and its lattice contains additional stored oxygen, and when the Pt catalyst is poisoned to form Pt-COads, UO2 will release the stored oxygen to oxidize COads and release the active site of Pt. Meanwhile, UO2 is able to slowly release alpha particle, and the HO˙ generated from irradiated water can also oxidize COads and relieve Pt poisoning, and due to the extremely long half-life of U, UO2 can theoretically function continuously, thus achieving the purpose of “self-reactivation”; while the electrochemical stability is significantly improved by the introduction of PVP, with C/10% UO2/10% PVP/20% Pt catalyst. The activity retention rate of the C/10% UO2/10% PVP/20% Pt catalyst is 64.6%, which is a significant increase compared to the catalytic activity retention rate of 51.6% for the C/10% UO2/20% Pt catalyst. We think that there are two reasons for this. On the one hand, the introduction of PVP enhances the hydrophilicity of the catalyst, which makes the catalyst surface gather more water molecules and form oxidation groups Pt-OHads more easily, which plays an important role in alleviating the poisoning of Pt (Pt-COads + OHα → Pt + CO2 + H+ + e−).34 On the other hand, due to the encapsulation effect of PVP, the acid resistance of the catalyst is greatly enhanced, and thus the loss of UO2 in acidic solutions is reduced, enabling it to have a sustained effect on mitigating CO poisoning of Pt catalysts. Thereby, we suggest that the combined effect of PVP and UO2 substantially enhances the catalytic activity and activity retention properties of the catalyst, producing excellent effects on the alleviation of Pt-based poisoning.
Subsequently, we tested and analyzed the amount of the loss of UO2 loaded on the catalyst after 1000 cycles of CV test. After comparison, it was found that the loss of UO2 from Pt/UO2/C catalyst after 1000 cycles of CV test was as high as 43.18%, which was caused by the dissolution of UO2 in acidic solution, while when 10% PVP was loaded, the loss of UO2 from catalyst Pt/PVP/UO2/C after 1000 cycles of CV test was only 10.14%, and PVP played an excellent role of encapsulation, which greatly reduced the loss of UO2 and enabled UO2 to continuously relieve the CO poisoning of Pt catalyst and improve the and the C/UO2/PVP/Pt catalyst showed better electrochemical activity and electrochemical stability of the catalyst.
The stability of catalysts is important for fuel cells. In order to study the catalyst stability, current–time curve (I–t) tests were performed on the catalysts. Fig. 8 shows the I–t of Pt/C, C/PVP/Pt, C/UO2/Pt, and catalysts with different PVP loadings of C/UO2/PVP/Pt in nitrogen-saturated 0.5 mol L−1 H2SO4 and 0.5 mol L−1 CH3CH2OH mixed solutions graph. As presented in Fig. 8, the charging effect of the bilayer makes the current exhibit a maximum in the first few seconds, followed by a significant decrease in both catalyst currents, which is caused by the decay of the ethanol oxidation activity of the catalyst, attributed to the accumulation of toxic intermediate species generated by ethanol oxidation, which poison and deactivate the Pt group, leading to a decrease in catalytic activity, and as the generation of intermediate toxic species also gradually tends to equilibrium, the decay of the current also gradually slows down and the curve infinitely approximates to a horizontal line. The current densities of the I–t curves for the 3000 s are shown in Table 4. The current density of catalyst C/10% UO2/10% PVP/20% Pt is as high as 2.62 mA cm−2, while the current density of catalyst C/10% UO2/20% Pt is only 0.82 mA cm−2. The Pt/C current density was even lower, which was closely related to the encapsulation effect of PVP on UO2 particles, which greatly enhanced the acid resistance of the catalyst and reduced its loss in sulfuric acid solution, enabling it to play a sustained role in alleviating CO poisoning of Pt, indicating that the introduction of PVP and UO2 could significantly enhance the resistance of the catalyst to CO poisoning.
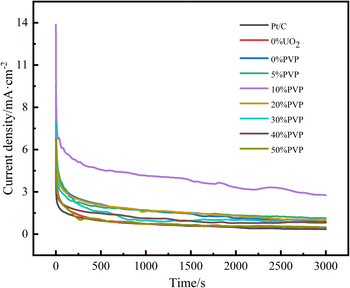 | ||
| Fig. 8 Amperometric I–t curves of ethanol oxidation on catalyst systems in a mixture of 0.5 mol L−1 H2SO4 + 0.5 mol L−1 C2H5OH solution at 25 °C at a scan rate of 50 mV s−1. | ||
| Catalysts | Stable current density/mA cm−2 |
|---|---|
| C/10% UO2/50% PVP/20% Pt | 0.46 |
| C/10% UO2/40% PVP/20% Pt | 0.76 |
| C/10% UO2/30% PVP/20% Pt | 0.77 |
| C/10% UO2/20% PVP/20% Pt | 0.93 |
| C/10% UO2/10% PVP/20% Pt | 2.62 |
| C/10% UO2/5% PVP/20% Pt | 1.06 |
| C/10% UO2/20% Pt | 0.82 |
| C/10% PVP/20% Pt | 0.45 |
| Pt/C | 0.33 |
4. Conclusion
By adding PVP in the process of preparing direct ethanol fuel cell catalyst, the problem of easy loss of UO2 in acidic condition was successfully solved. XRD, TEM, EDS, XPS, ICP-MS and other test results show that the successful addition of PVP has a coating effect on UO2. When the addition of PVP is 10%, the actual loading of the catalyst is very close to the theoretical value, and the Pt nanoparticles are uniformly distributed and the particle size reaches 3.6 nm.The electrochemical workstation test results show that the C/UO2/10% PVP/Pt catalyst has the highest ECSA, which is due to the fact that the particle size of Pt nanoparticles is the smallest under the same Pt loading, which provides more active sites for the catalytic oxidation of ethanol. When the PVP load was 10%, the UO2 loss of the C/UO2/PVP/Pt catalyst decreased from 43.18% to 10.14%. The C/UO2/Pt catalyst showed better electrochemical activity and electrochemical stability. After 1000 CV tests, its electrochemical activity was 1.5 times that of the PVP catalyst, and the electrochemical stability was twice that of the PVP catalyst. The electrochemical stability of C/UO2/PVP/Pt catalyst is 1.25 times higher than that of C/UO2/Pt catalyst and 1.33 times higher than that of Pt/C catalyst after 1000 cycles of CV testing.
The improvement of PVP on the catalytic activity and stability of the catalyst is mainly reflected in two aspects. First, PVP plays a good role in coating UO2, reducing the loss of UO2 in acid solution, maintaining the UO2 load in the catalyst at a high level, continuously releasing alpha particles to produce a large number of oxidizing ˙OH (H2O + *α → OHα + H+ + e−), while O2 in the UO2 lattice is constantly released, effectively oxidizing the COads on the surface of Pt and releasing the active site of Pt (Pt-COads + OHα → Pt + CO2 + H+ + e−). Play the role of catalyst self-reactivation. Secondly, the addition of PVP in the preparation process of the catalyst can effectively improve the hydrophilicity of carbon black, so that Pt is uniformly dispersed on the surface of the catalyst, and has a smaller particle size, providing more reaction active sites. And increasing the hydrophilicity of the catalyst can allow more ethanol molecules in the solvent to produce Pt-COads with Pt, further improving the catalytic performance. However, the addition of a large amount of PVP will have the opposite effect, too much PVP will bury Pt nanoparticles and reduce the utilization of Pt; the addition of a large amount of PVP will reduce the electrical conductivity of the catalyst and reduce the catalytic activity of the catalyst.
Therefore, it was found through this paper that 10% is the optimal addition of PVP, which can significantly enhance the catalytic activity and stability of the catalyst and provide a new idea for the modification of direct ethanol fuel cell anode catalyst.
Author contributions
Zhanjun Zhang: formal analysis, investigation, visualization, writing – original draft. Qipeng Liu: data curation, investigation. Dashu Pan: writing – review&editing. Yubing Xue: writing – review&editing. Xiaojuan Liu: formal analysis, validation. Jing Zhao: formal analysis. Yinggen Ouyang: methodology, project administration. Xiaofan Ding: conceptualization. Songtao Xiao: funding acquisition, supervision. Qingyuan Yang: resources.Conflicts of interest
There are no conflicts to declare.Acknowledgements
The authors gratefully acknowledge the financial support for this project provided by the National Natural Science Foundation of China.Notes and references
- H. A. Gasteiger and N. M. Markovic, Sci, 2009, 324, 48–49 CrossRef CAS PubMed.
- H. Yang and Y. D. Yin, ChemSusChem, 2013, 6, 1781–1783 CrossRef CAS PubMed.
- R. Borup, J. Meyers, B. Pivovar, Y. Kim, R. Mukundan, N. Garland, D. Myers, M. Wilson, F. Garzon, D. Wood, P. Zelenay, K. More, K. Stroh, T. Zawodzinski, J. Boncella, J. McGrath, M. Inaba, K. Miyatake, M. Hori, K. Ota, Z. Ogumi, S. Miyata, A. Nishikata, Z. Siroma, Y. Uchimoto, K. Yasuda, K. Kimijima and N. Iwashita, Chem. Rev., 2007, 107, 3904–3951 CrossRef CAS PubMed.
- T. Ogawa, M. Takeuchi and Y. Kajikawa, Sustainability, 2018, 10, 458 CrossRef.
- Y. L. Liu, Y. H. Su, C. M. Chang, Suryani, D. M. Wang and J. Y. Lai, J. Mater. Chem., 2010, 20, 4409–4416 RSC.
- G. Audi, O. Bersillon, J. Blachot and A. H. Wapstra, Nucl. Phys. A, 2003, 729, 3–128 CrossRef.
- P. W. W. Joseph, E. T. Bengt, C. Jonathan, K. Andrew and K. Nikolas, J. Phys. Chem. C, 2018, 122, 7149–7165 CrossRef.
- G. L. Gresham, A. K. Gianotto, P. D. B. Harrington, L. B. Cao, J. R. Scott, J. E. Olson, A. D. Appelhans, M. J. V. Stipdonk and G. S. Groenewold, J. Phys. Chem. A, 2003, 107, 8530–8538 CrossRef CAS.
- Y. Xue, D. Pan, F. Zuo, S. Tao, X. Li, F. Lou, M. Li and Y. Ouyang, RSC Adv., 2022, 12, 17012–17019 RSC.
- D. Gao, Z. Zhang, L. Ding, J. Yang and Y. Li, Nano Res., 2015, 8, 546–553 CrossRef CAS.
- D. Pan, Y. Xue, S. Xiao, Y. Ouyang, F. Zou, F. Lou and X. Li, RSC Adv., 2022, 12, 22565–22573 RSC.
- R. F. Bonan, P. R. F. Bonan, A. U. D. Batista, F. C. Sampaio, A. J. R. Albuquerque, M. C. B. Moraes, L. H. C. Mattoso, G. M. Glenn, E. S. Medeiros and J. E. Oliveira, Mater. Sci. Eng., C, 2015, 48, 372–377 CrossRef CAS PubMed.
- M. Espinoza-Castañeda, A. D. L. Escosura-Muñiz, A. Chamorro, C. D. Torres and A. Merkoci, Biosens. Bioelectron., 2015, 67, 107–114 CrossRef PubMed.
- R. Y. Zhong, K. Q. Sun, Y. C. Hong and B. Q. Xu, ACS Catal., 2014, 4, 3982–3993 CrossRef CAS.
- S. Lu, R. Xiu, X. Xu, D. Liang, H. Wang and Y. Xiang, J. Membr. Sci., 2014, 464, 1–7 CrossRef CAS.
- A. Bozkurt and W. H. Meyer, J. Polym. Sci., Polym. Phys., 2001, 39, 1987–1994 CrossRef CAS.
- Z. Yang, I. H. Hafez, M. R. Berber and N. Nakashima, ChemCatChem, 2015, 7, 808–813 CrossRef CAS.
- Z. Yang, C. Kim, S. Hirata, T. Fujigaya and N. Nakashima, ACS Appl. Mater. Interfaces, 2015, 7, 15885–15891 CrossRef CAS PubMed.
- Z. Yang, M. R. Berber and N. Nakashima, J. Mater. Chem. A, 2014, 2, 18875–18880 RSC.
- H. Tsunoyama, N. Ichikuni, H. Sakurai and T. Tsukuda, J. Am. Chem. Soc., 2009, 131, 7086–7093 CrossRef CAS PubMed.
- X. Liu, Y. Xu, Z. Wu and H. Chen, Macromol. Biosci., 2013, 13, 147–154 CrossRef CAS PubMed.
- S. Sharma, A. Ganguly, P. Papakonstantinou, X. Miao, M. Li, J. L. Hutchison, M. Delichatsios and S. Ukleja, J. Phys. Chem. C, 2010, 114, 19459–19466 CrossRef CAS.
- D. He, K. Chen, H. Li, T. Pang, F. Xu, S. Mu and M. Pan, Langmuir, 2012, 28, 3979–3986 CrossRef CAS PubMed.
- M. A. F. Akhairi and S. K. Kamarudin, Int. J. Hydrogen Energy, 2016, 41, 4214–4228 CrossRef CAS.
- E. Antolini, Appl. Catal., B, 2009, 88, 1–24 CrossRef CAS.
- J. J. Fan, Y. J. Fan, R. X. Wang, S. Xiang, H. G. Tang and S. G. Sun, J. Mater. Chem. A, 2017, 5, 19467–19475 RSC.
- H. L. Shi, R. Y. Wang, M. R. Lou, D. Jia, Y. Guo, X. C. Wang and L. X. Wang, Electrochim. Acta, 2019, 294, 93–101 CrossRef CAS.
- S. Sharma, A. Ganguly, P. Papakonstantinou, X. P. Miao, M. X. Li, J. L. Hutchison and S. Ukleja, J. Phys. Chem. C, 2010, 114, 19459–19466 CrossRef CAS.
- F. Su, Z. Tian, C. K. Poh, Z. Wang, S. H. Lim, Z. Liu and J. Lin, Chem. Mater., 2010, 22, 832–839 CrossRef CAS.
- A. C. Ferreira, A. P. Goncalves, T. A. Gasche, A. M. Ferraria, A. M. Botelho do Rego, M. R. Correia, A. M. Bola and J. B. Branco, J. Alloys Compd., 2010, 497, 249–258 CrossRef CAS.
- S. Ramakrishnan, M. Karuppannan, M. Vinothkannan, K. Ramachandran, O. J. Kwon and D. J. Yoo, ACS Appl. Mater. Interfaces, 2019, 11, 12504–12515 CrossRef CAS PubMed.
| This journal is © The Royal Society of Chemistry 2023 |


