DOI:
10.1039/D3RA01131C
(Paper)
RSC Adv., 2023,
13, 10157-10167
Effect of regulating the different proportions of Zr to Mn elements on the hydrogen storage properties of titanium–iron–manganese–hydrogen storage alloys
Received
20th February 2023
, Accepted 19th March 2023
First published on 3rd April 2023
Abstract
The effect of regulating the different proportions (0, 1![[thin space (1/6-em)]](https://www.rsc.org/images/entities/char_2009.gif) :
:![[thin space (1/6-em)]](https://www.rsc.org/images/entities/char_2009.gif) 3, 1
3, 1![[thin space (1/6-em)]](https://www.rsc.org/images/entities/char_2009.gif) :
:![[thin space (1/6-em)]](https://www.rsc.org/images/entities/char_2009.gif) 2 and 1
2 and 1![[thin space (1/6-em)]](https://www.rsc.org/images/entities/char_2009.gif) :
:![[thin space (1/6-em)]](https://www.rsc.org/images/entities/char_2009.gif) 1) of Zr to Mn elements on the hydrogen storage properties of TiFe0.85−xMn0.15Zrx (x = 0, 0.05, 0.075 and 0.15) alloys was systematically studied in this work. The results showed that all alloys mainly showed TiFe and MgZn2 type phases. The MgZn2 type phase went up with the proportion of Zr to Mn elements. At the same time, increasing the proportion of Zr to Mn elements enhanced the first hydrogenation properties. In addition, the x = 0.15 alloy showed the highest hydrogen storage capacity during the first hydrogenation process. This was because the MgZn2 type phase could improve the penetration of hydrogen atoms and enhance the diffusion of hydrogen atoms. During the test of prolonged air exposure, it was clear that the oxidation resistance also increased with the proportion of Zr to Mn elements. In addition to this, the effect of the starting particle size was also studied. When the length of the starting particle size was around 0.5 cm, the x = 0.05 alloy did not absorb any hydrogen within 1500 seconds. However, the x = 0.15 alloy could be activated in only around 100 seconds. Finally, the rate limiting step of the first hydrogenation and PCT properties were also investigated.
1) of Zr to Mn elements on the hydrogen storage properties of TiFe0.85−xMn0.15Zrx (x = 0, 0.05, 0.075 and 0.15) alloys was systematically studied in this work. The results showed that all alloys mainly showed TiFe and MgZn2 type phases. The MgZn2 type phase went up with the proportion of Zr to Mn elements. At the same time, increasing the proportion of Zr to Mn elements enhanced the first hydrogenation properties. In addition, the x = 0.15 alloy showed the highest hydrogen storage capacity during the first hydrogenation process. This was because the MgZn2 type phase could improve the penetration of hydrogen atoms and enhance the diffusion of hydrogen atoms. During the test of prolonged air exposure, it was clear that the oxidation resistance also increased with the proportion of Zr to Mn elements. In addition to this, the effect of the starting particle size was also studied. When the length of the starting particle size was around 0.5 cm, the x = 0.05 alloy did not absorb any hydrogen within 1500 seconds. However, the x = 0.15 alloy could be activated in only around 100 seconds. Finally, the rate limiting step of the first hydrogenation and PCT properties were also investigated.
1. Introduction
With the rapid development of human society, the demand for energy is increasingly exuberant. However, the traditional fossil energy reserves are limited, so it is urgent to develop new energy sources.1–3 Hydrogen energy as a new type of secondary energy has been widely considered because of its high calorific value, producing no pollution and abundant reserves.4 In order to achieve the large-scale application of hydrogen energy, in addition to hydrogen production and application, hydrogen storage has become the bottleneck of hydrogen energy utilization. If the problem of hydrogen storage is not solved, it will be difficult to popularize the application of hydrogen energy. At present, there are three main types of hydrogen storage technologies, namely compressed hydrogen storage, liquid hydrogen storage and solid-state hydrogen storage. Among these three hydrogen storage technologies, solid-state hydrogen storage is the most promising hydrogen storage technology due to its good safety and high volumetric hydrogen storage density.3,5–7
In order to develop the solid-state hydrogen storage technology, we must find and develop different high-performance hydrogen storage materials. TiFe alloy has attracted much attention because of its excellent properties including high hydrogen storage capacity (around 1.86 wt%), low cost and abundant reserves.8–13 But the disadvantages of TiFe alloy are very clear. The difficult activation is the first problem needed to be solved. In order to solve the problem of difficult activation, the researchers have done a lot of research work, mainly including element addition or substitution (Mn,14–19 Cr,11,16,17,19 Zr,20–22 V,23 Pr,24 La,25 Sm,26 Al,27 Ni,28 Cu,8 Y,19 S,29 etc.) and mechanical deformation.9,10,30–33 The researchers found that element addition or substitution was a very easy way to improve the activation of TiFe alloy. Among so many elements, Mn was considered as a good choice.8,14–19,21,34,35 Zeaiter et al.35 studied the effect of thermo-chemical treatment on the hydrogen storage properties of TiFe0.9Mn0.1 alloy. They found that TiFe0.9Mn0.1 alloy after thermo-chemical treatment showed a faster first hydrogenation kinetics. Shang et al.18 prepared Ti1.1Fe0.8Mn0.2 alloy and found substituting Fe with Mn partly made the average grain size decrease. This reduction was very helpful for the first hydrogenation and improving its hydrogen storage capacities. Yang et al.19 reported the microstructure and positive hydrogen storage properties of TiFe-based alloys after introducing Mn element. Park et al.17 synthesized TiFe0.9Mn0.1, TiFe0.8Mn0.2 and TiFe0.7Mn0.3 alloys and compared the effect of different Mn contents on the first hydrogenation kinetics of air-exposed TiFe-based hydrogen storage alloys. Dematteis et al.15 investigated the thermodynamic changes induced by the variation of the substitution of Mn for Fe between 0 and 5 at%. Barale et al.14 explored the application of TiFe0.85Mn0.05 alloy (around 5 kg) in a hydrogen storage plant. From the above studies, it was clear that although the addition/substitution of Mn could effectively improve the first hydrogenation properties of TiFe alloy, but most of Ti–Fe–Mn alloys still needed prior heat treatment or hydrogen exposure before it could absorb the hydrogen.
Recently, Modi et al.16 studied the hydrogen storage properties of TiFe0.85Mn0.15 alloy. They used ball milling to process TiFe0.85Mn0.15 alloy to make the alloy absorb the hydrogen directly under 3 MPa hydrogen pressure. However, the hydrogen pressure during the hydrogenation process was still high and its hydrogen storage capacity was only around 1.2 wt%. In previous studies,20–22 Zr element was considered as a positive element to improve the hydrogen storage properties of TiFe alloy. This phenomenon provided us with a good idea to introduce Zr element to TiFe0.85Mn0.15 alloy to further improve its hydrogen storage properties. So how did we regulate the content of Zr to make TiFe0.85Mn0.15 alloy has the best hydrogen storage properties? Therefore, we decided to study the effect of regulating the different proportions of Zr to Mn elements on the hydrogen storage properties of TiFe0.85Mn0.15 alloy in this work.
2. Materials and methods
ZhongNuo Advanced Material (Beijing) Technology Co., Ltd provided the raw materials including Ti (99.9%), Fe (99.9%), Mn (99.9%) and Zr (99.9%). The alloys TiFe0.85−xMn0.15Zrx (x = 0, 0.05, 0.075 and 0.15) were synthesized by using arc melting machine (SP-MSM20-7, Shenyang Kejing Co., Ltd). When x = 0, 0.05, 0.075 and 0.15, the proportion of Zr to Mn elements was 0, 1![[thin space (1/6-em)]](https://www.rsc.org/images/entities/char_2009.gif) :
:![[thin space (1/6-em)]](https://www.rsc.org/images/entities/char_2009.gif) 3, 1
3, 1![[thin space (1/6-em)]](https://www.rsc.org/images/entities/char_2009.gif) :
:![[thin space (1/6-em)]](https://www.rsc.org/images/entities/char_2009.gif) 2 and 1
2 and 1![[thin space (1/6-em)]](https://www.rsc.org/images/entities/char_2009.gif) :
:![[thin space (1/6-em)]](https://www.rsc.org/images/entities/char_2009.gif) 1, respectively. During the process of arc melting, we weighed the exact mass of the metal firstly and put them in a copper crucible. Then we began to melt the alloy and inverted the alloy three or four times to achieve a homogeneous composition. For the ordinary measurement, we smashed the alloy into powder and loaded the powder in the sample holder in air in a very short time (<2 minutes). For a test of prolonged air exposure, we crushed the alloy into powder in air and put the powder in an open plastic tube for different air exposure time (2 and 24 hours). The process of preparing TiFe0.85−xMn0.15Zrx (x = 0, 0.05, 0.075 and 0.15) alloys after different air exposure time was shown in Fig. 1.
1, respectively. During the process of arc melting, we weighed the exact mass of the metal firstly and put them in a copper crucible. Then we began to melt the alloy and inverted the alloy three or four times to achieve a homogeneous composition. For the ordinary measurement, we smashed the alloy into powder and loaded the powder in the sample holder in air in a very short time (<2 minutes). For a test of prolonged air exposure, we crushed the alloy into powder in air and put the powder in an open plastic tube for different air exposure time (2 and 24 hours). The process of preparing TiFe0.85−xMn0.15Zrx (x = 0, 0.05, 0.075 and 0.15) alloys after different air exposure time was shown in Fig. 1.
 |
| | Fig. 1 The process of preparing TiFe0.85−xMn0.15Zrx (x = 0, 0.05, 0.075 and 0.15) alloys after different air exposure time. | |
A Bruker D8 Advance X-ray diffractometer (Cu K) was used to measure the crystal structure of the alloy. A Hitachi TM4000Plus scanning electron microscope was used to measure the morphology of the alloy. A homemade Sieverts-type apparatus was used to measure the hydrogen storage properties of the alloy. The system had to be vacuumed for 30 minutes before each measurement. In addition, it must be pointed out that we did not give any heat treatment or hydrogen exposure to the alloy. The test conditions for all hydrogen absorption were room temperature and 2 MPa hydrogen pressure. The experimental error on the hydrogen content measured in wt% (mass of hydrogen over mass of metal) was evaluated as 0.05 wt%.
3. Results and discussion
3.1. First hydrogenation properties
Fig. 2 shows the first hydrogenation properties of TiFe0.85−xMn0.15Zrx (x = 0, 0.05, 0.075 and 0.15) alloys at room temperature and under 2 MPa hydrogen pressure. Before the first hydrogenation, there was no any prior heat treatment and hydrogen exposure. First, it was clear that all alloys absorbed the hydrogen directly except x = 0 alloy at room temperature and under 2 MPa hydrogen pressure. It was very clear that x = 0 alloy did not absorb the hydrogen within 2000 seconds. Modi et al.16 reported that TiFe0.85Mn0.15 alloy after ball milling for 30 minutes absorbed the hydrogen immediately. This was different from our result. This possible reason was because we did not use ball milling to process the alloy and the lower hydrogen pressure (2 MPa) was used in our first hydrogenation process. In fact, TiFe0.85Mn0.15 alloy without treatment could not be activated at room temperature and under 2 MPa hydrogen pressure even after a few hours according to our measurement. In addition to this, the maximum hydrogen storage capacity increased with the increase of the proportion of Zr to Mn elements. Second, it was clear that the reaction rate of first hydrogenation of x = 0.075 and 0.15 alloys was similar and faster than x = 0.05 and 0 alloys. Third, x = 0.075 and 0.15 alloys absorbed more than 98% of maximum hydrogen storage capacity within 500 seconds. However, x = 0.05 alloy needed more than 2000 seconds to finish its first hydrogenation. These results demonstrated that increasing the proportion of Zr to Mn elements led to the improvement of first hydrogenation capacities of TiFe0.85−xMn0.15Zrx (x = 0, 0.05, 0.075 and 0.15) alloys.
 |
| | Fig. 2 First hydrogenation properties of TiFe0.85−xMn0.15Zrx (x = 0, 0.05, 0.075 and 0.15) alloys at room temperature and under 2 MPa hydrogen pressure. | |
3.2. Morphology
Fig. 3 shows the backscattered electron micrograph of TiFe0.85−xMn0.15Zrx (x = 0 (a), 0.05 (b), 0.075 (c) and 0.15 (d)) alloys in 100 μm. It was clear that all alloys showed three-phase structure, including the white phase, grey phase and black phase. In addition, Ti, Fe and Mn elements were distributed in every corner of each alloy, but Zr element was seemly distributed in the white phase of the alloy. Further study, we found that the number of grain boundaries in all alloys increased with the proportion of Zr to Mn elements. Generally speaking, the presence of more grain boundaries led to the fast diffusion of hydrogen atoms.36 The grain boundaries could provide very clear native surface regions without oxidation, which was a possible way for improving the first hydrogenation.37 Further, it was also very clear that the increasing number of grain boundaries in Fig. 3 agreed with the trend of the first hydrogenation kinetics in Fig. 2.
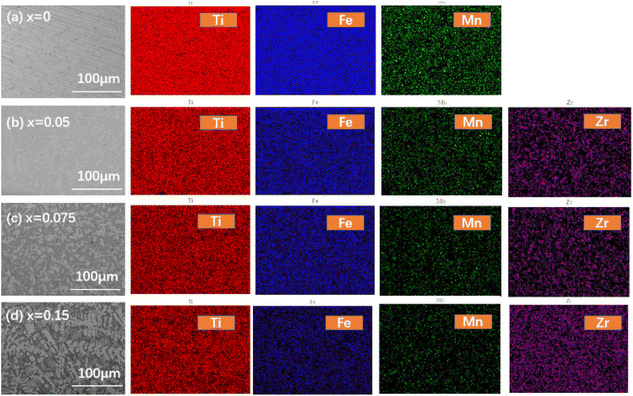 |
| | Fig. 3 Backscattered electron micrograph and element mapping of TiFe0.85−xMn0.15Zrx (x = 0 (a), 0.05 (b), 0.075 (c) and 0.15 (d)) alloys in 100 μm. | |
Fig. 4 showed the backscattered electron micrograph of TiFe0.85−xMn0.15Zrx (x = 0 (a), 0.05 (b), 0.075 (c) and 0.15 (d)) alloys in 20 μm. All alloys clearly showed the white phase, grey phase and black phase. Han et al.38 used scanning Kelvin probe force microscopy to study the phase of TiFe hydrogen storage alloy with adding Zr. They also found three phases including TiFe, TiFe2 (MgZn2 type) and β-Ti after adding 2 wt% Zr to TiFe hydrogen storage alloy. This result agreed with our experiment. Table 1 presented the composition of the point A (the representative composition of the white phase), point B (the representative composition of the grey phase) and point C (the representative composition of the black phase) from Fig. 4. It was clear that Zr was mainly in the white phase. The content of Ti in the grey and black phases were higher than the white phase. The content of Mn in the grey and black phases were lower than the white phase. In addition, the grey phase started to show the highest content of Fe after using Zr to replace Fe. Table 2 presented the area percentage of the white phase and the grey + black phases from Fig. 4 using image J software. It was seen clearly that the area percentage of the white phase rosed with increasing the proportion of Zr to Mn elements. For x = 0.15 alloy, the alloy showed the highest area percentage of the white phase (54.90%). In previous studies,20,39,40 it was proved that the white phase could act as gateways for hydrogen diffusion. The deep reason may be due to the changes of bond character. With the increase of the proportion of Zr to Mn elements, the ionicity decreased and made the interaction between hydrogen and metal weaken.15,38 This conclusion agreed with our result that x = 0.15 alloy showed the best first hydrogenation properties in Fig. 2.
 |
| | Fig. 4 Backscattered electron micrograph of TiFe0.85−xMn0.15Zrx (x = 0 (a), 0.05 (b), 0.075 (c) and 0.15 (d)) alloys in 20 μm. | |
Table 1 The composition of the point A (the representative composition of the white phase), point B (the representative composition of the grey phase) and point C (the representative composition of the black phase) from Fig. 4
| Sample |
Element |
Point A (wt%) |
Point B (wt%) |
Point C (wt%) |
| x = 0 |
Ti |
46.01 |
65.15 |
54.17 |
| Mn |
11.91 |
11.50 |
11.49 |
| Fe |
42.08 |
23.35 |
34.34 |
| x = 0.05 |
Ti |
33.89 |
43.33 |
58.70 |
| Mn |
13.22 |
8.10 |
6.26 |
| Fe |
35.59 |
43.63 |
21.04 |
| Zr |
17.30 |
4.94 |
14.00 |
| x = 0.075 |
Ti |
39.67 |
43.45 |
42.15 |
| Mn |
9.99 |
7.63 |
8.97 |
| Fe |
36.72 |
43.41 |
34.63 |
| Zr |
13.62 |
5.51 |
14.25 |
| x = 0.15 |
Ti |
35.55 |
44.56 |
40.34 |
| Mn |
10.67 |
9.24 |
9.63 |
| Fe |
26.84 |
38.64 |
24.90 |
| Zr |
26.94 |
7.56 |
25.13 |
Table 2 The area percentage of the white phase and grey + black phases from Fig. 4
| Sample |
White phase (%) |
Grey + black phases (%) |
| x = 0 |
7.95 |
92.05 |
| x = 0.05 |
10.88 |
89.12 |
| x = 0.075 |
33.73 |
66.27 |
| x = 0.15 |
54.90 |
45.10 |
3.3. XRD patterns
Fig. 5 shows the XRD patterns of TiFe0.85−xMn0.15Zrx (x = 0, 0.05, 0.075 and 0.15) alloys in as-cast state. From Fig. 5, it was clear that all alloys mainly contained TiFe (Pm![[3 with combining macron]](https://www.rsc.org/images/entities/char_0033_0304.gif) m (221)) and MgZn2 type phases (P63/mmc (194)). The TiFe phase should correspond to the grey phase. The MgZn2 type phase should correspond to the white phase. For the minor black phase, it should be β-Ti phase. However, the peaks of β-Ti phase were too weak to be found in XRD patterns in Fig. 5. It was very clear that the different proportions of Zr to Mn elements did not change the crystal structure of all alloys. This result agreed with previous studies.15,38
m (221)) and MgZn2 type phases (P63/mmc (194)). The TiFe phase should correspond to the grey phase. The MgZn2 type phase should correspond to the white phase. For the minor black phase, it should be β-Ti phase. However, the peaks of β-Ti phase were too weak to be found in XRD patterns in Fig. 5. It was very clear that the different proportions of Zr to Mn elements did not change the crystal structure of all alloys. This result agreed with previous studies.15,38
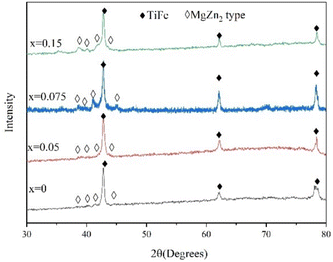 |
| | Fig. 5 XRD patterns of TiFe0.85−xMn0.15Zrx (x = 0, 0.05, 0.075 and 0.15) alloys in as-cast state. | |
Fig. 6 shows the XRD patterns of TiFe0.85−xMn0.15Zrx (x = 0, 0.05, 0.075 and 0.15) alloys in hydrogenation state. It was clear that TiFeH1.5, MgZn2 type and unknown phases were found after x = 0.05 alloy was hydrogenated. (FeMn)(Ti0.3Zr0.7)H2, MgZn2 type and unknown phases were found after x = 0.075 alloy was hydrogenated. TiFeH, Mn2(Ti0.1Zr0.9)H3.4, MgZn2 type and unknown phases were found after x = 0.15 alloy was hydrogenated.
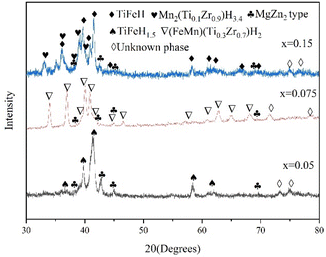 |
| | Fig. 6 XRD patterns of TiFe0.85−xMn0.15Zrx (x = 0.05, 0.075 and 0.15) alloys in hydrogenation state. | |
Table 3 shows the lattice parameter a (Å) of TiFe phase of TiFe0.85−xMn0.15Zrx (x = 0, 0.05, 0.075 and 0.15) alloys as determined by Rietveld analysis. The lattice parameter a of TiFe phase decreased from 2.99171 Å (x = 0) to 2.99163 Å (x = 0.05), 2.98596 Å (x = 0.075) and 2.98418 Å (x = 0.15). It was well known that the atomic radius of Zr atom was larger than Ti, Fe and Mn. If Zr atom replaced Fe atom completely, the lattice parameter a of TiFe alloy should be larger, but in fact the lattice parameter a was smaller. This result suggested that Zr atoms introduced did not completely replace iron atoms. Some Zr atoms dispersed in the alloy and existed in the grain interface. This phenomenon may lead to the reduction of the lattice parameter a of TiFe phase. Similar results were also reported by Park et al.41 and Zhai et al.25
Table 3 The lattice parameter a (Å) of TiFe phase of TiFe0.85−xMn0.15Zrx (x = 0, 0.05, 0.075 and 0.15) alloys as determined by Rietveld analysis
| Phase |
Sample |
| x = 0 |
x = 0.05 |
x = 0.075 |
x = 0.15 |
| TiFe |
a |
2.99171 |
2.99163 |
2.98596 |
2.98418 |
3.4. Hydrogen storage properties
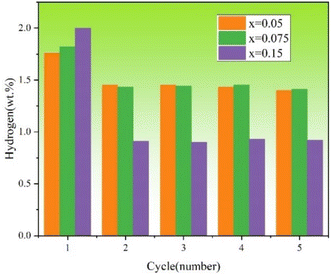
Fig. 7 shows the hydrogenation cycles (from 1st to 5th) of TiFe0.85−xMn0.15Zrx (x = 0.05, 0.075 and 0.15) alloys at room temperature and under 2 MPa hydrogen pressure. Before each hydrogen absorption cycle, the sample holder was vacuumed for 30 minutes at room temperature. Because x = 0 alloy could not be activated even after a few hours. Therefore, we did not study the other properties of x = 0 alloy in the following sections. It was very clear for us that the maximum hydrogen storage capacities of TiFe0.85−xMn0.15Zrx (x = 0.05, 0.075 and 0.15) alloys were reduced after the first cycle. And the maximum hydrogen storage capacity of each alloy was stable from 2nd to 5th cycles. The lost hydrogen storage capacity should be due to the formation of an irreversible hydride that captured some of hydrogen atoms. This may be because the β-Ti phase after hydrogenation could not decompose again and reduced the reversible hydrogen storage capacity.15 Similar results could be found in these previous studies.11,20,39,40 In addition to this, the reaction rate of all alloys increased after the first hydrogenation. This result showed that the first hydrogen absorption could effectively build the diffusion channel for hydrogen atoms. Stable hydrogen diffusion channels could ensure a stable reaction rate of hydrogen absorption and desorption. This result explained why each alloy had a stable reaction rate from the 2nd to 5th cycles.
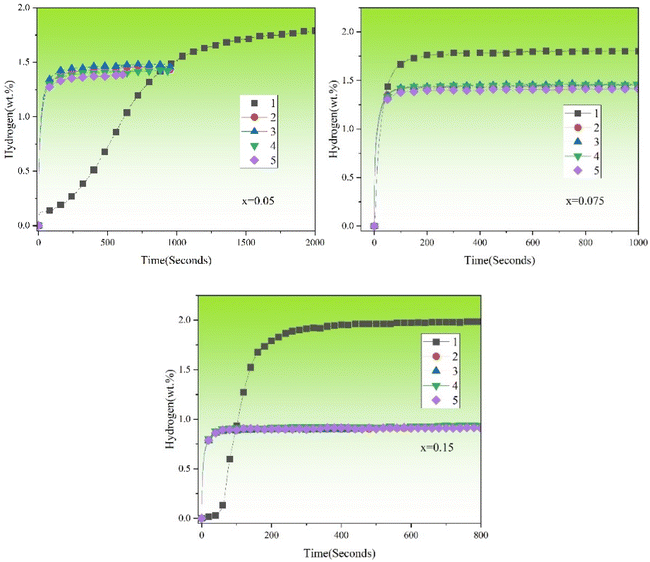 |
| | Fig. 7 Hydrogenation cycles (from 1st to 5th) of TiFe0.85−xMn0.15Zrx (x = 0.05, 0.075 and 0.15) alloys at room temperature and under 2 MPa hydrogen pressure. | |
Fig. 8 shows the hydrogen storage capacity of each hydrogenation cycle (from 1st to 5th) of TiFe0.85−xMn0.15Zrx (x = 0.05, 0.075 and 0.15) alloys at room temperature and under 2 MPa hydrogen pressure. It was very clear that x = 0.15 alloy showed the lowest reversible hydrogen storage capacity (around 0.92 wt%). x = 0.05 and 0.075 alloys showed higher reversible hydrogen storage capacity (around 1.44 and 1.43 wt%). In order to get the accurate hydrogen storage capacity retention rate of each alloy, the maximum hydrogen absorption capacity of the first hydrogenation and the average reversible hydrogen storage capacity, the average loss of hydrogen storage capacity and the hydrogen storage capacity retention rate of TiFe0.85−xMn0.15Zrx (x = 0.05, 0.075 and 0.15) alloys were summarized in Table 4. We could see clearly that the maximum hydrogen absorption capacity of the first hydrogenation increased with the proportion of Zr to Mn elements. However, the hydrogen storage capacity retention rate decreased with the proportion of Zr to Mn elements. It was very clear that x = 0.05 alloy showed the best stability of circulation. This result demonstrated that the different proportions of Zr to Mn elements had an important influence on the reversible hydrogen storage capacity of TiFe0.85−xMn0.15Zrx (x = 0.05, 0.075 and 0.15) alloys.
 |
| | Fig. 8 Hydrogen storage capacity of each hydrogenation cycle (from 1st to 5th) of TiFe0.85−xMn0.15Zrx (x = 0.05, 0.075 and 0.15) alloys at room temperature and under 2 MPa hydrogen pressure. | |
Table 4 The maximum hydrogen absorption capacity of the first hydrogenation and the average reversible hydrogen storage capacity, the average loss of hydrogen storage capacity and the hydrogen storage capacity retention rate of TiFe0.85−xMn0.15Zrx (x = 0.05, 0.075 and 0.15) alloys
| Sample |
x = 0.05 |
x = 0.075 |
x = 0.15 |
| The maximum hydrogen absorption capacity of first hydrogenation (wt%) |
1.76 |
1.82 |
2.00 |
| The average reversible hydrogen storage capacity (wt%) |
1.44 |
1.43 |
0.92 |
| The average loss of hydrogen storage capacity (wt%) |
0.32 |
0.39 |
1.08 |
| The hydrogen storage capacity retention rate (%) |
81.81 |
78.57 |
46.00 |
3.5. Effect of starting particle size on first hydrogenation
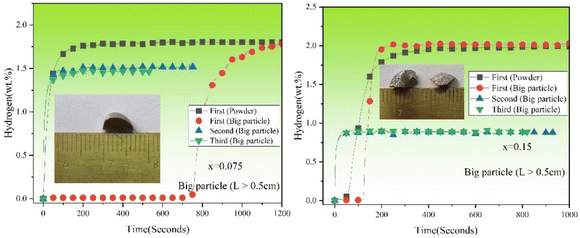
Fig. 9 shows the first hydrogenation curves of TiFe0.85−xMn0.15Zrx (x = 0.05, 0.075 and 0.15) alloys in different starting particle sizes at room temperature and under 2 MPa hydrogen pressure. Research on hydrogen absorption of large-size alloys is of great value in the industry. It was very clear from Fig. 9 that the starting particle size had an obvious effect on the first hydrogenation of TiFe0.85−xMn0.15Zrx (x = 0.05, 0.075 and 0.15) alloys. When the starting particle size was around 0.5 cm, the first hydrogenation of TiFe0.85−xMn0.15Zrx (x = 0.05, 0.075 and 0.15) alloys showed completely different curves. For x = 0.05 alloy, it could not be activated after 1500 seconds at all. For x = 0.075 alloy, it showed a long incubation time of around 750 seconds. For x = 0.15 alloy, the incubation time was around 100 seconds. This result proved the effect of the white phase again. The more white phases there were, the more gateways there were for the hydrogen atoms to diffuse.
 |
| | Fig. 9 First hydrogenation of TiFe0.85−xMn0.15Zrx (x = 0.05, 0.075 and 0.15) alloys in different starting particle sizes at room temperature and under 2 MPa hydrogen pressure. | |
Fig. 10 shows the hydrogenation cycles (1st to 3rd) of TiFe0.85−xMn0.15Zrx (x = 0.075 and 0.15) alloys in different starting particle sizes at room temperature and under 2 MPa hydrogen pressure. Because x = 0.05 alloy with the big starting particle size could not absorb the hydrogen, we did not present its cycle here. It was clear that the big starting particle size only had an effect on the first hydrogenation properties compared with the powder size. The main change is the incubation time after increasing the starting particle size. The incubation time of x = 0.075 alloy was around 70 times longer. However, the incubation time of x = 0.15 alloy was only around 2 times longer. But the hydrogen storage capacity kept stable. This result showed that the starting particle size of the alloy had little effect on the first hydrogen absorption properties after increasing the proportion of Zr to Mn elements. After the first hydrogenation, x = 0.075 and 0.15 alloys both absorbed the hydrogen easily. In addition, the reversible hydrogen storage capacities of x = 0.075 and 0.15 alloys in the 2nd and 3rd cycle were almost as same as the values in Fig. 7. This proved that the starting particle size had no effect on the hydrogenation cycle properties.
 |
| | Fig. 10 Hydrogenation cycles (1st to 3rd) of TiFe0.85−xMn0.15Zrx (x = 0.075 and 0.15) alloys in different starting particle sizes at room temperature and under 2 MPa hydrogen pressure. | |
3.6. Oxidation resistance
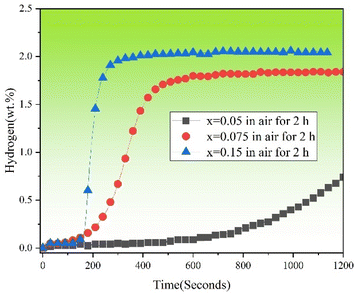
The oxidation resistance is of great value to the practical application of hydrogen storage alloys. Fig. 11 shows the first hydrogenation curves of TiFe0.85−xMn0.15Zrx (x = 0.05, 0.075 and 0.15) alloys exposed to air for 2 hours at room temperature and under 2 MPa hydrogen pressure. It was clear that compared with the alloys crushed in air for a short time in Fig. 2, all alloys (x = 0.05, 0.075 and 0.15) with prolonged air exposure presented a slower first hydrogenation kinetics. In particular, x = 0.05 alloy showed the slowest first hydrogenation kinetics and x = 0.15 alloy showed the fastest first hydrogenation kinetics. Table 5 shows the hydrogen absorption capacity and loss of capacity within 1200 seconds of the first hydrogenation of TiFe0.85−xMn0.15Zrx (x = 0.05, 0.075 and 0.15) alloys crushed in air for a short time and exposed to air for 2 hours. It was clear that with the increase of the proportion of Zr to Mn elements, the loss of capacity within 1200 seconds decreased. Here, it must be pointed out that the low hydrogen absorption capacity of x = 0.05 alloy was because we only picked up the data with 1200 seconds. Especially for x = 0.15 alloy, the air exposure had no effect on its first hydrogen storage capacity.
 |
| | Fig. 11 First hydrogenation curves of TiFe0.85−xMn0.15Zrx (x = 0.05, 0.075 and 0.15) alloys exposed to air for 2 hours at room temperature and under 2 MPa hydrogen pressure. | |
Table 5 Hydrogen absorption capacity and loss of capacity within 1200 seconds of the first hydrogenation of TiFe0.85−xMn0.15Zrx (x = 0.05, 0.075 and 0.15) alloys crushed in air for a short time and exposed to air for 2 hours
| Sample |
Parameters |
Crushed in air for a short time |
Exposed to air for 2 hours |
| x = 0 |
Hydrogen absorption capacity (wt%) |
— |
|
— |
| Loss of capacity (wt%) |
|
— |
|
| x = 0.05 |
Hydrogen absorption capacity (wt%) |
1.76 |
|
0.79 |
| Loss of capacity (wt%) |
|
0.93 |
|
| x = 0.075 |
Hydrogen absorption capacity (wt%) |
1.82 |
|
1.81 |
| Loss of capacity (wt%) |
|
0.01 |
|
| x = 0.15 |
Hydrogen absorption capacity (wt%) |
2.00 |
|
2.00 |
| Loss of capacity (wt%) |
|
0 |
|
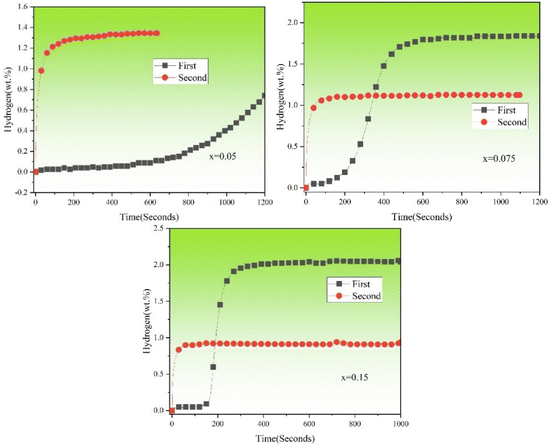
Fig. 12 shows the hydrogenation cycles (from 1st to 2nd) of TiFe0.85−xMn0.15Zrx (x = 0.05, 0.075 and 0.15) alloys exposed to air for 2 hours at room temperature and under 2 MPa hydrogen pressure. It was clear that the reversible hydrogen storage capacities of TiFe0.85−xMn0.15Zrx (x = 0.05, 0.075 and 0.15) alloys were 1.34, 1.12 and 0.92 wt%. Compared with the reversible hydrogen storage capacities (1.44, 1.43 and 0.92 wt%) of TiFe0.85−xMn0.15Zrx (x = 0.05, 0.075 and 0.15) alloys crushed in air for a short time in Fig. 7, the reversible hydrogen storage capacities of x = 0.05 and 0.075 alloys were a little lower, which suggested that air exposure for 2 hours had a negative effect on these two alloys. Bur for x = 0.15 alloy, the reversible hydrogen storage capacity had no change.
 |
| | Fig. 12 Hydrogenation cycles (from 1st to 2nd) of TiFe0.85−xMn0.15Zrx (x = 0.05, 0.075 and 0.15) alloys exposed to air for 2 hours at room temperature and under 2 MPa hydrogen pressure. | |
Fig. 13 shows the first hydrogenation curves of TiFe0.85−xMn0.15Zrx (x = 0.05 and 0.075) alloys exposed to air for 24 hours at room temperature and under 2 MPa hydrogen pressure. Prolonged air exposure (24 hours) had a serious effect on the first hydrogenation properties. The main manifestations were the increase of the incubation time and the decrease of the maximum hydrogen storage capacity. The incubation time of x = 0.075 alloy was shorted than x = 0.05 alloy. This result showed the strong oxidation resistance obtained from increasing the proportion of Zr to Mn elements. Some researchers had proved that the increase of the grain boundaries could provide more clear native surface regions without oxidation, which could enhance the diffusion of hydrogen atoms.37 It was clear that x = 0.075 alloy showed more grain boundaries than x = 0.05 alloy in Fig. 3 and 4. Therefore, x = 0.075 alloy still showed faster first hydrogenation reaction rate than x = 0.05 alloy after exposure in air for 24 hours.
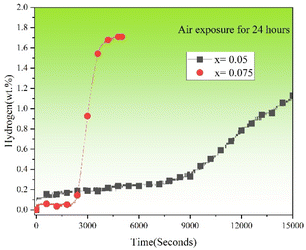 |
| | Fig. 13 First hydrogenation curves of TiFe0.85−xMn0.15Zrx (x = 0.05 and 0.075) alloys exposed to air for 24 hours at room temperature and under 2 MPa hydrogen pressure. | |
3.7. Rate limiting step
Regulating the different proportions of Zr to Mn elements has an important effect on the first hydrogenation properties of TiFe0.85Mn0.15 alloy. And the different compositions showed different first hydrogenation curves in Fig. 2. This result suggested that we should investigate the effect of the different proportions of Zr to Mn elements on the rate limiting step of the first hydrogenation curves of TiFe0.85−xMn0.15Zrx (x = 0.05, 0.075 and 0.15) alloys. Different rate limiting step models including Chemisorption,42–44 JMA,42–44 CV45–48 and GB49,50 were listed in Table 6. For each model equation, the left side should be considered as a function of the reaction completion ratio α(t) (α = %Habs/%Hmax), t was the reaction time, and k was the kinetic rate constant.
Table 6 Different rate limiting step models51,52
| Model name |
Model equation |
Model description |
| Chemisorption |
α = kt |
Surface controlled |
| JMA2D |
[−ln(1 − α)]1/2 = kt |
2D growth of existing nuclei with constant interface velocity |
| JMA3D |
[−ln(1 − α)]1/3 = kt |
3D growth of existing nuclei with constant interface velocity |
| CV2D |
1 − (1 − α)1/2 = kt |
2D growth with constant interface velocity |
| CV3D |
1 − (1 − α)1/3 = kt |
3D growth with constant interface velocity |
| GB2D |
(1 − α)ln(1 − α) + α = kt |
2D growth, diffusion controlled with decreasing interface velocity |
| GB3D |
1 − (2α/3) − (1 − α)2/3 = kt |
3D growth, diffusion controlled with decreasing interface velocity |
Fig. 14 shows the rate limiting step curves of the first hydrogenation of TiFe0.85−xMn0.15Zrx (x = 0.05 (a), 0.075 (b) and 0.15 (c)) alloys at room temperature and under 2 MPa hydrogen pressure. The reaction completion ratio was chosen from 0.1 to 0.9 according to our previous work.52 Table 7 shows the adjusted R2 values getting from the fitting curves from Fig. 14. The adjusted R2 value is the fitting correlation coefficient, which can reflect the quality of the fitting result. The closer to 1, the better the fitting result. It was very clear that x = 0.05 alloy showed CV3D model, which suggested “3D growth with constant interface velocity”. When Zr content increased from 0.075 to 0.15, two alloys both showed GB3D model. This result revealed that the rate limiting step of the first hydrogenation kinetics had changed from “3D growth with constant interface velocity” to “3D growth, diffusion controlled with decreasing interface velocity”.
 |
| | Fig. 14 The rate limiting step curves of the first hydrogenation of TiFe0.85−xMn0.15Zrx (x = 0.05 (a), 0.075 (b) and 0.15 (c)) alloys at room temperature and under 2 MPa hydrogen pressure. | |
Table 7 Adjusted R2 values getting from fitting curves from Fig. 14. The number in bold is the adjusted R2 value closest to 1
| |
Chemisorption |
JMA2D |
JMA3D |
CV2D |
CV3D |
GB2D |
GB3D |
| x = 0.05 |
0.9592 |
0.99017 |
0.97779 |
0.98976 |
0.99412 |
0.9824 |
0.97701 |
| x = 0.075 |
0.85793 |
0.93241 |
0.89907 |
0.93857 |
0.9591 |
0.98109 |
0.98999 |
| x = 0.15 |
0.90952 |
0.95911 |
0.93777 |
0.95976 |
0.97271 |
0.97859 |
0.98297 |
3.8. PCT properties
PCT curves of TiFe0.85−xMn0.15Zrx (x = 0.05, 0.075 and 0.15) alloys at room temperature were shown in Fig. 15. First, we could see clearly that the reversible hydrogen storage capacity decreased from x = 0.05 to 0.15. This meant that the increase of the proportion of Zr to Mn elements was harmful for the reversible hydrogen storage capacity. Second, it was clear that all alloys showed very close hydrogen absorption and desorption pressure, especially the hydrogen desorption pressure. It must be emphasized here that x = 0.15 alloy appeared to have two hydrogen absorption and desorption platforms in Fig. 15. This result agreed with the two kinds of hydrides (TiFeH, Mn2(Ti0.1Zr0.9)H3.4) formed in the hydrogenation process in Fig. 6.
 |
| | Fig. 15 PCT curves of TiFe0.85−xMn0.15Zrx (x = 0.05, 0.075 and 0.15) alloys at room temperature. | |
3.9. Hydrogen absorption and desorption mechanism
Fig. 16 shows the schematic diagram of hydrogen absorption and desorption mechanism of TiFe0.85−xMn0.15Zrx (x = 0.05, 0.075 and 0.15) alloys. It was clear that there were three phases including white phase, grey phase and black phase. From Fig. 2 and Table 2, we knew that the white phase could act as gateways for hydrogen diffusion. In addition, the white phase may be more attractive to the hydrogen molecules. As we discussed in Section 3.3, the increase of the proportion of Zr to Mn elements decreased the ionicity and made the interaction between hydrogen and metal weaken.38 Hydrogen molecules rapidly dissociated into hydrogen atoms on the surface of the white phase firstly. Then the hydrogen atoms diffused into the white phase and formed numerous cracks and pores, which could be used as the channels for the hydrogen atoms. This explained the alloy with higher white phase showed fast first hydrogenation kinetics.
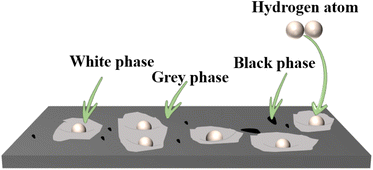 |
| | Fig. 16 Schematic diagram of hydrogen absorption and desorption mechanism of TiFe0.85−xMn0.15Zrx (x = 0.05, 0.075 and 0.15) alloys. | |
4. Conclusion
The effect of regulating the different proportions of Zr to Mn elements on the hydrogen storage properties of TiFe0.85Mn0.15 alloy was studied in this work. TiFe0.85−xMn0.15Zrx (x = 0, 0.05, 0.075 and 0.15) alloys were prepared by arc melting. The main conclusions were following.
(1) All alloys prepared showed three phases including the white phase, grey phase and black phase. In addition, the area percentage of the white phase increased with the increase of the proportion of Zr to Mn elements. The TiFe and MgZn2 type phases should correspond to the grey and white phases, respectively.
(2) Increasing the proportion of Zr to Mn elements obviously enhanced the first hydrogenation properties of TiFe0.85−xMn0.15Zrx (x = 0, 0.05, 0.075 and 0.15) alloys with/without prolonged air exposure. x = 0 alloy did not absorb the hydrogen under 2 MPa hydrogen pressure. x = 0.15 alloy showed the highest hydrogen storage capacity during the first hydrogenation process. This should be due to the positive influence of the white phase, which decreased the ionicity and made the interaction between hydrogen and metal weaken.
(3) In the test of prolonged air exposure, increasing the proportion of Zr to Mn elements was helpful for improving the oxidation resistance of TiFe0.85−xMn0.15Zrx (x = 0.05, 0.075 and 0.15) alloys.
(4) The starting particle size had an obvious effect on the first hydrogenation of TiFe0.85−xMn0.15Zrx (x = 0.05, 0.075 and 0.15) alloys. When the length of the starting particle size was around 0.5 cm, x = 0.15 alloy showed the shortest incubation time. This result suggested the big starting particle size had little effect on the alloy with higher proportion of Zr to Mn elements.
(5) The rate limiting step models of the first hydrogenation of TiFe0.85−xMn0.15Zrx (x = 0.05, 0.075 and 0.15) alloys were different. x = 0.05 alloy showed CV3D model. However, x = 0.075 and 0.15 alloys both showed GB3D model. This meant that the change of the proportion of Zr to Mn elements may affect the rate limiting step model.
Conflicts of interest
The authors declare no conflicts of interest.
Acknowledgements
This work is supported by National Natural Science Foundation of China (12205042), Jiangxi Provincial Natural Science Foundation (20202BABL214003) and Jiangxi Province Key Laboratory of Polymer Micro/Nano Manufacturing and Devices (East China University of Technology) (PMND201902).
References
- H. Barthélémy, Int. J. Hydrogen Energy, 2012, 37, 17364–17372 CrossRef.
- O. Faye, J. Szpunar and U. Eduok, Int. J. Hydrogen Energy, 2022, 47, 13771–13802 CrossRef CAS.
- M. R. Usman, Renewable Sustainable Energy Rev., 2022, 167, 112743 CrossRef CAS.
- C. Tarhan and M. A. Çil, J. Energy Storage, 2021, 40, 102676 CrossRef.
- I. A. Hassan, H. S. Ramadan, M. A. Saleh and D. Hissel, Renewable Sustainable Energy Rev., 2021, 149, 111311 CrossRef CAS.
- H. Li, X. Cao, Y. Liu, Y. Shao, Z. Nan, L. Teng, W. Peng and J. Bian, Energy Rep., 2022, 8, 6258–6269 CrossRef.
- H. Q. Nguyen and B. Shabani, Int. J. Hydrogen Energy, 2021, 46, 31699–31726 CrossRef CAS.
- E. M. Dematteis, F. Cuevas and M. Latroche, J. Alloys Compd., 2021, 851, 156075 CrossRef CAS.
- K. Edalati, J. Matsuda, A. Yanagida, E. Akiba and Z. Horita, Int. J. Hydrogen Energy, 2014, 39, 15589–15594 CrossRef CAS.
- H. Emami, K. Edalati, J. Matsuda, E. Akiba and Z. Horita, Acta Mater., 2015, 88, 190–195 CrossRef CAS.
- J. Y. Jung, S.-I. Lee, M. Faisal, H. Kim, Y.-S. Lee, J.-Y. Suh, J.-H. Shim, J.-Y. Huh and Y. W. Cho, Int. J. Hydrogen Energy, 2021, 46, 19478–19485 CrossRef CAS.
- Y. Kobayashi, S. Yamaoka, S. Yamaguchi, N. Hanada, S. Tada and R. Kikuchi, Int. J. Hydrogen Energy, 2021, 46, 22611–22617 CrossRef CAS.
- H. Liu, J. Zhang, P. Sun, C. Zhou, Y. Liu and Z. Z. Fang, J. Energy Storage, 2022, 55, 105543 CrossRef.
- J. Barale, E. M. Dematteis, G. Capurso, B. Neuman, S. Deledda, P. Rizzi, F. Cuevas and M. Baricco, Int. J. Hydrogen Energy, 2022, 47, 29866–29880 CrossRef CAS.
- E. M. Dematteis, D. M. Dreistadt, G. Capurso, J. Jepsen, F. Cuevas and M. Latroche, J. Alloys Compd., 2021, 874, 159925 CrossRef CAS.
- P. Modi, W. Liu and K.-F. Aguey-Zinsou, J. Alloys Compd., 2022, 891, 161943 CrossRef CAS.
- K. B. Park, W.-S. Ko, J. O. Fadonougbo, T.-W. Na, H.-T. Im, J.-Y. Park, J.-W. Kang, H.-S. Kang, C.-S. Park and H.-K. Park, Mater. Charact., 2021, 178, 111246 CrossRef CAS.
- H. Shang, Y. Zhang, Y. Li, Y. Qi, S. Guo and D. Zhao, Renewable Energy, 2019, 135, 1481–1498 CrossRef CAS.
- T. Yang, P. Wang, C. Xia, N. Liu, C. Liang, F. Yin and Q. Li, Int. J. Hydrogen Energy, 2020, 45, 12071–12081 CrossRef CAS.
- P. Jain, C. Gosselin and J. Huot, Int. J. Hydrogen Energy, 2015, 40, 16921–16927 CrossRef CAS.
- J. Manna, B. Tougas and J. Huot, Int. J. Hydrogen Energy, 2020, 45, 11625–11631 CrossRef CAS.
- A. K. Patel, B. Tougas, P. Sharma and J. Huot, J. Mater. Res. Technol., 2019, 8, 5623–5630 CrossRef CAS.
- J. Y. Jung, Y.-S. Lee, J.-Y. Suh, J.-Y. Huh and Y. W. Cho, J. Alloys Compd., 2021, 854, 157263 CrossRef CAS.
- H. Shang, Y. Zhang, Y. Li, J. Gao, W. Zhang, X. Wei, Z. Yuan and L. Ju, J. Alloys Compd., 2022, 890, 161785 CrossRef CAS.
- T. Zhai, Z. Wei, Z. Yuan, Z. Han, D. Feng, H. Wang and Y. Zhang, J. Phys. Chem. Solids, 2021, 157, 110176 CrossRef CAS.
- Y. Zhang, H. Shang, J. Gao, W. Zhang, X. Wei and Z. Yuan, Int. J. Hydrogen Energy, 2021, 46, 24517–24530 CrossRef CAS.
- V. Y. Zadorozhnyy, S. N. Klyamkin, M. Y. Zadorozhnyy, O. V. Bermesheva and S. D. Kaloshkin, J. Alloys Compd., 2014, 586, S56–S60 CrossRef CAS.
- V. Zadorozhnyy, E. Berdonosova, C. Gammer, J. Eckert, M. Zadorozhnyy, A. Bazlov, M. Zheleznyi, S. Kaloshkin and S. Klyamkin, J. Alloys Compd., 2019, 796, 42–46 CrossRef CAS.
- V. Y. Zadorozhnyy, S. N. Klyamkin, M. Yu. Zadorozhnyy, M. V. Gorshenkov and S. D. Kaloshkin, J. Alloys Compd., 2014, 615, S569–S572 CrossRef CAS.
- K. Edalati, J. Matsuda, H. Iwaoka, S. Toh, E. Akiba and Z. Horita, Int. J. Hydrogen Energy, 2013, 38, 4622–4627 CrossRef CAS.
- F. Guo, K. Namba, H. Miyaoka, A. Jain and T. Ichikawa, Mater. Lett.: X, 2021, 9, 100061 CAS.
- L. E. R. Vega, D. R. Leiva, R. M. Leal Neto, W. B. Silva, R. A. Silva, T. T. Ishikawa, C. S. Kiminami and W. J. Botta, Int. J. Hydrogen Energy, 2018, 43, 2913–2918 CrossRef CAS.
- V. Y. Zadorozhnyy, G. S. Milovzorov, S. N. Klyamkin, M. Y. Zadorozhnyy, D. V. Strugova, M. V. Gorshenkov and S. D. Kaloshkin, Prog. Nat. Sci.: Mater. Int., 2017, 27, 149–155 CrossRef CAS.
- V. Kumar, P. Kumar, K. Takahashi and P. Sharma, Int. J. Hydrogen Energy, 2022, 47, 16156–16164 CrossRef CAS.
- A. Zeaiter, P. Nardin, M. A. Pour Yazdi and A. Billard, Mater. Res. Bull., 2019, 112, 132–141 CrossRef CAS.
- P. Lv, M. N. Guzik, S. Sartori and J. Huot, Mater. Res. Technol., 2019, 8, 1828–1834 CrossRef CAS.
- W.-S. Ko, K. B. Park and H.-K. Park, J. mater. sci. technol., 2021, 92, 148–158 CrossRef CAS.
- H. Han, H.-J. Kim, H. Kim, S.-D. Sohn, J.-H. Shim, J.-Y. Suh and H.-J. Shin, Appl. Surf. Sci., 2020, 517, 146163 CrossRef CAS.
- T. Ha, S.-I. Lee, J. Hong, Y.-S. Lee, D.-I. Kim, J.-Y. Suh, Y. W. Cho, B. Hwang, J. Lee and J.-H. Shim, J. Alloys Compd., 2021, 853, 157099 CrossRef CAS.
- P. Lv and J. Huot, Energy, 2017, 138, 375–382 CrossRef CAS.
- K. B. Park, J. O. Fadonougbo, C.-S. Park, J.-H. Lee, T.-W. Na, H.-S. Kang, W.-S. Ko and H.-K. Park, Int. J. Hydrogen Energy, 2021, 46, 30780–30789 CrossRef CAS.
- M. Avrami, J. Chem. Phys., 1941, 9, 177–184 CrossRef CAS.
- M. Avrami, J. Chem. Phys., 1940, 8, 212–224 CrossRef CAS.
- M. Avrami, J. Chem. Phys., 1939, 7, 1103–1112 CrossRef CAS.
- U. Bösenberg, J. W. Kim, D. Gosslar, N. Eigen, T. R. Jensen, J. B. Von Colbe, Y. Zhou, M. Dahms, D. Kim and R. Günther, Acta Mater., 2010, 58, 3381–3389 CrossRef.
- N. Koga and J. M. Criado, J. Am. Ceram. Soc., 1998, 81, 2901–2909 CrossRef CAS.
- N. Koga and J. Criado, J. Therm. Anal., 1997, 49, 1477–1484 CrossRef CAS.
- J. Carstensen, J. Pharm. Sci., 1974, 63, 1–14 CrossRef CAS PubMed.
- J. Crank, The mathematics of diffusion, Oxford University Press, 1979 Search PubMed.
- A. Ginstling and B. Brounshtein, J. appl. chem. USSR, 1950, 23, 1327–1338 CAS.
- Y. Pang and Q. Li, Int. J. Hydrogen Energy, 2016, 41, 18072–18087 CrossRef CAS.
- J. Lang, M. Eagles, M. S. Conradi and J. Huot, J. Alloys Compd., 2014, 583, 116–120 CrossRef CAS.
|
| This journal is © The Royal Society of Chemistry 2023 |
Click here to see how this site uses Cookies. View our privacy policy here.  Open Access Article
 *ab,
Cheng Pengab,
Quanyu Liub,
Changlin Zhonga,
Dongfang Huangb,
Zhichen Liua,
Quanbao Zhou*a and
Ruixue Zhaoa
![[thin space (1/6-em)]](https://www.rsc.org/images/entities/char_2009.gif) :
:![[thin space (1/6-em)]](https://www.rsc.org/images/entities/char_2009.gif) 3, 1
3, 1![[thin space (1/6-em)]](https://www.rsc.org/images/entities/char_2009.gif) :
:![[thin space (1/6-em)]](https://www.rsc.org/images/entities/char_2009.gif) 2 and 1
2 and 1![[thin space (1/6-em)]](https://www.rsc.org/images/entities/char_2009.gif) :
:![[thin space (1/6-em)]](https://www.rsc.org/images/entities/char_2009.gif) 1) of Zr to Mn elements on the hydrogen storage properties of TiFe0.85−xMn0.15Zrx (x = 0, 0.05, 0.075 and 0.15) alloys was systematically studied in this work. The results showed that all alloys mainly showed TiFe and MgZn2 type phases. The MgZn2 type phase went up with the proportion of Zr to Mn elements. At the same time, increasing the proportion of Zr to Mn elements enhanced the first hydrogenation properties. In addition, the x = 0.15 alloy showed the highest hydrogen storage capacity during the first hydrogenation process. This was because the MgZn2 type phase could improve the penetration of hydrogen atoms and enhance the diffusion of hydrogen atoms. During the test of prolonged air exposure, it was clear that the oxidation resistance also increased with the proportion of Zr to Mn elements. In addition to this, the effect of the starting particle size was also studied. When the length of the starting particle size was around 0.5 cm, the x = 0.05 alloy did not absorb any hydrogen within 1500 seconds. However, the x = 0.15 alloy could be activated in only around 100 seconds. Finally, the rate limiting step of the first hydrogenation and PCT properties were also investigated.
1) of Zr to Mn elements on the hydrogen storage properties of TiFe0.85−xMn0.15Zrx (x = 0, 0.05, 0.075 and 0.15) alloys was systematically studied in this work. The results showed that all alloys mainly showed TiFe and MgZn2 type phases. The MgZn2 type phase went up with the proportion of Zr to Mn elements. At the same time, increasing the proportion of Zr to Mn elements enhanced the first hydrogenation properties. In addition, the x = 0.15 alloy showed the highest hydrogen storage capacity during the first hydrogenation process. This was because the MgZn2 type phase could improve the penetration of hydrogen atoms and enhance the diffusion of hydrogen atoms. During the test of prolonged air exposure, it was clear that the oxidation resistance also increased with the proportion of Zr to Mn elements. In addition to this, the effect of the starting particle size was also studied. When the length of the starting particle size was around 0.5 cm, the x = 0.05 alloy did not absorb any hydrogen within 1500 seconds. However, the x = 0.15 alloy could be activated in only around 100 seconds. Finally, the rate limiting step of the first hydrogenation and PCT properties were also investigated.![[thin space (1/6-em)]](https://www.rsc.org/images/entities/char_2009.gif) :
:![[thin space (1/6-em)]](https://www.rsc.org/images/entities/char_2009.gif) 3, 1
3, 1![[thin space (1/6-em)]](https://www.rsc.org/images/entities/char_2009.gif) :
:![[thin space (1/6-em)]](https://www.rsc.org/images/entities/char_2009.gif) 2 and 1
2 and 1![[thin space (1/6-em)]](https://www.rsc.org/images/entities/char_2009.gif) :
:![[thin space (1/6-em)]](https://www.rsc.org/images/entities/char_2009.gif) 1, respectively. During the process of arc melting, we weighed the exact mass of the metal firstly and put them in a copper crucible. Then we began to melt the alloy and inverted the alloy three or four times to achieve a homogeneous composition. For the ordinary measurement, we smashed the alloy into powder and loaded the powder in the sample holder in air in a very short time (<2 minutes). For a test of prolonged air exposure, we crushed the alloy into powder in air and put the powder in an open plastic tube for different air exposure time (2 and 24 hours). The process of preparing TiFe0.85−xMn0.15Zrx (x = 0, 0.05, 0.075 and 0.15) alloys after different air exposure time was shown in Fig. 1.
1, respectively. During the process of arc melting, we weighed the exact mass of the metal firstly and put them in a copper crucible. Then we began to melt the alloy and inverted the alloy three or four times to achieve a homogeneous composition. For the ordinary measurement, we smashed the alloy into powder and loaded the powder in the sample holder in air in a very short time (<2 minutes). For a test of prolonged air exposure, we crushed the alloy into powder in air and put the powder in an open plastic tube for different air exposure time (2 and 24 hours). The process of preparing TiFe0.85−xMn0.15Zrx (x = 0, 0.05, 0.075 and 0.15) alloys after different air exposure time was shown in Fig. 1.


![[3 with combining macron]](https://www.rsc.org/images/entities/char_0033_0304.gif) m (221)) and MgZn2 type phases (P63/mmc (194)). The TiFe phase should correspond to the grey phase. The MgZn2 type phase should correspond to the white phase. For the minor black phase, it should be β-Ti phase. However, the peaks of β-Ti phase were too weak to be found in XRD patterns in Fig. 5. It was very clear that the different proportions of Zr to Mn elements did not change the crystal structure of all alloys. This result agreed with previous studies.15,38
m (221)) and MgZn2 type phases (P63/mmc (194)). The TiFe phase should correspond to the grey phase. The MgZn2 type phase should correspond to the white phase. For the minor black phase, it should be β-Ti phase. However, the peaks of β-Ti phase were too weak to be found in XRD patterns in Fig. 5. It was very clear that the different proportions of Zr to Mn elements did not change the crystal structure of all alloys. This result agreed with previous studies.15,38


