DOI:
10.1039/D3RA01230A
(Paper)
RSC Adv., 2023,
13, 12634-12645
The supercapattery designed with a binary composite of niobium silver sulfide (NbAg2S) and activated carbon for enhanced electrochemical performance†
Received
23rd February 2023
, Accepted 17th April 2023
First published on 24th April 2023
Abstract
A supercapattery is a hybrid device that is a combination of a battery and a capacitor. Niobium sulfide (NbS), silver sulfide (Ag2S), and niobium silver sulfide (NbAg2S) were synthesized by a simple hydrothermal method. NbAg2S (50/50 wt% ratio) had a specific capacity of 654 C g−1, which was higher than the combined specific capacities of NbS (440 C g−1) and Ag2S (232 C g−1), as determined by the electrochemical investigation of a three-cell assembly. Activated carbon and NbAg2S were combined to develop the asymmetric device (NbAg2S//AC). A maximum specific capacity of 142 C g−1 was delivered by the supercapattery (NbAg2S//AC). The supercapattery (NbAg2S/AC) provided 43.06 W h kg−1 energy density while retaining 750 W kg−1 power density. The stability of the NbAg2S//AC device was evaluated by subjecting it to 5000 cycles. After 5000 cycles, the (NbAg2S/AC) device still had 93% of its initial capacity. This research indicates that merging NbS and Ag2S (50/50 wt% ratio) may be the best choice for future energy storage technologies.
1. Introduction
The requirement for energy is increasing rapidly due to the increasing population with each passing day.1 The energy produced by traditional methods can no longer meet the energy needs of modern society, so that is why new methods are being developed to generate and implements energy.2–4 Energy storage devices are essential along with renewable energy resources for the continuous supply of energy. Traditional energy storage devices include batteries and capacitors. Supercapacitors (SCs) are an intermediate point between capacitors and conventional batteries.5,6 The energy densities of Li-ion batteries (LIBs) reached 150 to 200 W h kg−1,7,8 which are significantly higher compared to other battery types, such as Ni–Cd9,10 Ni–MH,9 and lead batteries.9 Applications for electric vehicles are now feasible thanks to SCs with high power densities, longer life cycles, and fast charging.11 SCs are cheaper than batteries and provide good power with a moderate energy density.12–14 The SCs are considered a main electrical energy storage EES because of their good energy and power densities.10,11,15–18 According to their storing method, SCs are further divided into PCs (pseudo capacitors) and EDLCs (electric double-layer capacitors). Metal sulfide and conductive polymers are the most frequently used for PCs because of their electrochemical properties.19–21 Owing to a shortage of energy production, electrical energy storage systems are being modified to meet energy requirements. This issue was solved by combining the characteristics of batteries and supercapacitors in a single hybrid device.22 Supercapatteries are hybrid devices that utilize both a capacitive electrode and a battery electrode.23 Compared to the present LIBs, supercapacitors, and supercapatteries have shown a reasonable potential for energy and power density.11 Supercapatteries have a substantially greater energy density than supercapacitors.24–27 Layered and non-layered sulfides are the two primary groups into which the metal sulfides (MSs) can be separated. Non-layered metal sulfide MSs with high theoretical capacities are FeS2, NiS2, CoS2, and MnS. They are also commonly accessible, cost-effective, and environmentally friendly.28–30 Covalent bonds in semi-metal sulfides join the layers to form the layered MSs, including MoS2, WS2, SnS2, VS2, and many others.31–36 Changing morphologies, sizes, structures, and compositions makes it possible to change the electrochemical properties of MSs.37,38 Layered transition metal dichalcogenides (TMDs) with the structural formula MX2 have gained a lot of attention due to their huge potential for energy storage applications.39 In MX2, X stands for Se, Te, S, and M denotes transition metal element.40 Because of its excellent electrical conductivity, higher specific capacity, and long cycle life, NbS has become more popular as an anode material.41 Liao et al. studied the use of Nb oxides for advanced hybrid capacitors. But still, there is a lot of work needed on Nb-based electrode material for SCs.42 Niobium (Nb)-based materials have incredible potential for use in supercapacitors (SCs). However, the conductivity of niobium may be successfully increased by merging Nb with two metals. Niobium sulfide has excellent flexibility, hardness, electrical conductivity, long cycle life, high energy storage capacity, and extraordinary electrochemical properties.43 Silver sulfide (Ag2S) nanomaterial is commonly utilized in batteries, thermoelectric sensors, infrared finders, photovoltaic cells, and conductors.44 The ellipsoidal-shaped Ag2S nano crystals size range lies from 5 to 20 nm.45 According to Pawar et al., Ag2S had a high specific capacity, greater chemical and electrical conductivity, and is naturally abundant.46,47
In this work, we successfully synthesized niobium silver sulfide (NbAg2S) nanoparticles using a hydrothermal technique. The surface morphology and structural analysis of NbAg2S were measured with a scanning electron-microscope (SEM) and X-ray diffraction (XRD). The NbAg2S was electrochemically evaluated using cyclic voltammetry (CV), electrochemical-impedance-spectroscopy (EIS), and galvanostatic charge–discharge (GCD). The electrolyte used for testing was 1 M KOH. In addition, the NbAg2S and activated carbon were combined to develop the supercapattery. The stability experiments were also performed to examine the coulombic efficiency and capacity retention of the NbAg2S//AC device after 5000 cycles.
2. Experimental section
2.1. Materials
The subsequent materials were bought from Sigma Aldrich: carbon black (CB), niobium nitrate (Nb(NO3)5), KOH pellets, silver nitrate (AgNO3), hydrochloric acid (HCl), activated carbon, sodium sulfide hydrate (Na2S·9H2O) and niobium nitrate (Nb(NO3)5). The chemicals were bought in their purest form and weren't further purified before use. Deionized water (DIW) was used to make solutions, wash samples, and prepare electrolytes. The reference electrodes (Hg/HgO), nickel foam, and platinum wire were imported from Japan.
2.2. Material synthesis
Niobium sulfide was first made using a hydrothermal technique. The hydrothermal method was chosen because of its ease and simplicity.47 0.8 M (2.32 g) of Nb(NO3)5 and 0.8 M (0.6243 g) of Na2S·9H2O were dissolved in 10 ml of DIW to synthesize NbS. Na2S solution was added to the niobium nitrate solution and placed on a hot magnetic stirrer. After 40 min of continuous stirring, the prepared solution was put into an autoclave. It was then placed in a furnace at 160 °C for 8 h. To remove the impurities, solutions were washed several times with DIW and ethanol. After complete washing, the prepared material was transferred to the dry dish and placed inside the oven to dry at 60 °C for 3 h. After completely following the above procedure, the material was finally grinded with the use of a hand grinder and collected inside the dry bottle, and collected at room temperature.
The silver sulfide nanoparticles were made using the previously mentioned procedures. Similarly, we prepared 0.8 M of sodium sulfide hydrate (0.6243 g) and silver nitrate (1.6987 g) solution in 10 ml of DIW to make silver sulfide. The sodium sulfide hydrate (Na2S·9H2O) solution was transferred to the silver sulfide solution (AgNO3). The combined solution was continuously stirred for 60 min. The addition of Na2S·9H2O into AgNO3 turned the white solution black. The complete ready solution was then put into a 100 ml autoclave and was heated at 160 °C for 8 h before being permitted to cool at room temperature.
Niobium silver sulfide (50/50 wt% ratio) was formed similarly by making three different solutions. First, a 0.4 M (0.849 g) solution of silver nitrate was produced in 10 ml of DIW. 0.4 M (1.08 g) of niobium nitrate was used to make solution 2, while 0.8 M (0.6243 g) of sodium sulfide was used to make solution 3. Silver nitrate solution was placed on a hot plate, and the other two solutions were mixed drop by drop. Then, the procedure outlined above is completed to synthesize niobium silver sulfide. The illustration of synthesizing NbAg2S through a hydrothermal process was displayed in Fig. 1.
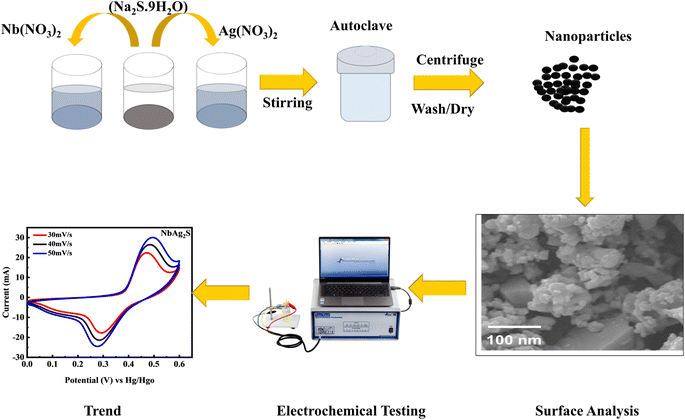 |
| | Fig. 1 Systematic illustration of the hydrothermal process and electrochemical testing. | |
2.3. Electrochemical measurement
Using cyclic voltammetry (CV), galvanostatic charge–discharge (GCD), and electrochemical impedance spectroscopy (EIS), the performance of NbS, Ag2S, and NbAg2S was analyzed. The active material was first deposited on nickel foam (NF) and used as the working electrode. The counter electrode was platinum wire, and the reference electrode was Hg/HgO. A 1 M KOH solution was provided as the electrolyte during the entire electrochemical tests and was kept in a standard cell at room temperature. The slurry was made with 15% ethylene black, 75% active material, and 10% PVDF binder. A homogeneous solution was prepared by continuously stirring for 6 h. It was then coated onto the NF. The NF was washed with HCl, ethanol, and DIW for further testing. The active substance was applied to a 1 × 1 cm2 area of NF. For NbS, Ag2S, and AgNb2S, the total weight of the active material transferred onto NF was close to 5–7 mg.
Further, binary composite (NbAg2S) and activated carbon were used as positive and negative electrodes for the supercapattery application. In the two-electrode assembly, 10 mg of active mass is transferred onto the NF. To reduce the NF effect, the AC was carefully coated on both sides of NF. The capacity from CV and GCD curves were measured for NbS, Ag2S, and NbAg2S. The current density was maintained between 0.8 and 2.0 A g−1. Additionally, the stability of this hybrid device was tested at room temperature using rapid test methods. With the help of the following equation, the specific capacity via CV curves for NbS, Ag2S, and NbAg2S was determined.48–50
| |
 | (1) |
The area is represented by  , the active mass is m, and the scanning speed is v. The equation below can be applied to measure the capacity through GCD.51
| |
 | (2) |
The discharge time is indicated by “t” and the current is denoted by “I.”
The following equations determined energy and power density for NbS, Ag2S, and NbAg2S.51
| |
 | (3) |
| |
 | (4) |
E shows energy density,
Q represents capacity, the operating potential is indicated by
V,
t is the discharge time, and
P is the power density.
3. Results and discussion
3.1. X-ray diffraction analysis
To study the crystallinity, X-ray diffraction (XRD) was used. Fig. 2(a) indicates the XRD pattern for NbS, Ag2S, and NbAg2S. Scherer's equation was used to determine the size of the crystallite| |
 | (5) |
In this equation D means the crystallite size, λ is the wavelength, and β is the full-width half maxima. The typical size for Ag2S was 20 nm, NbS was 23 nm, and NbAg2S was 26 nm from XRD data. The XRD pattern for Ag2S displays peaks related to (101), (−111), (112), (−121), (121), (031), (200), (210), (−212), (−213), (−223) and (−134), planes which match with the JCPDF-014-0072-Ag2S.52 The planes are centered at 2θ = 26.3°, 30.1°, 31.04°, 34.6°, 36.7°, 37.8°, 40.7°, 43.6°, 48.6°, 53.2°, and 57.9°, respectively. The peaks for NbS were related to (002), (100), (110), and (200) planes, matched with JCPDF-01-089-5008.53 The NbAg2S was also analyzed using the XRD. The XRD pattern for NbAg2S matches with the NbS and Ag2S XRD spikes confirming the successful formation of NbAg2S.45,54
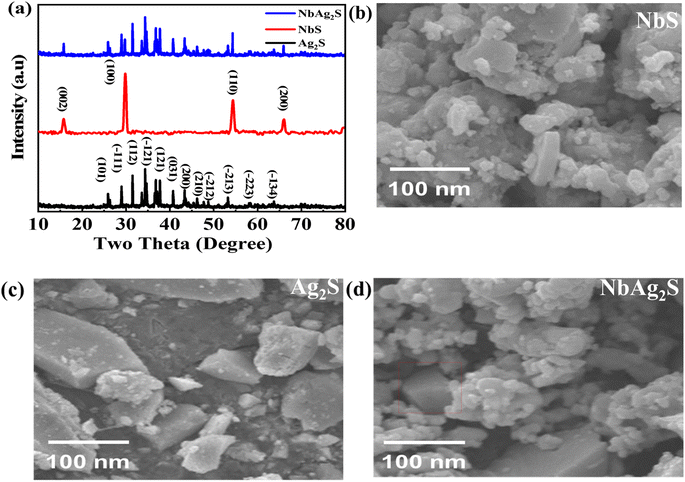 |
| | Fig. 2 (a) XRD pattern for Ag2S, NbS, and Ag2NbS. (b–d) SEM images for NbS, Ag2S, and NbAg2S, respectively. | |
3.2. Scanning electron microscope (SEM)
The morphological characteristics of NbS, Ag2S, and NbAg2S were analyzed using scanning electron microscopy (SEM). Fig. 2(b) displayed the SEM image of NbS2; Fig. 2(c) presented the SEM image of Ag2S, and Fig. 2(d) presented the SEM image of NbAg2S. As can be observed from these images both Ag2S and NbS consisted of small nanoparticles. The morphology NbS and Ag2S indicated the crystalline structure. Above their crystalline structure, some amorphous structure was found. This was due to the presence of sulfide ions. Pure metals like Nb and Ag showed crystalline form while the sulfur developed on the surface of these metals as observed from the SEM images is responsible for their amorphous nature. The amorphous structure was able to store more charge as compared to crystalline. The morphology of NbAg2S was shown in Fig. 2(d), showing a matrix composite with numerous active sites. Thus electrical conductivity and specific capacity of this NbAg2S were improved.
3.3. XPS analysis
By using X-ray photoelectron spectroscopy, the valence state of Ag, Nb, and S in the composite sample was calculated, as shown in Fig. 3(a–c). The XPS spectra for Ag in Fig. 3(a) revealed two unique peaks with a 5 eV gap between them. Ag 3d5/2 appeared at 367.5 eV and the Ag 3d3/2 appeared at 372.5 eV, both of which match with Ag+ as reported earlier.55 To Nb 3d levels have binding energies (BE) that range from 208 eV for Nb 3d3/2 to 212 eV for Nb 3d5/2 as indicated Fig. 3(b) The spin–orbit splitting energy of 4 eV and the BE numbers are consistent with the Nb5+ state.56 The XPS spectra for S 2p was represented in Fig. 3(c). Peaks at 162.5 and 168.5 eV appeared which belong to S 2p1/2 and S 2p3/2.57
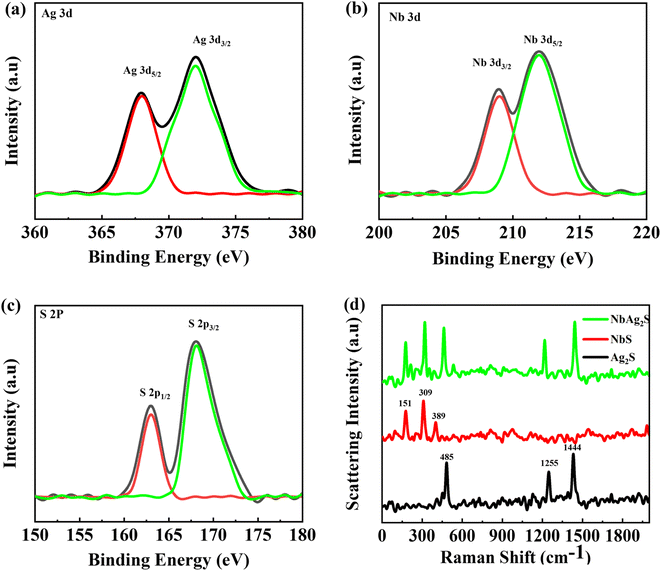 |
| | Fig. 3 (a–c) XPS spectrum for Ag 3d, Nb 3d, and S 2p, respectively. (d) Raman spectrometry for Ag2S, NbS, and NbAg2S. | |
3.4. Raman spectrometry
The Raman spectroscopy results for Ag2S, NbS, and NbAg2S nanopowder were recorded using an optimal laser stimulation power of 40 mW (Fig. 3(d)). The high stimulation power resulted in elevated spectral intensity but also caused the photoinduced breakdown of silver sulfide, which caused the emergence of a very strong peak at 1444 cm−1 and strong peaks at 485 and 1255 cm−1. Strong peaks at 485, 1255, and 1444 cm−1 are caused by vibrations of sulphur oxide molecules and silver metals created by the photoinduced breakdown of Ag2S.58 There are three peaks observed from the Raman spectrum of niobium sulfide. The peak appeared at 151 cm−1 was may due to some defects.59 The two peaks at 309 and 389 cm−1 corresponds to the niobium sulfide structure.60
3.5. EIS and BET measurements
Electrochemical impedance spectroscopy (EIS) uses a wide range of AC frequencies. It determines the electrical resistance (impedance) of the metal/solution interface over a broad frequency series (from 1 MHz to 10 KHz). The well-established quantitative method known as electrochemical impedance spectroscopy can be applied properly to evaluate the anti-corrosion efficiency of protective coatings (EIS). EIS is a valuable tool for investigating the interfacial properties of bio-recognition processes at the electrode surface. EIS data are frequently assessed by fitting to an identical electrical circuit model. EIS is one of the most popular analytical techniques.61–66 A unique electrochemical impedance spectroscopy (EIS) analysis based on evolutionary programming has been used to look at the processes that govern the operation of supercapacitors and their decomposition procedures.67 The EIS graph for NbS, Ag2S, and NbAg2S was represented in Fig. 4(a–c). The EDLC and faradaic behavior can be observed from the straight line along with the small semicircle. The ESR was also calculated from the EIS graph for NbS, Ag2S, and NbAg2S. The ESR for NbAg2S was 1.04 U, less than NbS (1.13 U) and Ag2S (1.18 U).
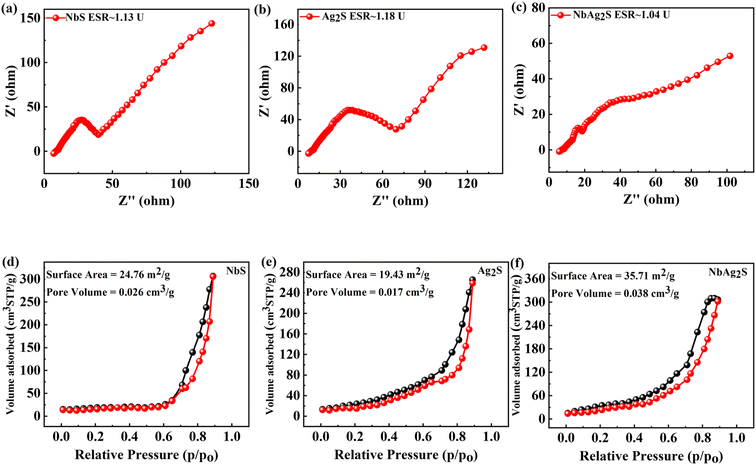 |
| | Fig. 4 (a–c) EIS calculation for NbS, Ag2S, and NbAg2S, respectively. (d–f) BET calculation for NbS, Ag2S, and NbAg2S, respectively. | |
An analytical method called Brunauer–Emmett–Teller (BET) was used to investigate pour volume and surface area for pure solid materials. In this technique, an inert gas, like nitrogen, is adsorbed onto the solid surface of the sample. The physical adsorption of gas molecules on a pure solid surface is the fundamental basis of an important analytical technique for figuring out the specific surface area of materials. All material was outgassed at 100 °C for 7 h in a vacuum before measurements were taken.68,69 Using the BET method, the surface area of NbS, Ag2S, and NbAg2S was calculated and represented in Fig. 4(d–f). BET surface area of the NbS, Ag2S, and NbAg2S was 24.76, 19.43, and 35.71 m2 g−1, respectively. The porous surface morphologies were useful for energy storage applications because their extensive pore channels enable quick electrolyte transport, and small holes provide more active sites for chemical reactions.70,71 According to Brousse et al., who synthesized corresponding mixtures and amorphous ones, BET analysis and water content have no further impact on capacitance.74
On the other hand, the capacitance of the Nb-derived sample is unaffected by the increase in BET surface area. Additionally, after the proton exchange operation, the capacitance in the case of NbAg2S decreases, raising the BET value. These results showed that the element shape and size determine the capacitance in addition to the BET surface area and the type of the examined part. This outcome aligns with the general findings of Toupin et al.73 Going to prove that in pseudo-capacitive phenomena related to faradaic reactions, the microstructure significantly impacts capacitance levels.72,74 Fig. 3(d–f) indicates the BET graph for NbS, Ag2S, and NbAg2S. Table 1 lists the average pore diameters, specific surface areas, and pore volumes of NbS, Ag2S, and NbAg2S determined by BET measurements. The experiments used composite electrodes, demonstrating a significant difference between the samples.75
Table 1 Specific parameters calculated through BET measurements for NbS, Ag2S, and NbAg2S
| Materials |
Surface area (m2 g−1) |
Pore size (nm) |
Pore volume (cm3 g−1) |
| NbS |
24.76 |
0.23 |
0.026 |
| Ag2S |
19.43 |
0.18 |
0.017 |
| NbAg2S |
35.71 |
0.23 |
0.038 |
3.6. Electrochemical results
The electrochemical results of NbS, Ag2S, and NbAg2S were first calculated with the use of a three-electrode assembly. At various scan rates, CV measurements for all prepared materials (NbS, Ag2S, and NbAg2S) were taken in a 1 M KOH electrolyte at an OP of (0–0.6 V). Fig. 5 displays the CV measurements of NbS, Ag2S, and NbAg2S. The CV measurements describe the storage mechanism in materials. The CV curves for NbS, Ag2S, and NbAg2S had nonrectangular shapes that indicate faradaic nature. The faradaic behavior was evidence of the battery-type attitude of NbS, Ag2S, and NbAg2S. Additionally, the redox peaks increase with the rise in scan rate, further proving the battery-like behavior of NbS, Ag2S, and NbAg2S. Redox peaks become wider as the scan rate increases.76–78 NbS had a capacity of 394.4 C g−1 when calculated through CV using equation no 1, while Ag2S had a capacity of 206 C g−1 at 3 mV s−1. The NbS and Ag2S are combined to improve overall performance. NbAg2S, the final product, had a maximum capacity of 645 C g−1. Fig. 5(a–c) displays the CV results for NbS, Ag2S, and NbAg2S at different scan rates ranging from 3 to 50 mV s−1. The synergistic effect of NbS and Ag2S, fast movement of ions, and increased surface area result in increased specific capacity of NbSAg2S. Fig. 5(d) compares CV curves for NbS, Ag2S, and NbAg2S at 3 mV s−1. The combination of NbS and Ag2S increases conductivity and surface area, two important properties for electrochemical measurements. The area under the curve improves as the scan rate increases due to a reduction in the charging/discharging time.51,79,80 For NbS, Ag2S, and NbAg2S, the calculated specific capacitance Cs were 657.5, 343.33, and 1075 F g−1, respectively. Increased surface area and higher electric conductivity may be due to the synergetic impact of combined NbS and Ag2S. The increased electrochemical performance of NbAg2S may be because of the quick exchanges of ions from the electrolyte to the surface.81,82 Eqn (2) was applied to estimate the capacity for NbS, Ag2S, and NbAg2S through GCD curves using discharge time. In contrast to the individual NbS and Ag2S, the combined NbAg2S discharge time was 654 s at 1.0 A g−1, which is long, as indicated in Fig. 6(c). The GCD profiles of NbS, Ag2S, and NbAg2S indicate little deviation from EDLC triangular behavior, which attributes to battery-like attitude. The charging/discharging time decreases as the current density increases. This was due to ions–electrons interaction increases due to higher excitation. The discharge duration for NbS was 440 s at 1.0 A g−1, and for Ag2S was 232 s at 1.0 A g−1, as represented in Fig. 6(a and b). The specific capacities for NbS, Ag2S, and NbAg2S were estimated from the GCD profiles, and the results displayed that the specific capacities of single NbS and Ag2S were lower than NbAg2S. NbS had a maximum specific capacity of 440 C g−1 and a current density of 1.0 A g−1. Fig. 6(d) indicates the comparative GCD plot of NbS, Ag2S, and NbAg2S at 1.0 A g−1. The specific capacity for Ag2S was 232 C g−1 at 1.0 A g−1. The specific capacity of NbAg2S composite material was 654 C g−1 at 1.0 A g−1. The specific capacitance was also measured from GCD graphs. For NbS, Ag2S, and NbAg2S, the measured capacitance values were 733.33, 386.66, and 1090 F g−1 at 1.0 A g−1, respectively. The composite of niobium and silver was the finest material among all, with a specific capacity of 654 C g−1 in GCD measurements. This implies that, in contrast to individual Ag2S and NbS, combined NbAg2S was more active and, as a result, the movement of ions and electrons is much simpler. The increased surface area and improved conductivity of NbAg2S were also linked to more active spots. The specific capacity and capacitance for NbS, Ag2S, and NbAg2S were shown in Fig. 7. The large surface area, number of active sites, exposed ion transfer region, less recombination, and small size of particles were responsible for the enhanced performance of NbAg2S.51 This NbAg2S candidate, therefore, has tremendous potential for supercapacitor applications.
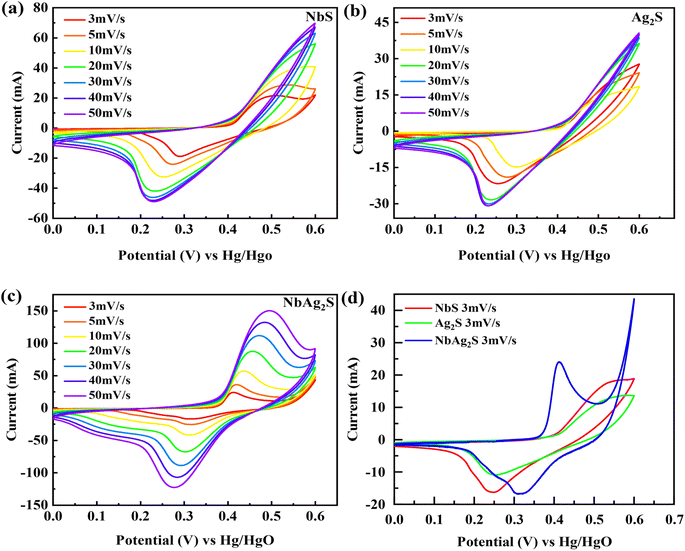 |
| | Fig. 5 (a–c) Represents CV graphs for NbS, Ag2S, and NbAg2S, respectively. (d) CV comparison for NbS, Ag2S, and NbAg2S at 3 mV s−1. | |
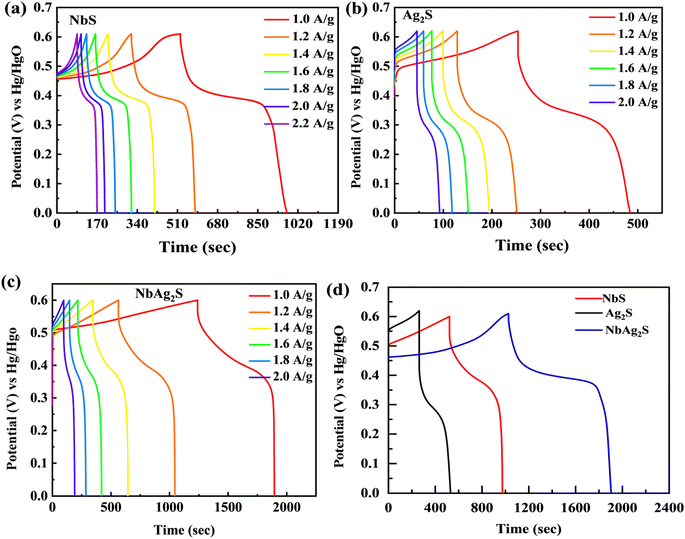 |
| | Fig. 6 (a–c) Represents GCD graphs for NbS, Ag2S, and NbAg2S, respectively. (d) GCD comparison for NbS, Ag2S, and NbAg2S at 1.0 A g−1. | |
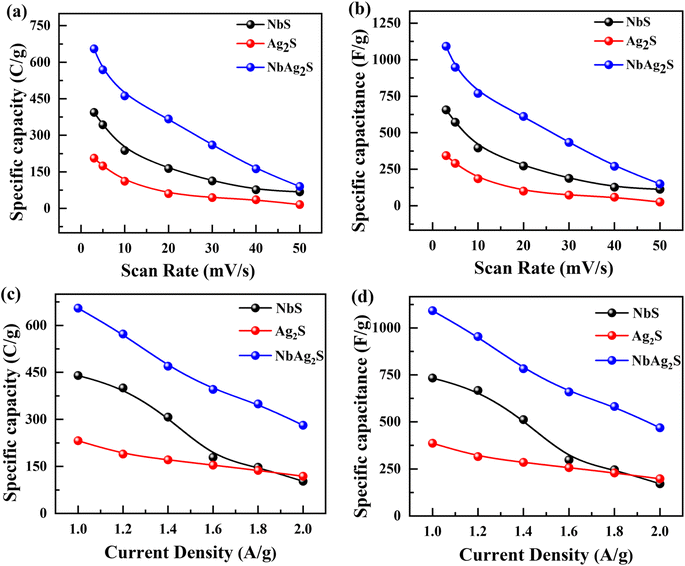 |
| | Fig. 7 (a and b) Specific capacity and capacitance for NbS, Ag2S, and NbAg2S through CV graphs. (c and d) Specific capacity and capacitance for NbS, Ag2S, and NbAg2S through GCD graphs. | |
3.7. Two electrode assembly
The best material (NbAg2S) was selected for two-cell operation with activated carbon (AC) to develop supercapattery. An asymmetric device was developed with (AC) as the negative electrode and NbAg2S as the positive electrode, as displayed in Fig. 8(a). The CV measurements for AC and NbAg2S were performed separately using a three-electrode assembly, as shown in Fig. 8(b). The CV and GCD calculations for the NbAg2S//AC device were indicated in Fig. 8(c and d).
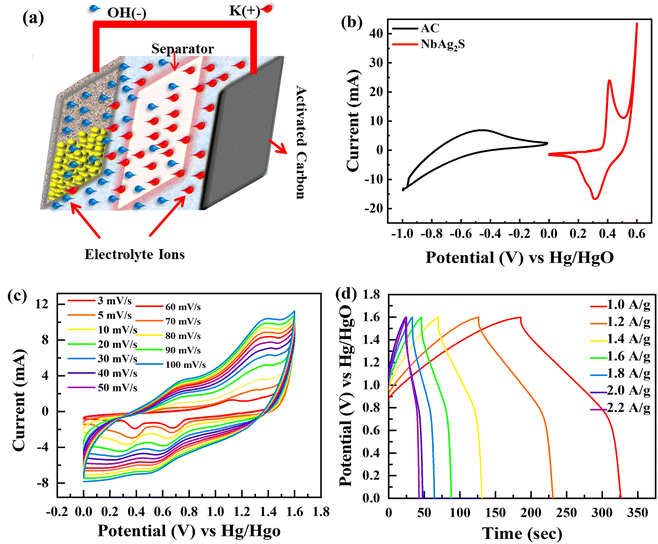 |
| | Fig. 8 (a) Systematic image of NbAg2S//AC supercapattery. (b) CV comparison of AC and NbAg2S. (c) CV curves for NbAg2S//AC supercapattery at different scans. (d) GCD curves for NbAg2S//AC supercapattery at different scan rates. | |
Supercapacitors should operate at a large operating potential (OP) to achieve maximum energy density. Fig. 8(c) represents the CV measurements for NbAg2S//AC in a two-electrode assembly at various scan rates between 3–100 mV s−1 in a 1 M solution of KOH. The OP for NbAg2S//AC supercapattery was 0–1.6 V due to the combined OP of AC (−1 to 0 V) and NbAg2S (0–0.6 V). The rectangular form of CV graphs was evidence of the capacitive nature of AC. The virtually rectangular form of CV profiles for NbAg2S//AC device at 0–0.5 V potential indicates a capacitive attitude. Little redox peaks that indicated faradaic reactions appeared at the potential from 0.5 V to 1.6 V. At higher scans, the CV form does not alter, demonstrating the overall stability and higher rate capability of the NbAg2S//AC device. Similarly, GCD was carried out in an electrolyte of 1 M KOH with OP of 0 V to 1.6 V. The results of the GCD calculations were displayed in Fig. 8(d). The almost triangular shapes of the GCD curves with the small highland region support our assumption of the formation of supercapattery. The GCD curves indicate the EDLC and pseudo-capacitive behavior. The specific capacity of the NbAg2S//AC hybrid device was also determined from CV and GCD, as indicated in Fig. 9(a and b). The capacity of the NbAg2S//AC hybrid device calculated from CV was 112.8 C g−1, while 142 C g−1 from GCD. When the current density reached 2 A g−1, the capacity reduces to 25.06 C g−1. This device was offered for 5000 charging/discharging cycles for a supercapattery lifecycle test. Fig. 9(c and d) indicates stability performance after 5000 cycles. The charge/discharge time was shown in Fig. 9(c) against 5000 cycles. The blue curve in Fig. 9(d) depicts the capacity retention of this device after 5000 cycles, which is still 93%. While the red curve in Fig. 9(d) indicates that coulombic efficiency which was 96.35% after 5000 cycles. The b-fitting was also computed to support our hypothesis of supercapattery development. The charge storage in the NbAg2S//AC device was essentially determined using b values. Fig. 10(a) displays the estimated b-values of the NbAg2S//AC device at several potentials. The b-values range for a battery lies between 0–0.5, while that of a supercapacitor was 0.8–1.0, and that of a supercapattery was between 0.5–0.8.79 The calculated b-values, therefore, fall within the range of supercapattery, as shown in Fig. 10(a). Thus the storage mechanism in the NbAg2S//AC device was a fusion of both capacitive and faradaic reactions. Eqn (3) and (4) were used to calculate energy and power densities. At 1.0 A g−1 current density, the supercapattery (NbAg2S//AC) delivers 43.06 W h kg−1 energy while upholding a power density of 750 W kg−1. Fig. 10(b) compares the energy density to the previously reported work. Table 2 represented the comparison of this work with previous reports. We also calculated the capacitive and diffusive part in the ESI portion (Fig. S1†).
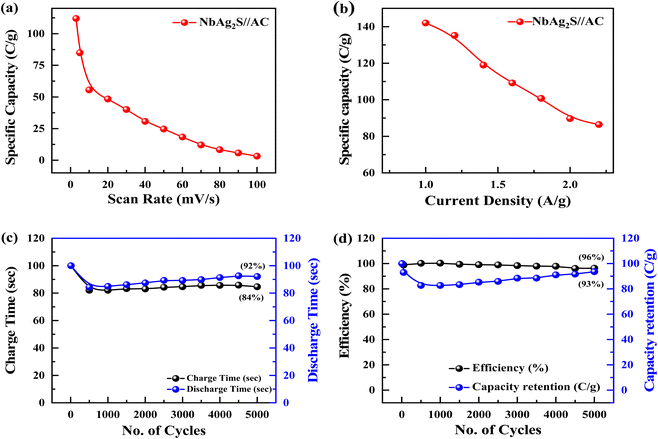 |
| | Fig. 9 (a and b) Specific capacity of NbAg2S//AC supercapattery through CV and GCD. (c and d) Charge/Discharge time and coulombic efficiency/capacity retention measured for NbAg2S//AC supercapattery after 5000 cycles. | |
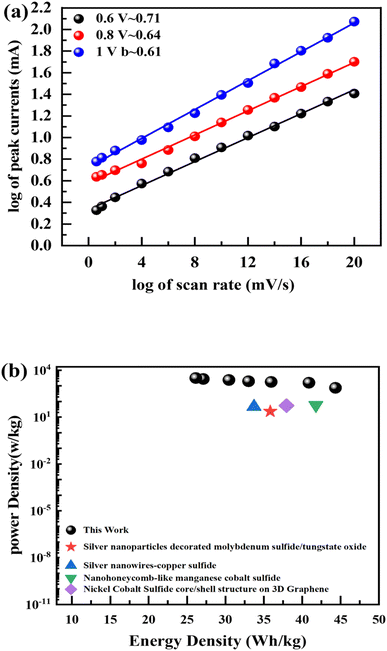 |
| | Fig. 10 (a) b-Fitting computed for NbAg2S//AC supercapattery. (b) Energy density and power density computed for NbAg2S//AC supercapattery. | |
Table 2 Represents the comparison of Ed and Pd of NbAg2S//AC supercapattery with past work
| Energy density (W h kg−1) |
Power density (W kg−1) |
Previous study |
| 10.01 |
520 |
AgCuS core/shell83 |
| 18.4 |
254.5 |
Ni–Co–S nano-sheets84 |
| 28.22 |
596 |
2D vanadium disulfide/black phosphorus hybrids85 |
| 25.71 |
8.73 |
CoZnS/Cu2O3 nanoarrays86 |
| 25.71 |
8.73 |
Cobalt zinc sulfide/copper oxide nanoarrays86 |
| 19.63 |
340 |
Ag–MoS/WS2 (ref. 87) |
| 43.06 |
750 |
This work |
The combination of NbS and Ag2S had a 50/50 weight ratio (NbAg2S) offering good potential for future applications in (ESD) energy storage devices.
4. Conclusion
The hydrothermal technique was used in this study to synthesize NbS, Ag2S, and NbAg2S for supercapattery applications. SEM and XRD were used to study the physical structure and surface morphology of the NbS, Ag2S, and NbAg2S. The NbAg2S showed higher values of the specific capacity as compared to NiS and Ag2S due to greater surface area and high electronic mobility. The composite NbAg2S had a capacity of 654 C g−1 at 1.0 A g−1 current. The NbAg2S was also used as anode material in a supercapattery (NbAg2S//AC). The capacity of 142 C g−1 at 1.0 A g−1 was achieved in a two-electrode assembly for the NbAg2S//AC device. The supercapattery NbAg2S//AC provided an energy density of 43.06 W h kg−1 at 750 W kg−1 power. After 5000 cycles of charging and discharging, the coulombic efficiency of the NbAg2S//AC hybrid device was 96%. The NbAg2S as an electrode material for asymmetric devices will perform better in the future.
Conflicts of interest
There are no conflicts to declare.
Acknowledgements
The authors are grateful to the Researchers Supporting Project Number (RSP2023R448), King Saud University, Riyadh, Saudi Arabia.
References
- G. Quartey and S. K. Adzimah, J. Exp. Theor. Phys., 2014, 4, 19 Search PubMed.
- Y. Zhang, J. Wei, Y. Zhu and G. George-Ufot, J. Cleaner Prod., 2020, 263, 121584 CrossRef.
- J. P. Sidhu, W. Ahmed, W. Gernjak, R. Aryal, D. McCarthy, A. Palmer, P. Kolotelo and S. Toze, Sci. Total Environ., 2013, 463, 488–496 CrossRef PubMed.
- S. Saint Akadiri, A. A. Alola, G. Olasehinde-Williams and M. U. Etokakpan, Sci. Total Environ., 2020, 708, 134653 CrossRef CAS PubMed.
- L. L. Zhang and X. Zhao, Chem. Soc. Rev., 2009, 38, 2520–2531 RSC.
- Q. Lu, M. W. Lattanzi, Y. Chen, X. Kou, W. Li, X. Fan, K. M. Unruh, J. G. Chen and J. Q. Xiao, Angew. Chem., Int. Ed., 2011, 50, 6847–6850 CrossRef CAS PubMed.
- H. Wang, C. Zhu, D. Chao, Q. Yan and H. J. Fan, Adv. Mater., 2017, 29, 1702093 CrossRef PubMed.
- J. Qin, V. P. Pasko, M. G. McHarg and H. C. Stenbaek-Nielsen, Nat. Commun., 2014, 5, 1–6 Search PubMed.
- A. Marins, S. Banhos, E. Muri, R. Rodrigues, P. Cruz and M. Freitas, Mater. Chem. Phys., 2020, 242, 122440 CrossRef CAS.
- N. J. Vickers, Curr. Biol., 2017, 27, R713–R715 CrossRef CAS PubMed.
- A. S. Brierley, P. G. Fernandes, M. A. Brandon, F. Armstrong, N. W. Millard, S. D. McPhail, P. Stevenson, M. Pebody, J. Perrett and M. Squires, Science, 2002, 295, 1890–1892 CrossRef CAS PubMed.
- J. R. Miller and A. Burke, Electrochem. Soc. Interface, 2008, 17, 53 CrossRef CAS.
- F. Wang, S. Xiao, Y. Zhu, Z. Chang, C. Hu, Y. Wu and R. Holze, J. Power Sources, 2014, 246, 19–23 CrossRef CAS.
- F. S. Omar, A. Numan, N. Duraisamy, S. Bashir, K. Ramesh and S. Ramesh, RSC Adv., 2016, 6, 76298–76306 RSC.
- H. Jiang, J. Sun, L. Wei, M. Wu, W. Shyy and T. Zhao, Energy Storage Mater., 2020, 24, 529–540 CrossRef.
- H. Kim, M. Ramalingam, V. Balakumar, X. Zhang, W. Gao, Y.-A. Son and P. D. Bradford, Chem. Phys. Lett., 2020, 739, 136957 CrossRef CAS.
- D. Potphode and C. S. Sharma, J. Energy Storage, 2020, 27, 101114 CrossRef.
- G. Z. Chen, Int. Mater. Rev., 2017, 62, 173–202 CrossRef CAS.
- A. Chandra, Proc. Natl. Acad. Sci., India, Sect. A, 2012, 82, 79–90 CrossRef CAS.
- S. Roldán, D. Barreda, M. Granda, R. Menéndez, R. Santamaría and C. Blanco, Phys. Chem. Chem. Phys., 2015, 17, 1084–1092 RSC.
- N. Muzaffar, A. M. Afzal, H. Hegazy and M. W. Iqbal, J. Energy Storage, 2023, 64, 107142 CrossRef.
- G.-L. Xu, Y.-D. Gong, C. Miao, Q. Wang, S.-Q. Nie, Y. Xin, M.-Y. Wen, J. Liu and W. Xiao, Rare Met., 2022, 41, 3421–3431 CrossRef CAS.
- W. Grosshans and W. Holzapfel, Phys. Rev. B: Condens. Matter Mater. Phys., 1992, 45, 5171 CrossRef CAS PubMed.
- W. Shimizu, S. Makino, K. Takahashi, N. Imanishi and W. Sugimoto, J. Power Sources, 2013, 241, 572–577 CrossRef CAS.
- S. Makino, Y. Shinohara, T. Ban, W. Shimizu, K. Takahashi, N. Imanishi and W. Sugimoto, RSC Adv., 2012, 2, 12144–12147 RSC.
- D. Hu, C. Peng and G. Z. Chen, ACS Nano, 2010, 4, 4274–4282 CrossRef CAS PubMed.
- B. Akinwolemiwa, C. Peng and G. Z. Chen, J. Electrochem. Soc., 2015, 162, A5054 CrossRef CAS.
- D. S. Su and G. Centi, J. Energy Chem., 2013, 22, 151–173 CrossRef CAS.
- A. Krueger, Chem.–Eur. J., 2008, 14, 1382–1390 CrossRef CAS PubMed.
- M. Imran, A. M. Afzal, M. W. Iqbal, H. Hegazy, M. Z. Iqbal, S. Mumtaz and R. Qureshi, Mater. Sci. Semicond. Process., 2023, 158, 107366 CrossRef CAS.
- S. Chandrasekaran, L. Yao, L. Deng, C. Bowen, Y. Zhang, S. Chen, Z. Lin, F. Peng and P. Zhang, Chem. Soc. Rev., 2019, 48, 4178–4280 RSC.
- X. Rui, H. Tan and Q. Yan, Nanoscale, 2014, 6, 9889–9924 RSC.
- A. Borenstein, O. Hanna, R. Attias, S. Luski, T. Brousse and D. Aurbach, J. Mater. Chem. A, 2017, 5, 12653–12672 RSC.
- Y. Shao, M. F. El-Kady, J. Sun, Y. Li, Q. Zhang, M. Zhu, H. Wang, B. Dunn and R. B. Kaner, Chem. Rev., 2018, 118, 9233–9280 CrossRef CAS PubMed.
- Z. S. Iro, C. Subramani and S. Dash, Int. J. Electrochem. Sci., 2016, 11, 10628–10643 CrossRef CAS.
- J. S. Sanchez, A. Pendashteh, J. Palma, M. Anderson and R. Marcilla, J. Mater. Chem. A, 2019, 7, 20414–20424 RSC.
- L. Xu, L. Ma, T. Rujiralai, X. Zhou, S. Wu and M. Liu, RSC Adv., 2017, 7, 33937–33943 RSC.
- X. Shang, J.-Q. Chi, S.-S. Lu, J.-X. Gou, B. Dong, X. Li, Y.-R. Liu, K.-L. Yan, Y.-M. Chai and C.-G. Liu, Appl. Surf. Sci., 2017, 392, 708–714 CrossRef CAS.
- H. Hegazy, A. M. Afzal, E. Shaaban, M. W. Iqbal, S. Muhammad and A. Alahmari, Ceram. Int., 2023, 49, 1710–1719 CrossRef CAS.
- C. Altavilla, M. Sarno and P. Ciambelli, Chem. Mater., 2011, 23, 3879–3885 CrossRef CAS.
- X. Ou, X. Xiong, F. Zheng, C. Yang, Z. Lin, R. Hu, C. Jin, Y. Chen and M. Liu, J. Power Sources, 2016, 325, 410–416 CrossRef CAS.
- W. Li, X. Wei, H. Dong, Y. Ou, S. Xiao, Y. Yang, P. Xiao and Y. Zhang, Front. Chem., 2020, 8, 189 CrossRef CAS.
- M. Danot, J. Afonso, J. Portefaix, M. Breysse and T. Des Courières, Catal. Today, 1991, 10, 629–643 CrossRef CAS.
- S. A. Pawar, D. S. Patil and J. C. Shin, Electrochim. Acta, 2018, 259, 664–675 CrossRef CAS.
- A. M. Awwad, N. M. Salem, M. M. Aqarbeh and F. M. Abdulaziz, Chem. Int., 2020, 6, 42–48 CAS.
- T. Abbas, M. W. Iqbal, S. Gouadria, H. Hegazy, H. u. Hassan, A. M. Afzal, S. Aftab and A. Alzahrani, J. Solid State Electrochem., 2023, 1–11 Search PubMed.
- S. A. Pawar, D. S. Patil and J. C. Shin, ChemElectroChem, 2019, 6, 522–534 CrossRef CAS.
- S. Vijayakumar, S. Nagamuthu and G. Muralidharan, ACS Appl. Mater. Interfaces, 2013, 5, 2188–2196 CrossRef CAS PubMed.
- F. S. Omar, A. Numan, N. Duraisamy, M. M. Ramly, K. Ramesh and S. Ramesh, Electrochim. Acta, 2017, 227, 41–48 CrossRef CAS.
- M. Z. Iqbal, A. Khan, A. Numan, S. S. Haider and J. Iqbal, Ultrason. Sonochem., 2019, 59, 104736 CrossRef CAS PubMed.
- M. Z. Iqbal, M. M. Faisal, S. R. Ali, A. M. Afzal, M. R. A. Karim, M. A. Kamran and T. Alharbi, Ceram. Int., 2020, 46, 10203–10214 CrossRef CAS.
- A. Lawson, Mater. Res. Bull., 1972, 7, 1–8 CrossRef.
- G. Yang, X. Zhao, F. Liao, Q. Cheng, L. Mao, H. Fa and L. Chen, Sustainable Energy Fuels, 2021, 5, 3039–3083 RSC.
- X. Sun, B. Shi, H. Wang, N. Lin, S. Liu, K. Yang, B. Zhang and J. He, Adv. Opt. Mater., 2020, 8, 1901181 CrossRef CAS.
- V. A. Kumar, T. Uchida, T. Mizuki, Y. Nakajima, Y. Katsube, T. Hanajiri and T. Maekawa, Adv. Nat. Sci.: Nanosci. Nanotechnol., 2016, 7, 015002 Search PubMed.
- M. Lübke, J. Shin, P. Marchand, D. Brett, P. Shearing, Z. Liu and J. A. Darr, J. Mater. Chem. A, 2015, 3, 22908–22914 RSC.
- M. Fantauzzi, B. Elsener, D. Atzei, A. Rigoldi and A. Rossi, RSC Adv., 2015, 5, 75953–75963 RSC.
- S. Sadovnikov, E. Vovkotrub and A. Rempel, Dokl. Phys. Chem., 2018, 480, 81–84 CrossRef CAS.
- W. Ge, K. Kawahara, M. Tsuji and H. Ago, Nanoscale, 2013, 5, 5773–5778 RSC.
- Q. Lv, X. Qin and R. Lv, Frontiers in Materials, 2019, 6, 279 CrossRef.
- J. Macdonald, Int. Soc. Work, 1987, 150–170 Search PubMed.
- C. Gabrielli, Electrochim. Acta, 2020, 331, 135324 CrossRef CAS.
- C. Gabrielli, Science, 1998, 1–120 Search PubMed.
- R. De Levie, Adv. Electrochem. Electrochem. Eng., 1967, 6, 329–397 CAS.
- R. Kötz and M. Carlen, Electrochim. Acta, 2000, 45, 2483–2498 CrossRef.
- P. Kurzweil and H.-J. Fischle, J. Power Sources, 2004, 127, 331–340 CrossRef CAS.
- G. A. Ali, O. A. Fouad, S. A. Makhlouf, M. M. Yusoff and K. F. Chong, J. Solid State Electrochem., 2014, 18, 2505–2512 CrossRef CAS.
- M. Aghazadeh, J. Appl. Electrochem., 2012, 42, 89–94 CrossRef CAS.
- E. Elanthamilan, B. C. Meena, N. Renuka, M. Santhiya, J. George, E. Kanimozhi, J. C. Ezhilarasi and J. P. Merlin, J. Electroanal. Chem., 2021, 901, 115762 CrossRef CAS.
- P. Simon and Y. Gogotsi, in Nanoscience and technology: a collection of reviews from Nature journals, World Scientific, 2010, pp. 320–329 Search PubMed.
- J. Yang, P. Xiong, C. Zheng, H. Qiu and M. Wei, J. Mater. Chem. A, 2014, 2, 16640–16644 RSC.
- E. Beaudrouet, A. L. G. La Salle and D. Guyomard, Electrochim. Acta, 2009, 54, 1240–1248 CrossRef CAS.
- A. M. Moseley, P. Rahman, G. A. Wells, J. R. Zadro, C. Sherrington, K. Toupin-April and L. Brosseau, PLoS One, 2019, 14, e0222770 CrossRef CAS PubMed.
- M. Toupin, T. Brousse and D. Bélanger, Chem. Mater., 2002, 14, 3946–3952 CrossRef CAS.
- M. Toupin, D. Bélanger, I. R. Hill and D. Quinn, J. Power Sources, 2005, 140, 203–210 CrossRef CAS.
- M. Jin, S.-Y. Lu, L. Ma, M.-Y. Gan, Y. Lei, X.-L. Zhang, G. Fu, P.-S. Yang and M.-F. Yan, J. Power Sources, 2017, 341, 294–301 CrossRef CAS.
- P. Simon, Y. Gogotsi and B. Dunn, Science, 2014, 343, 1210–1211 CrossRef CAS PubMed.
- M. F. Iqbal, M. N. Ashiq, A. Razaq, M. Saleem, B. Parveen and M.-U. Hassan, Electrochim. Acta, 2018, 273, 136–144 CrossRef CAS.
- M. Z. Iqbal, M. M. Faisal, S. R. Ali, S. Farid and A. M. Afzal, Electrochim. Acta, 2020, 346, 136039 CrossRef CAS.
- M. Z. Iqbal, M. M. Faisal, S. R. Ali and A. M. Afzal, J. Electroanal. Chem., 2020, 871, 114299 CrossRef CAS.
- M. F. Iqbal, M. N. Ashiq, S. Iqbal, N. Bibi and B. Parveen, Electrochim. Acta, 2017, 246, 1097–1103 CrossRef CAS.
- H. Hassan, M. W. Iqbal, A. M. Afzal, M. Asghar and S. Aftab, J. Solid State Electrochem., 2023, 27, 125–137 CrossRef CAS.
- W. Alshammari, D. S. Patil, S. A. Pawar and J. C. Shin, Mater. Today Chem., 2017, 5, 72–80 CrossRef.
- S. Xu, C. Su, T. Wang, Y. Ma, J. Hu, J. Hu, N. Hu, Y. Su, Y. Zhang and Z. Yang, Electrochim. Acta, 2018, 259, 617–625 CrossRef CAS.
- A. Sharma, S. Kapse, A. Verma, S. Bisoyi, G. K. Pradhan, R. Thapa and C. S. Rout, ACS Appl. Energy Mater., 2022, 5, 10315–10327 CrossRef CAS.
- K. Liang, J. DeNaufville, A. Jacobson, R. Chianelli and F. Betts, J. Non-Cryst. Solids, 1980, 35, 1249–1254 CrossRef.
- M. B. Poudel, H. P. Karki and H. J. Kim, J. Energy Storage, 2020, 32, 101693 CrossRef.
|
| This journal is © The Royal Society of Chemistry 2023 |
Click here to see how this site uses Cookies. View our privacy policy here.  Open Access Article
 *a,
Saikh Mohammad Wabaidurb,
Haseeb ul Hassana,
Amir Muhammad Afzala,
Tasawar Abbasa,
Mohamed A. Habila
 b and
Ehsan Elahi
 c
c

 , the active mass is m, and the scanning speed is v. The equation below can be applied to measure the capacity through GCD.51


