 Open Access Article
Crystal structure and optical characterization of a new hybrid compound, C6H9N2FeCl4, with large dielectric constants for field-effect transistors†
A. Ghoudia,
Kh. Ben Brahim a,
H. Ghallab,
J. Lhoste
 c,
S. Auguste
 c,
K. Khirounid,
A. Aydia and
A. Oueslati
 *a
*a
aLaboratory for Spectroscopic Characterization and Optics of Materials, Faculty of Sciences, University of Sfax, B. P. 1171, 3000 Sfax, Tunisia. E-mail: oueslatiabderrazek@yahoo.fr
bQuantum and Statistical Physics Laboratory, Faculty of Sciences, University of Monastir, Monastir 5079, Tunisia
cInstitut des Molécules et Matériaux du Mans (IMMM), UMR-6283 CNRS, Le Mans Université, Avenue Olivier Messiaen, 72085 Le Mans Cedex 9, France
dLaboratoire de Physique des Matériaux et des Nanomatériaux appliquée a`l'Environnement, Faculté des Sciences de Gabes, Université de Gabes, cite Erriadh, 6079 Gabes, Tunisia
First published on 25th April 2023
Abstract
Due to remarkable dielectric features, such as a large dielectric constant, strong electrical conductivity, high capacitance, and low dielectric loss, hybrid materials have lately seen a huge number of applications in the field of optoelectronics. These are critical characteristics that qualify the performance of optoelectronic devices, particularly field-effect transistor components (FETs). Here, the hybrid compound 2-amino-5-picoline tetrachloroferrate(III) (2A5PFeCl4) was synthesised by using the slow evaporation solution growth method at room temperature. Structural, optical, and dielectric properties have been investigated. The 2A5PFeCl4 compound crystallises in the monoclinic system (P21/c space group). Its structure can be described as a successive layering of inorganic and organic parts. [FeCl4]− tetrahedral anions and 2-amino-5-picolinium cations are connected by N–H⋯Cl and C–H⋯Cl hydrogen bonds. The optical absorption measurement confirms the semiconductor nature with a band gap of around 2.47 eV. Additionally, the structural and electronic properties of the title compound have been investigated theoretically through DFT calculations. At low frequencies, this material has significant dielectric constants (ε ∼106). Furthermore, the high electrical conductivity, low dielectric loss at high frequencies, and high capacitance show that this new material has great dielectric potential in FET technologies. Due to their high permittivity, these compounds can be employed as gate dielectrics.
1. Introduction
The field-effect transistor (FET) is usually considered the most important innovation of the twentieth century. Since the creation of the first silicon transistor in 1947, electronic technology has advanced dramatically.1–3 It is a significant part of making contemporary digital integrated circuits. Silicon (Si)-based integrated circuits are employed in the majority of today's electronic products.4 Actually, Moore's law states that by shrinking the constituent size of Si-based transistors, the dimensions of these integrated circuits can be reduced to improve their performance.5Silicon has reached its fundamental limits as a material, notwithstanding its abundance and ease of handling.6 However, one of its primary drawbacks is its inability to withstand the high temperatures created by current integrated circuits.7 In this context, discovering new flexible materials with remarkable optical, dielectric, electrical, and mechanical characteristics is critical for the development of various electronic devices, particularly FETs.8
Due to the benefits of both organic and inorganic components, hybrid materials have drawn a lot of interest in optoelectronic devices such as light-emitting diodes (LEDs), solar cells, lasers, detectors, and photodetectors.9–16 Aside from their widespread usage in photovoltaic applications, particularly solar cells, hybrids have lately piqued the interest of transistor researchers.15,16 They are good candidates for FETs because of their low exciton binding energy, trap density, and other electric and dielectric properties, such as their high dielectric constant, good electrical conductivity, high capacitance, and low dielectric loss.
Recently, technology has been developed that takes advantage of hybrid materials' multifunctional capabilities in FET devices. They have been used in some works as dielectric gates in flexible thin-film transistors because of their high permittivity.17 However, in other studies, these materials were used as active channels or semiconductors in creative transistor designs.18
Given the variety of crystal structures found in hybrid materials, we were able to successfully create a new hybrid compound, 2A5PFeCl4, using the slow evaporation solution growth method at room temperature. Its general formula is AMX4 (where A stands for the organic cation, M for the inorganic cation, and X for the monovalent halogen ion (Cl−)).
The X-ray diffraction technique was used to characterize the title compound. The optical and dielectric properties have been determined. Further, DFT and TD-DFT calculations have been performed to determine the structure and electronic properties of 2A5PFeCl4. The absorption spectrum, wavelength, and HOMO–LUMO gap are calculated. The interactions between the organic and inorganic species, ensuring the stability of the crystal pattern, have been discussed through the Hirshfeld surfaces (HS), atoms in molecules (AIM), and non-covalent reduced density gradient (NC-RDG) analyses.
Due to the novelty of this hybrid material, a proper examination of its structural, optical, and electrical properties is required to ascertain whether it can be used in FET devices.
2. Experimental procedure
2.1. Crystallization of 2A5PFeCl4
The 2A5PFeCl4 molecule was synthesised using a similar preparation procedure to other hybrid compounds that have been reported before (solvent evaporation method).19–21An aqueous solution of ferric chloride was prepared by dissolving ca. 0.1 g of FeCl2 in hydrochloric acid (HCl). To this solution, 0.0568 g of 2-amino-5-picoline (C6H8N2) was added. Single crystals, having a brown color, were obtained after 7 days.
2.2. Single crystal X-ray data collection
Crystals were selected under a polarizing optical microscope and mounted on micro mount needles (MiTiGen) for single-crystal X-ray diffraction experiments. X-ray intensity data were collected on a Bruker APEX II Quazar diffractometer (4 circle Kappa goniometer, CCD detector) using an Iμs microfocus source (Mo-Kα radiation with l = 0.71073 Å) at 296 K. The structures were determined by direct methods with SHELXS-97 and SHELXL-97 programs included in the WINGX package.22 All non-hydrogen atoms positions were refined anisotropically. Hydrogen atoms of the organic molecules were geometrically constrained (HFIX options). The nature of the atoms was differentiated from bond distance considerations. DIAMOND23 was used to create the drawing. Crystallographic data for the structures have been deposited to the Cambridge Crystallographic Data Center, with the following number: CCDC 2223635† for C6H9N2FeCl4.The structure refinement of the complex 2A5PFeCl4 was performed in the monoclinic system with the P21/c space group (the point group 2/m). Lattice spacing are a = 6.4063(4) Å, b = 14.2730(9) Å, c = 13.2376(10) Å, β = 90.298(3)° and V = 1210.4(2) Å3 as listed in Table 1 along with data collection parameters and refinement. Selected experimental and calculated bond lengths and angles are listed in Table 3. It must be noted that the structure can be resolved in P21/m with c/2. Nevertheless, this solution has been excluded because it does not account for the order in the organic molecule in which nitrogen atoms are clearly localized.
| Temperature | 296 K |
| Empirical formula | C6H9N2FeCl4 |
| Formula weight (g mol−1) | 306.80 |
| Crystal system | Monoclinic |
| Space group | P21/c |
| a | 6.4063(4) Å |
| b | 14.2730(9) Å |
| c | 13.2376(10) Å |
| β | 90.298(3)° |
| Z | 4 |
| V | 1210.4(2) Å3 |
| μ (Mo Kα) | 2.087 mm−1 |
| Index ranges | −8 < h < 8, −18 < k < 18, −17 < l < 16 |
| Reflections collected | 16![[thin space (1/6-em)]](https://www.rsc.org/images/entities/char_2009.gif) 901 901 |
| Independent reflections | 2783 |
| Reflections with I > 2σ(I) | 1710 |
| Rint | 0.041 |
| Absorption correction | Multi-scan |
| Refined parameters | 119 |
| R[F2 > 2σ(F2)] | 0.0320 |
| wR(F2) | 0.1032 |
| Goodness of fit | 1.032 |
| Δρmin/Δρmax (Å−3) | −0.29/0.33 |
2.3. Spectroscopic measurements
A Shimadzu UV-3101PC scanning spectrophotometer with a wavelength range of 200 to 800 nm was used to carry out UV-vis powder spectroscopy at room temperature. The apparatus has the capability of measuring absorbance and reflection with spherical integration and xenon light.We used a Solartron impedance analyzer to investigate electrical transmission characteristics, operating within a frequency range of 102 to 107 Hz, at temperatures between 313 and 358 K and a voltage of 0.5 V. The measurements were carried out on a pellet with a typical diameter of 8 mm and a thickness 1 mm. The opposite sides of this pellet have been covered with conductive silver paint to ensure a solid electrical connection.
3. Theoretical details
Starting from its crystalline asymmetric unit, the geometry of 2A5PFeCl4 was optimized with the DFT method. The optimization was carried out using the Gaussian 09 software package24 and GaussView as an interface program.25 The exchange functional (B3) of the Becke three-parameter hybrid26 combined with the LYP functional (Lee–Yang–Parr correlation)27 was employed in conjunction with the empirical dispersion corrections of Grimme D3,28 and the LanL2DZ basis set.29 The intermolecular interactions between organic and inorganic entities have been discussed through Hirshfeld surfaces, AIM and non-covalent RDG analyses. The Hirshfeld surfaces and fingerprint plots30 were determined by using the Crystal Explorer package31 based on the CIF file of the title compound. The topological AIM and RDG analyses have been performed with the Multiwfn program,32 using the wavefunction file created through DFT single point calculation. The electrostatic potential surface was computed to identify the nucleophile and the electrophile sites. Further, TD-DFT calculations have been performed in order to predict the UV-vis absorption spectrum and to calculate the HOMO–LUMO energy gap employing the IEFPCM solvation model.4. Results and discussion
4.1. Crystal structure description
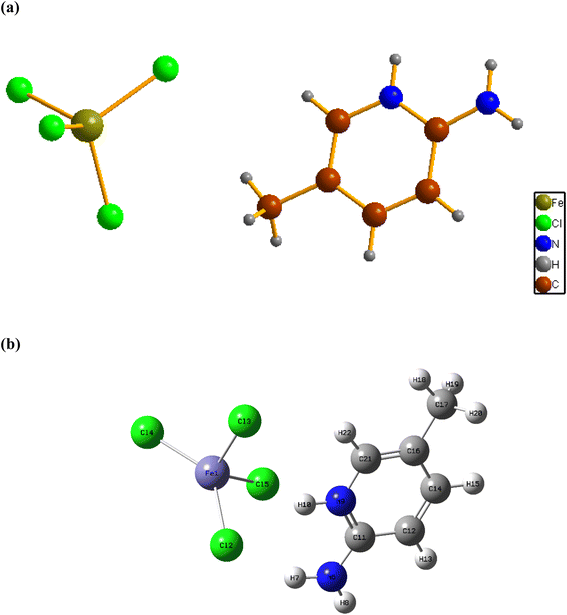
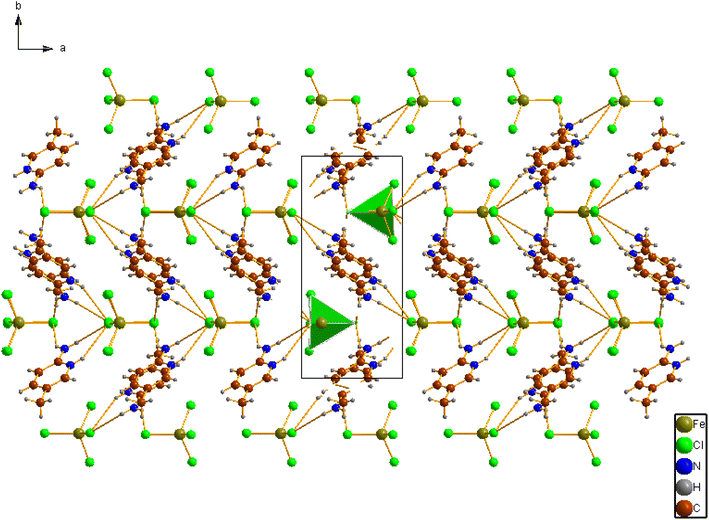
Fig. 1a shows the asymmetric unit of 2A5PFeCl4, which is made up of a crystallographically independent [C6H9N2]+ cation and an ion tetrachloroferrate(III). This finding fits well with the optimized geometry, calculated at the DFT/B3LYP-D3/LanL2DZ level of theory, as depicted in Fig. 1b.To describe the atomic arrangement and better understand the crystalline architecture of the title molecule. Fig. 2 illustrates the projection along the  axis.
axis.
Indeed, this projection demonstrates the atomic organization of chemical buildings involved in the composition of the crystal in the form of an alternation of cationic and anionic groups parallel to the (001) plane.
Based on the X-ray determination, the crystalline structure is mainly stabilized by the presence of two strong interactions N1–H1A⋯Cl4, N1–H1B⋯Cl1, since the values d(H–Cl) are smaller than the sum of the radii of van der Waals of the iron, and hydrogen atoms (rFe + rH ≤ 2.81 Å),33 and weak N/C–H⋯Cl hydrogen bonding. These interactions exhibit donor–acceptor distances ranging from 3.441 to 3.775 Å between the cationic and anionic entities, as can be seen in Table 2.
| D–H⋯A | D–H | H⋯A | D⋯A | D–H⋯A |
|---|---|---|---|---|
| N1–H1A⋯Cl3 | 0.86 | 2.976 | 3.474 | 118.8 |
| N1–H1A⋯Cl4 | 0.86 | 2.785 | 3.568 | 152.0 |
| N1–H1B⋯Cl1 | 0.86 | 2.721 | 3.441 | 142.2 |
| N2–H2⋯Cl4 | 0.86 | 2.853 | 3.631 | 151.4 |
| C2–H2A⋯Cl3 | 0.93 | 2.884 | 3.775 | 160.7 |
| C6–H6⋯Cl2 | 0.93 | 2.924 | 3.560 | 126.8 |
The [FeCl4]2−anion adopts a tetrahedral geometry in which the Fe ion is surrounded by four chlorine atoms with an sp3 hybridization. The bond length Fe–Cl and bond angle Cl–Fe–Cl values are in the range of 2.1864(8)–2.2039(9) Å and 107.38(3)–111.68(4)°, respectively (Table 3).
| Bond lengths (Å) | Observed | Calculated | Angle (°) | Observed | Calculated |
|---|---|---|---|---|---|
| [FeCl4]− | |||||
| Fe1–Cl1 | 2.1864(8) | 2.295 | Cl1–Fe1–Cl2 | 109.46(3) | 98 |
| Fe1–Cl2 | 2.1921(8) | 2.241 | Cl1–Fe1–Cl3 | 107.38(3) | 136 |
| Fe1–Cl3 | 2.2014(8) | 2.198 | Cl2–Fe1–Cl3 | 111.68(4) | 103 |
| Fe1–Cl4 | 2.2039(9) | 2.238 | Cl1–Fe1–Cl4 | 110.54(4) | 100 |
| Cl2–Fe1–Cl4 | 108.00(5) | 112 | |||
| Cl3–Fe1–Cl4 | 109.81(4) | 107 | |||
![[thin space (1/6-em)]](https://www.rsc.org/images/entities/char_2009.gif) |
|||||
| [C6H9N2]+ | |||||
| N1–C1 | 1.339(4) | 1.354 | C1–N2–C6 | 123.2(3) | 124 |
| N2–C1 | 1.334(4) | 1.368 | N2–C1–N1 | 119.7(3) | 119 |
| N2–C6 | 1.355(4) | 1.375 | N2–C1–C2 | 116.8(3) | 117 |
| C1–C2 | 1.399(4) | 1.427 | N1–C1–C2 | 123.5(3) | 124 |
| C2–C3 | 1.351(4) | 1.387 | C3–C2–C1 | 119.8(3) | 120 |
| C3–C4 | 1.380(4) | 1.30 | C2–C3–C4 | 122.1(3) | 122 |
| C4–C6 | 1.347(4) | 1.384 | C6–C4–C3 | 116.9(3) | 117 |
| C4–C5 | 1.503(4) | 1.512 | C6–C4–C5 | 121.5(3) | 122 |
| C3–C4–C5 | 121.6(3) | 122 | |||
On the other hand, we propose a very simple geometry index for four-coordinate transition metal complexes, τ4, given by the following eqn (1) by subtracting α and β, the two largest angles in the tetra-coordinate species, from 360°, then dividing everything by 141.34
 | (1) |
The tetra-coordinate τ4 index is found to be 0.98. A tetra-coordinate index is a number that ranges from 0.0 for a perfect square planar geometry to 1.0 for a perfect tetrahedral geometry. Interestingly, this agrees with the X-ray results, as τ4 is very close to the unit, which is almost a perfect tetrahedron.
The Baur distortion indices for the distances and angles can be calculated using eqn (2) and (3):35 where d = (Fe–Cl) distance, a = (Cl–Fe–Cl) angle, and dm = average value.
 | (2) |
 | (3) |
ID(Fe–Cl) = 3.05(1) 10(−3) and ID(Cl–Fe–Cl) = 0.010 (8).
It can be admitted that the FeCl4 tetrahedron is formed by a regular arrangement of chlorine atoms, in which the iron atom is slightly displaced from the center of gravity of the tetrahedron.
Concerning the cationic group, the latter has a plane geometry, a pyridine group coplanar with the methyl (–CH3) on the C5 atom with a C4–C5 distance equal to 1.503(4) Å and an amino group with a distance C1–N1 = 1.339(4) Å.
The pyridine group is characterized by C–C and C–N bond lengths ranging from 1.334(4) to 1.399(4) Å and bond angles, C–C–C, C–N–C and C–C–N varying from 116.8(4) to 123.2(3)° (Table 3). These values are comparable to the corresponding ones previously reported for similar pyridinium complexes.36
4.2. Hirshfeld surfaces
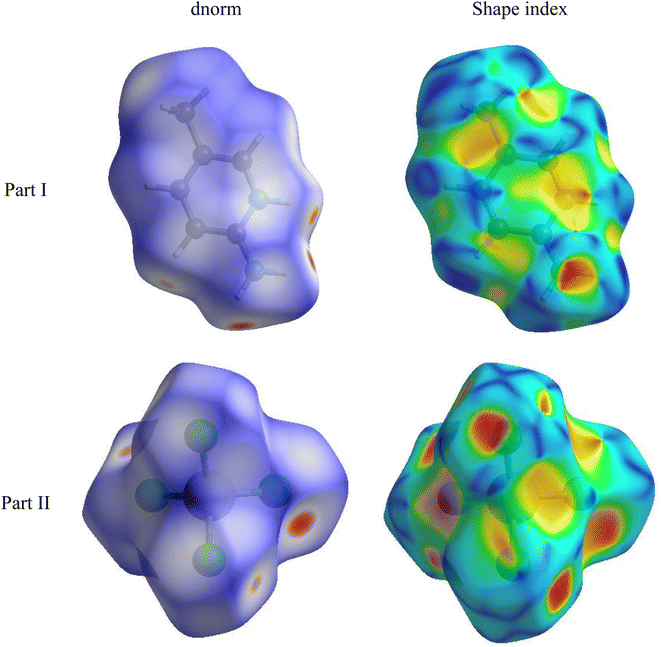
The Hirshfeld surfaces generated from the crystal packing give a significant interpretation of the possible interactions ensuring the stability of the crystal.36 The basic goal of the Hirshfeld surface is to divide the crystal electron density into molecular fragments by defining the area occupied by a molecule in a crystal. In this context, two alternative types of distances de and di are specified for each point of an isosurface, expressing the distance from the point to the closest nucleus either external to the surface or internal to the surface, respectively. The normalized contact distance dnorm was used to define a three-dimensional molecular surface. dnorm is characterized by:37
 | (4) |
The Hirshfeld surface can alter very subtly and have a significant impact on the shape index. The latter shows the surface of electron density that surrounds molecular interactions. The small range of light color represents a weaker and longer interaction than hydrogen bonds. Red and blue triangles are a sign of π–π interactions. The griddle-colored regions in each of di and de represent all intra- and intermolecular interactions in the 2D fingerprint plots, as shown in Fig. 4. Accordingly, the main interaction contributions to the whole Hirshfeld surface are H⋯Cl (63.5%) H⋯H (19.1%), Cl⋯Cl (5.9%) and Cl⋯C (5.4%) contacts. So, this quantitative finding demonstrates that H⋯Cl interactions account for the majority of the surface.
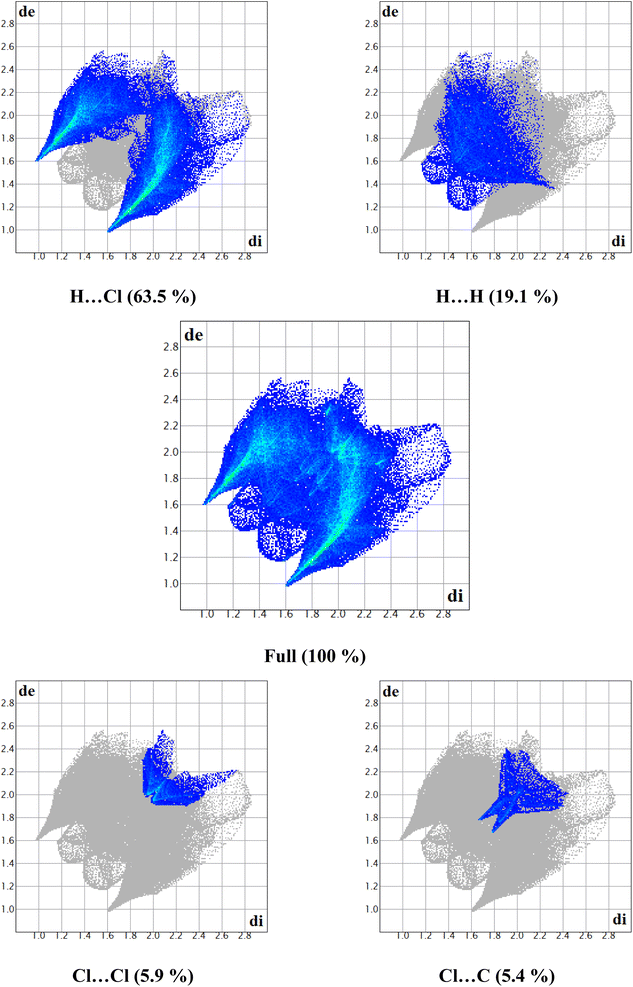 | ||
| Fig. 4 2D-fingerprint plots along with the percentage of main intermolecular contacts contributed to the Hirshfeld surface in 2-amino 5-picoline tetrachloroferrate(III) crystal packing. | ||
4.3. AIM analysis
Within AIM theory,38 each interatomic interaction is defined by the presence of a bond critical point (BCP). The topological parameters at BCP, such as the electron density ρ(r) and its Laplacian Δ2ρ(r), aid in understanding the nature and strength of the interaction.39 According to Koch and Popelier criteria,40 the hydrogen bonding interaction should have ρ(r) and Δ2ρ(r) values within the range of 0.0020–0.0400 and 0.0240–0.1390 a.u, respectively.The molecular graph including BCPs associated with the intermolecular interactions between organic and inorganic entities in the asymmetric unit are displayed in Fig. 5. All of the topological parameters measured at the BCPs are listed in Table 4. When the value of Δ2ρ(r) at BCP is positive, it means that the electron density is being reduced along with the bond path, which is typical of closed-shell interactions like hydrogen bonding. Here, the values of ρ(r) and Δ2ρ(r) are between 0.0065 and 0.0190 and 0.0208 and 0.0548, respectively. Regarding these parameters, we may conclude that the interactions between the organic and inorganic species are considerably weak; the values of Δ2ρ(r) are lower than those of Koch and Popelier criteria.
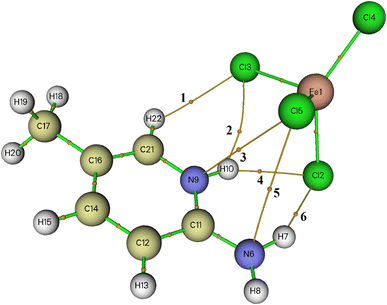 | ||
| Fig. 5 AIM molecular graph of 2-amino 5-picoline tetrachloroferrate(II) generated by using Multiwfn program: bond critical points (BCPs) are represented with small orange spheres. | ||
| BCP | ρ(r) | Δ2ρ(r) | H(r) | G(r) | V(r) | E(r) | ε | ELF |
|---|---|---|---|---|---|---|---|---|
| a All parameters are given in au, except E(r) is expressed in kJ mol−1. | ||||||||
| 1 | 0.0095 | 0.0326 | 0.0014 | 0.0068 | −0.0054 | 7.03 | 0.1635 | 0.0318 |
| 2 | 0.0085 | 0.0291 | 0.0011 | 0.0062 | −0.0051 | 6.61 | 3.1864 | 0.0267 |
| 3 | 0.0070 | 0.0230 | 0.0009 | 0.0048 | −0.0039 | 5.07 | 0.7246 | 0.0227 |
| 4 | 0.0177 | 0.0502 | 0.0003 | 0.0122 | −0.0119 | 15.53 | 0.0770 | 0.0741 |
| 5 | 0.0065 | 0.0208 | 0.0008 | 0.0044 | −0.0036 | 4.70 | 0.5412 | 0.0210 |
| 6 | 0.0190 | 0.0548 | 0.0003 | 0.0134 | −0.0131 | 17.04 | 0.0532 | 0.0771 |
In order to discuss deeply the nature of the intermolecular interactions within the asymmetric unit, NCI-RDG analysis was performed.
This technique allows graphically distinguishing, with color coding, between hydrogen bonding, van der Waals, and repulsive steric interactions. The RDG function isosurface with sign(λ2)ρ coloring scheme for the asymmetric unit cell of 2A5PFeCl4 is depicted in Fig. 6. The green areas between the organic and inorganic parts prove the existence of van der Waals interactions.
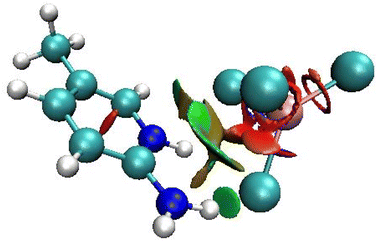 | ||
| Fig. 6 RDG function isosurface with sign(λ2)ρ coloring scheme for the asymmetric unit cell of 2-amino 5-picoline tetrachloroferrate(II). | ||
4.4. Molecular electrostatic potential
The surface of the molecular electrostatic potential (MEP) is related to the electronic density and is a useful descriptor for defining sites for electrophilic attack, nucleophilic reactions, and hydrogen-bonding interactions.41–43 The calculated MEP surface of 2A5PFeCl4 is plotted, using a color code, in Fig. 7. The nucleophilic sites are associated with the blue zone with positive potential, whereas the red region defines the electrophilic sites. An area with zero potential is shown by the color green. Herein, the nucleophilic attacks are located surrounding the hydrogen and nitrogen atoms of the organic part, while the electrophilic sites are associated with the inorganic part of the asymmetric unit. These findings reflect the interactions between the two parts of the compound and support the stability of the pattern.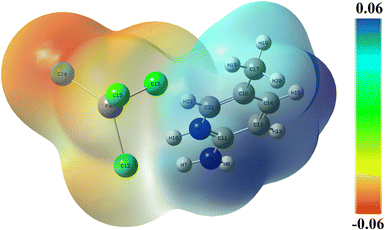 | ||
| Fig. 7 Molecular electrostatic potential surface of 2-amino 5-picoline tetrachloroferrate(II) calculated at B3LYP-D3/lanl2dz level of theory. | ||
4.5. Optical absorption of 2A5PFeCl4
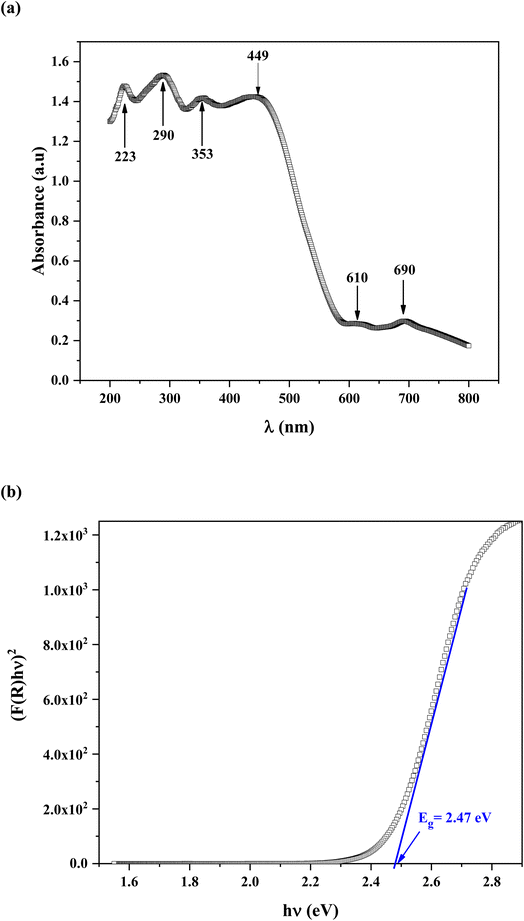
The semi-conductive properties of 2A5PFeCl4 were explored using UV-vis spectroscopic analysis.Fig. 8a present the experimental absorption spectrum. Six peaks are observed. The absorption bands are indicative of the electronic transitions within the inorganic component ([FeCl4]− anion), rather than the cation group, because organic molecules are transparent in the visible spectrum region.44 The [FeCl4]− anion is typically ascribed to the four distinctive bands at 223, 290, 353 and 449 nm.45,46 The other bands observed at 610 and 690 nm, assigned to 4E(b) (6A1 → 4T2(b)) and 6A1 → 4A2 transitions respectively, are characteristic of the [FeCl4]− anion in a tetrahedral geometry.47
In addition, strong absorption is observed in the spectral region roughly between 200 and 450 nm then it decreases sharply from 450 to 600 nm, thus indicating the presence of the band gap.
The shoulders that emerge in the reflectance spectrum R occur at wavelengths corresponding to the optical gap, according to R. E. Marotti et al.48 and R. Henriquez et al.49 calculating the first derivative (1/R)(dR/dλ) highlights the shoulders. Fig. S1† depicts the first derivative variation as a function of wavelength. The existence of a prominent peak centred at 506 nm allows one to estimate the energy of the optical gap at 2.45 eV using the relationship:
 | (5) |
The band gap energy of C6H9N2FeCl4 is also determined by combining both the Kubelka–Munk function and the Tauc equation, as shown by the following relation:50
 | (6) |
F(R) = (1 − R)2/2R, where R represents reflectance, ν is the light frequency, h is Planck constant, B is a constant related to transition probability, and n is the index, which takes different values depending on the inter-band transition mechanism (n = 1/2 and 2 corresponding to direct and indirect transitions, respectively).
Fig. 8b depicts the (F(R)hν)2 vs. photon energy (hν) curve. The extension of the linear portion of the curve to meet the (hν) axis at (F(R)hν)2 yields an optical band gap Eg = 2.47 eV. This value is quite similar to that produced using the Marotti method. This value proves that the title compound is a suitable semiconductor for optoelectronics applications.51
The excitation characteristics and capability of electron transport may be reasonably predicted qualitatively using the border molecular orbital.52
Fig. 9 illustrates the superposition of the experimental and predicted UV-vis spectra. The TD-DFT spectra are computed in the gas phase and in water and HCl solvents using the IEFPCM solvation model. Clearly, the simulation spectra fairly fit the experimental absorption band of the investigated compound. One may observe that the simulated spectrum in water solvent reproduces the experimental one rather than in the gas phase and HCl solvent.
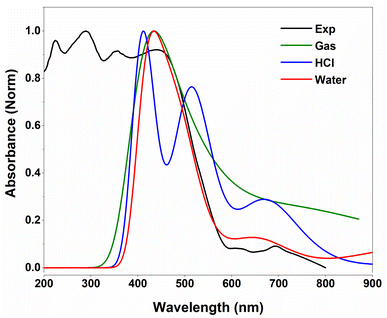 | ||
| Fig. 9 Experimental and TD-DFT/B3LYP-D3 predicted UV-vis spectra of 2-amino 5-picoline tetrachloroferrate(II). | ||
The most significant orbitals in a molecular system are the frontier molecular orbitals, called the highest occupied molecular orbital (HOMO) and the lowest unoccupied molecular orbital (LUMO). The frontier orbital gap characterizes the chemical reactivity and kinetic stability of the molecule. In this context, a molecule with a small frontier orbital gap is more polarizable. It is generally associated with a high chemical reactivity, and low kinetic stability and is also termed a soft molecule.52–54 The HOMO is the orbital that primarily acts as an electron donor and the LUMO is the orbital that largely acts as an electron acceptor. HOMO−2, HOMO−1, HOMO, LUMO, LUMO+1 and LUMO+2 molecular orbital isosurfaces along with their energy values are illustrated in Fig. 10. The HOMO–LUMO energy gap is found to be 2.54 eV. This value explains the eventual charge transfer interactions within the molecules. The LUMO+2 isosurface is localized in the organic part. The other isosurfaces. HOMO−2, HOMO−1, HOMO, LUMO and LUMO+1, only occur on the inorganic part. To better understand the reactivity of the title compound, several energetic descriptors have been calculated based on the HOMO and LUMO energy values, such as chemical potential (μ), electronegativity (χ), global hardness (η), global softness (ζ), and global electrophilicity index (ω) values. The results are listed in Table 5. The high electrophilicity index categorizes the propensity of electron acceptors to acquire additional electron charges from the environment. According to the literature,55 the chemical in the title can provide semi-conducting characteristics.
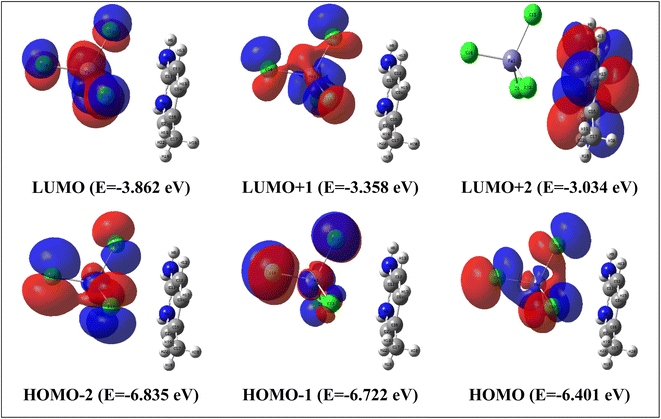 | ||
| Fig. 10 HOMO and LUMO frontier molecular orbitals calculated with TD/B3LYP-D3/lanl2dz in water solvent. | ||
| Function | Value |
|---|---|
| EHOMO (eV) | −6.401 |
| ELUMO (eV) | −3.862 |
| ΔEHOMO–LUMO gap (eV) | 2.539 |
| Chemical potential μ (eV) | −5.131 |
| Electronegativity χ (eV) | 5.131 |
| Global hardness η (eV) | 1.269 |
| Global softness S (eV) | 0.788 |
| Global electrophilicity index ψ (eV) | 13.17 |
| Dipole moment (D) | 17.78 |
| Counterpoise corrected energy (a.u.) | −526.893184234950 |
| BSSE energy (a.u.) | 0.004289900801 |
| Complexation energy (kcal mol−1) | −121.27 |
4.6. Dielectric measurements
Complex impedance spectroscopy (CIS) is a well-established technique for analysing a material's electrical activity. It provides information on ion flow inside the material, relaxation time, electrical conductivity, etc.The polarizability of dielectric material is governed by its relative permittivity (εr) or dielectric constant (ε), which is commonly stated as a complex number given by:56
| ε = ε′ − iε′′ | (7) |
 | (8) |
 | (9) |
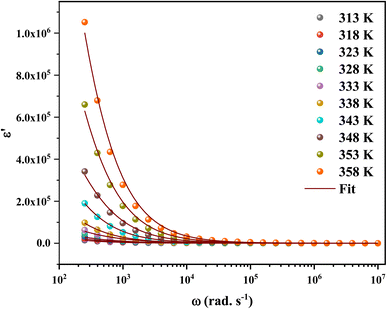
The calculated frequency-dependent ε′ values at different temperatures are shown in Fig. 11. At low frequencies, the produced materials had greater ε′ values, indicating that they might be good candidates for low-frequency energy storage.57 Similarly, the ε′ values fall as the frequency rises, improving the energy storage capacity.58 Furthermore, the dielectric constant values rise as the temperature increases at a certain frequency. This nature specifies the thermal activation of charge carriers, which impacts polarization. The four main types of polarization are ionic, electronic, orientational, and interfacial. The system's ionic and electronic polarizations are deformational components of polarizability, whereas the orientational and interfacial polarizations are relaxation components.59
The Maxwell–Wagner interfacial polarization can explain the observed dielectric behavior in this material.60 According to these models, the produced sample's dielectric structure is made up of good-conductive grains separated by poor-conductive grain boundaries. The grain boundaries act as a barrier, preventing charge carriers from flowing freely and lowering the inter-grain conductivity. Interfacial polarization involves electron exchange between the ions of the same molecule. Material deformation causes the distribution of positive and negative space charges to change. When an electric field is applied, negative and positive charges travel to opposing poles, resulting in a huge number of dipoles when the frequency is low. As a result, the dipoles easily follow the quasi-static field, and the material exhibits a high dielectric constant at low frequencies. As the dipole moments become incapable of following the electric field at higher frequencies, the dielectric constants steadily fall into the high-frequency zone.
The orientational and interfacial polarizations contribute to the real part of the dielectric constant in the low-frequency zone. On the other hand, the electronic and ionic polarizations are governed in the high frequency domain, which explains the lower values of ε′. The existence of thermally activated charge carriers and the moment of the electric dipole are responsible for the increase in the real component of the dielectric constant with increasing temperature.61,62
Based on the literature, the dielectric constants of some conventional semiconductors were substantially lower than those of C6H9N2FeCl4 (ε ∼ 106). For example, silicon63 has a dielectric constant of 12.1 while organic semiconductors have dielectric constants ranging from 2 to 5, causing recombination losses in solar systems (photovoltaic devices).64–66 On the other hand, materials with a high dielectric constant demonstrated more resistance to the electric field than those with low values.64
Furthermore, a large dielectric constant would reduce exciton binding energy, lowering charge carrier recombination losses, and thereby boosting solar cell device performance.67 High power efficiency might be achieved by a solar cell with a long diffusion length and low binding energy. Hybrids have a lower exciton binding energy than organic materials, as is widely known. This is because their dielectric constants differ.68 It is obvious that the dielectric constant is a critical element in determining the binding energy for photocurrent generation in solar cells.68 As a result of the C6H9N2FeCl4 high dielectric constant, it might be employed as a dielectric gate or active channel in FET devices.69,70 The FET, a common component in current electronic circuits, is used to amplify or tune electronic analog and digital signals.
The complex dielectric data collected at various temperatures were adjusted using the Cole–Cole equation to study temperature-dependent dipolar polarisation and associated relaxation processes.
The Cole–Cole formula is given by:71
 | (10) |
The real and imaginary components of are provided by:72
 | (11) |
 | (12) |
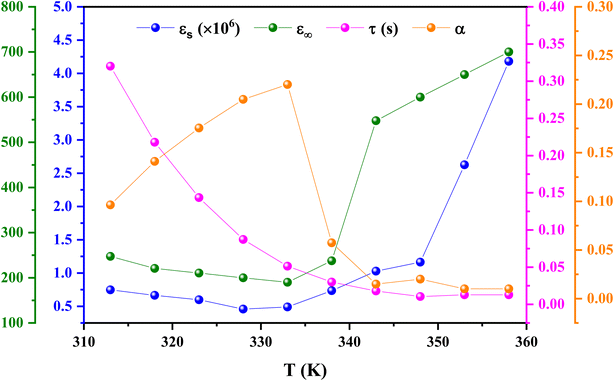
Eqn (11) was used to fit the actual component of the obtained dielectric constant versus frequency data (Fig. 11) to get different dielectric and relaxation characteristics of the C6H9N2FeCl4 sample. All of the parameters acquired from the fits are presented in Fig. 12 it is observed that εs and ε∞ values are nearly temperature independent. A slight increase in the values of εs and ε∞ when temperatures rise over 333 K can be attributed to the contribution of thermally produced charge carriers. Furthermore, as predicted, when the measurement temperature rises, the mean relaxation time (τ) decreases.
The parameter α provides information about the sample's relaxation time distribution. It's worth noting that begins to rise from 0.09 at 313 K to a high of 0.22 at 333 K before falling to 0.009 at 358 K. This fluctuation demonstrates that as the temperature rises, other relaxation mechanisms with varying relaxation times begin to participate, resulting in a wide range of relaxation times with a maximum value at 333 K. Above 333 K, the relaxation time distribution narrows. The relaxation of the dipoles in grains and grain boundaries appears to approach identical relaxation times as the temperature rises, and both distributions progressively overlap, resulting in a small relaxation time breadth at high temperatures. In contrast, when the temperature drops below 358 K, the difference between the distribution of relaxation times owing to dipoles at the grains and grain boundary regions appears, resulting in a broader variety of relaxation times at 333 K. A further decrease in temperature freezes the grain boundary relaxation processes, resulting in a narrowing of the relaxation time distribution (i.e., a drop in the value of α).74
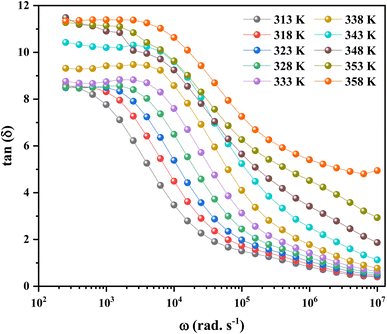
On the contrary, it was absolutely crucial to study in the materials for applications in optoelectronics the “dissipation factor” which is represented by tan(δ) in Fig. 13, where δ is mathematically defined as the angle between the voltage and charging current, also known as “loss angle”.75 The dielectric loss was mainly due to different physical phenomena, such as the conduction process, the dielectric relaxation, the molecular dipole moment, and the interfacial polarization.76
In the low frequency range, more energy is required to produce charge carrier movement. As a result, tan(δ) values are higher in this frequency range.77 The resistivity of the material reduces with increasing frequency, so the movement of charge carriers consumes less energy. As a result, the dielectric loss in the high frequency area decreases. This paved the way for these materials to be considered for use in electrical devices.78
It also shows that higher temperatures and lower frequencies result in more dielectric loss, which exhibits a clear sign of the growth in the conductivity of the material.79
The complex polarizability α, put out by Scaife,80 was the subject of attention in order to better comprehend the processes of dielectric relaxation. This makes it possible to investigate a compound's inherent dielectric characteristics more thoroughly since it gives each polarisation process the attention it deserves. In fact, different coexisting relaxation processes in a sample might be easily distinguished by employing this formalism. As a result, the complex polarizability is described as:
 | (13) |
 | (14) |
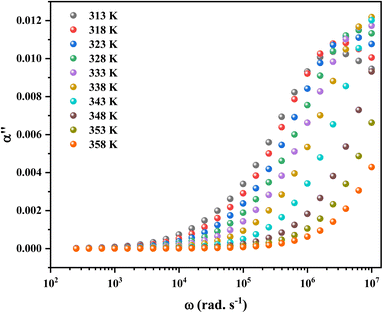
Fig. 14 shows the imaginary part of the complex polarizability as a function of frequency and temperature. As the temperature rises, this displays relaxation peaks with a maximum frequency ωαM that shift toward a high frequency (see Fig. S2†). This variation displays the Arrhenius behaviour:
 | (15) |
The study of electrical modulus provides insight into the electrode effect, grain boundary effect, grain characteristics, conductivity, and relaxation behaviour of the material. This technique is also useful to understand its transport process and relaxation mechanism.
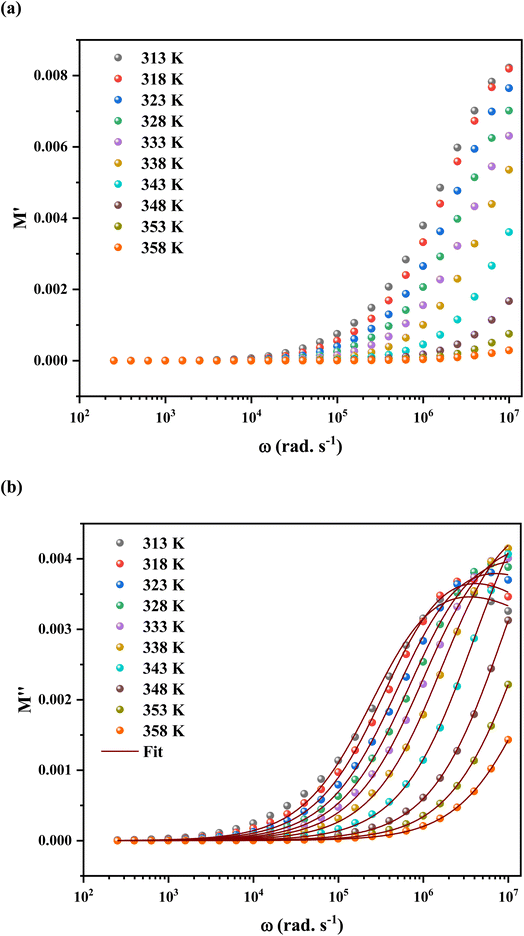
The complex electric modulus is represented by the equation: M = M′ + iM′′. The following formula82 has been used to determine M′:
 | (16) |
Fig. 15a depicts the frequency dependence of the real components of the modulus spectra (M′(T, f)) between 313 and 358 K. At all temperatures, the value of M′ increases as frequency increases. At low frequencies, M′ approaches 0, proving that there is no electrode influence. The M′ value falls in this region (low frequency) and gradually rises with increasing frequency because the electric field formed is insufficient to provide the necessary restoring force for the movement of the charge carriers. As a result, the conduction process is brought on by the short-range mobility of charge carriers.83
The same formula has been used to estimate M′′:
 | (17) |
Fig. 15b shows the curve of M′′ with frequency at various temperatures. The value of M′′ rose steadily as frequency increased, peaked  and then rapidly fell, as shown in this chart. The peak shifting toward a higher frequency with rising temperature indicates the presence of the relaxation process. A change in capacitance is shown by the variation in
  value with temperature. The asymmetrical broadening of the peak, which denotes non-Debye type conduction events, indicates the transmission of relaxation in the material.84
Following the expression in eqn (18) below, which applies the complex electric modulus Laplace transformation, we performed the analysis of the M′′ data's frequency dependency, which is shown below:
 | (18) |
The relaxation function φ(t) provides details on the temporal evolution of the electric field (E) within the compound,85 while M∞ (=1/ε∞) in the preceding formula reflects the inverse of the real component ε∞ of the dielectric permittivity's high frequency asymptotic value.
It is clear that the asymmetrical plots in Fig. 15b offer indications of the non-exponential behavior of the electrical modulus characterized by a non-exponential decay function and the Kohlrausch–Williams–Watts (KWW) parameter, which is written as:86,87
 | (19) |
 | (20) |
 is the imaginary portion of the M peak value with a matching frequency of ωmax. The red solid lines in Fig. 15b represents the nonlinear fitting of the aforementioned formula to the empirically determined modulus values for the system under inquiry. The corresponding parameters extrapolated from the fitting are shown in Table 6. The values of β range from 0.65 to 0.92, indicating that non-Debye type relaxation processes predominate in this system.
| T (K) | (×10−3) | β | ωmax (×106) | τ0 (×10−6) |
|---|---|---|---|---|
| 313 | 3.46 | 0.293 | 3.509 | 1.789 |
| 318 | 3.65 | 0.325 | 4.133 | 1.519 |
| 323 | 3.79 | 0.291 | 7.107 | 0.883 |
| 328 | 3.96 | 0.261 | 12.19 | 0.514 |
| 333 | 4.13 | 0.246 | 19.38 | 0.323 |
| 338 | 4.42 | 0.255 | 30.33 | 0.207 |
| 343 | 5.59 | 0.065 | 942.6 | 6.662 × 10⁻³ |
| 348 | 5.85 | 0.043 | 4802 | 1.307 × 10⁻³ |
| 353 | 5.6 | 0.041 | 9220 | 6.811 × 10⁻⁴ |
| 358 | 4.33 | 0.039 | 13![[thin space (1/6-em)]](https://www.rsc.org/images/entities/char_2009.gif) 330 330 |
4.708 × 10⁻⁴ |
In order to better understand material properties and their importance in optoelectronic devices, as well as to learn more about the nature of the transport mechanism and to comprehend how charge carriers interact, the electrical conductivity behavior was examined.89 The following law was used by Jonscher's to try and explain how ac conductivity behaves.90
| σac(ω) = σ(0) + σ1(ω) = σdc + Aωs | (21) |
The ac conductivity versus frequency plots (usually referred to as conductivity spectra) for 2A5PFeCl4 at various temperatures are presented in Fig. 16. Free as well as bound carriers can cause frequency dependence in ac conductivity. If the conduction is caused by free carriers, then the σac must decrease as the frequency rises91 Because the measured ac conductivity decreased when the frequency was reduced in our example, the observed ac conductivity must be related to the bound carriers trapped in the sample. The Schottky barrier at the metal–dielectric interface, Maxwell–Wagner type conduction, and hopping conduction91 can all be used to explain the phenomenon of increased conductivity with increasing frequency. The disordering of cations between neighboring sites, i.e., neighboring grains and their boundaries, as well as the presence of space charges, may explain the positive slope of ac conductivity with frequency.
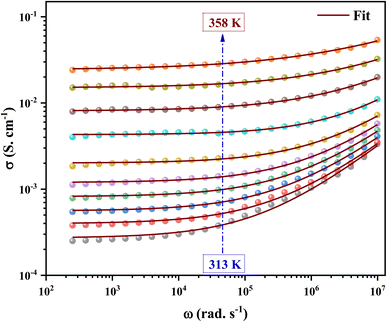 | ||
| Fig. 16 The variation of the electrical conductivity versus the frequency at different temperatures. | ||
A closer look at the conductivity plots reveals that the curves show high-frequency dispersion that follows Jonscher's power law equation (eqn (21)). According to Jonscher, the relaxation processes caused by mobile charge carriers are the source of conductivity's frequency dependency. A mobile charge remains in a condition of displacement between two potential energy minima when it jumps to a new site from its original location.92
In addition, the material conduction behavior follows a power law, σac ∝ ωs, with a slope shift governed by s. The parameter s describes the interaction between the charge carriers involved in the polarization process. The interaction, on the other hand, increases as the temperature rises, resulting in a drop in s from 0.62 to 0.30 (right of Fig. 17), suggesting the correlated barrier hopping (CBH) conduction mechanism. In addition, these numbers imply that the system is far from being in a Debye type state (s = 1).93 However, at 313 K, the dc conductivity of the C6H9N2FeCl4 was in the order of 10−4 S cm−1, which was comparable to the perovskites C3H7NH3PbI3.94 As a consequence, the high dielectric permittivity and electrical conductivity evaluations resulted in better conducting capabilities, indicating that this material might be used in FET devices.
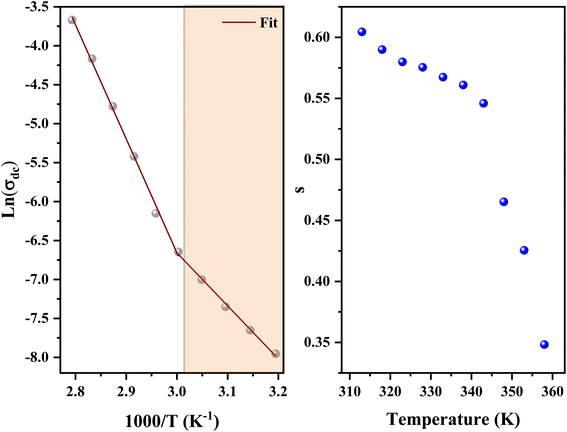 | ||
| Fig. 17 Variation of ln(σdc) vs. (1000/T) (left) and the variation of the exponents as a function of temperature (right). | ||
The data of dc conductivity is displayed as ln(σdc) vs. 1000/T at the temperature range of 313–358 K (left of Fig. 17), revealing Arrhenius type behavior as indicated by:
 | (22) |
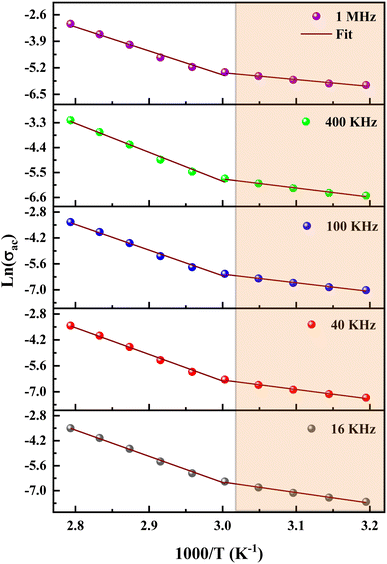
The dc conductivity increases as the temperature rises. In addition, we can see two regions associated with two activation energies, Ea1 = 0.58 eV in the range [313–333 K] and Ea2 = 1.23 eV in the range [343–358 K]. On the other hand, the deduced activation energies from the ac conductivity as a function of reciprocal temperature for five fixed frequencies (Fig. 18) are listed in Table 7. It's worth noting that when the frequency rises, the activation energies of both temperature areas drop. This supports the idea that increasing the applied field frequency enhances the electrical hops between localized states. Furthermore, the ac conduction activation energies at high frequencies are shown to be smaller than those at low frequencies. This is due to the fact that at high frequencies, the conductivity is taken up by the mobility of charge carriers over short distances and needs less energy than the one necessary for mobility over longer distances at low frequencies.56
| f | Ea1 (eV) | Ea2 (eV) |
|---|---|---|
| 16 kHz | 0.5 | 1.22 |
| 40 kHz | 0.44 | 1.20 |
| 100 kHz | 0.4 | 1.16 |
| 400 kHz | 0.34 | 1.06 |
| 1 MHz | 0.28 | 0.99 |
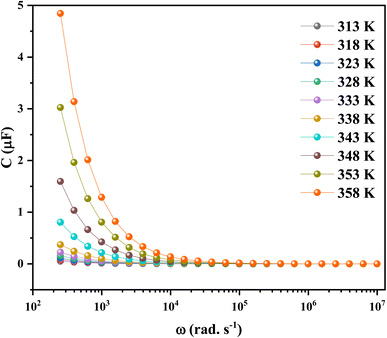
To conclude the study of the dielectric properties of the studied compound, capacitance measurements were done at the same frequencies and temperatures. The behavior of capacitance as the angular frequency increases from 102 to 107 rad s−1 at temperatures ranging from 313 to 358 K is shown in Fig. 19. It can be clearly seen that the capacitance curve decreases with increasing frequency, and the maximum values are found at low frequencies. This capacitive characteristic indicates an inhomogeneous barrier formation at the interface due to the presence of interface states. These states can result in the creation of an interfacial space charge at the interface.95,96 The contribution of the ionic capacitance decreased with the drop in temperature. However, at high frequencies, the capacitance became saturated and plateaued. This was attributed to the contribution of the external circuit's resistance in series, as well as the geometric capacitance of the pellet, which was related to the permittivity as shown in eqn (23):97
 | (23) |
5. Conclusion
In summary, the 2A5PFeCl4 compound was successfully prepared through the slow evaporation solution growth method at room temperature, and its structural, optical, and extensive dielectric properties are investigated. The structural geometry was optimized using the DFT/B3LYP-D3 method. The structural parameters are in good agreement with the experimental data. The absorption spectra have been recorded and simulated at the TD/B3LYP-D3/lanl2dz level of theory. As a result, there is good agreement between theoretical absorption and experimental spectra.UV-vis spectral analysis allows for the exploration of the optical characteristics of the title compound and the determination of a band gap energy of 2.47 eV. Hirshfeld surface analysis demonstrated that hydrogen bonding interactions are primarily responsible for the structure packing's stabilization. The AIM and NCI-RDG topological analyses prove that the interactions between the organic and inorganic parts are mainly of the van der Waals type. The MEP surface ascertains the donor–acceptor interactions within the title compound, showing the electrophilic and nucleophilic sites.
The huge dielectric permittivity, strong capacitance, high conductivity, and low dielectric loss of this material make it highly tunable for FET applications as compared to other dielectric materials. They might be used as semiconductors, dielectric gates, or active channels in novel transistor devices due to their better dielectric properties. The findings of our research help to explain why the C6H9N2FeCl4 has such good dielectric properties. More specifically, our research outlined the benefits as well as the efficacy of these materials in FET applications. However, knowing the underlying electrical characteristics of these materials is required for future views on developing and achieving low-cost and high-performance FET devices based on them.
Conflicts of interest
The authors declare no competing interests.References
- M. Mas-Torrent and C. Rovira, Chem. Rev., 2011, 111, 4833–4856 CrossRef CAS PubMed.
- J. Park, H. H. Nguyen, A. Woubit and M. Kim, Appl. Sci. Convergence Technol., 2014, 23, 61–71 CrossRef CAS.
- J. Y. Tsao, S. Chowdhury, M. A. Hollis, D. Jena, N. M. Johnson, K. A. Jones and J. A. Simmons, Adv. Electron. Mater., 2018, 4, 1600501 CrossRef.
- B. Crone, A. Dodabalapur, Y. Y. Lin, R. W. Filas, Z. Bao, A. La Duca and W. Li, Nature, 2000, 403, 521–523 CrossRef CAS PubMed.
- R. P. Ortiz, A. Facchetti and T. J. Marks, Chem. Rev., 2010, 110, 205–239 CrossRef CAS PubMed.
- A. I. Kingon, J. P. Maria and S. K. Streiffer, Nature, 2000, 406, 1032–1038 CrossRef CAS PubMed.
- J. M. Ramirez, H. Elfaiki, T. Verolet, C. Besancon, A. Gallet, D. Néel and M. Achouche, IEEE J. Sel. Top. Quantum Electron., 2019, 26, 1–13 Search PubMed.
- S. P. Senanayak, M. Abdi-Jalebi, V. S. Kamboj, R. Carey, R. Shivanna, T. Tian and H. Sirringhaus, Sci. Adv., 2020, 6, eaaz4948 CrossRef CAS PubMed.
- S. Hajlaoui, I. Chaabane, A. Oueslati, K. Guidara and A. Bulou, Spectrochim. Acta, Part A, 2014, 117, 225–233 CrossRef CAS PubMed.
- B. Yan, J. W. Wang and Y. J. Li, J. Alloys Compd., 2011, 509, 9240–9245 CrossRef CAS.
- L. H. Oliveira, A. P. de Moura, E. Longo, J. A. Varela and I. L. Rosa, J. Alloys Compd., 2013, 579, 227–235 CrossRef CAS.
- C. Ji, P. Wang, Z. Wu, Z. Sun, L. Li, J. Zhang, W. Hu, M. Hong and J. Luo, Adv. Funct. Mater., 2018, 28, 1705467 CrossRef.
- Q. Zhang, S. T. Ha, X. Liu, T. C. Sum and Q. Xiong, Nano Lett., 2014, 14, 5995–6001 CrossRef CAS PubMed.
- C. Geffroy, E. Grana, T. Bessho, S. Almosni, Z. Tang, A. Sharma, T. Kinoshita, F. Awai, E. Cloutet, T. Toupance, H. Segawa and G. Hadziioannou, ACS Appl. Energy Mater., 2020, 3, 1393–1401 CrossRef CAS.
- H. Wensi Cai, Sci. Bull., 2021, 66, 648 CrossRef PubMed.
- N. D. Canicoba, N. Zagni, F. Liu, G. Mccuistian, K. Fernando, H. Bellezza and A. D. Mohite, ACS Mater. Lett., 2019, 1, 633–640 CrossRef CAS.
- E. J. Juarez-Perez, R. S. Sanchez, L. Badia, G. Garcia-Belmonte, Y. S. Kang, I. Mora-Sero and J. Bisquert, J. Phys. Chem. Lett., 2014, 5, 2390 CrossRef CAS PubMed.
- C. R. Kagan, D. B. Mitzi and C. D. Dimitrakopoulos, Science, 1999, 286, 945 CrossRef CAS PubMed.
- M. Tahenti, S. Gatfaoui, N. Issaoui, T. Roisnel and H. Marouani, J. Mol. Struct., 2020, 1207, 127781 CrossRef CAS.
- A. Oueslati, A. Bulou, F. Calvayrac, K. Adil, M. Gargouri and F. Hlel, Vib. Spectrosc., 2013, 64, 10–20 CrossRef CAS.
- M. Hamdi, S. Karoui, A. Oueslati, S. Kamoun and F. Hlel, J. Mol. Struct., 2018, 1154, 516–523 CrossRef CAS.
- L. J. Farrugia, J. Appl. Crystallogr., 2012, 45, 849e854 CrossRef.
- K. Brandenburg and H. Putz, DIAMOND Crystal Impact GbR, Bonn, Germany, 1999 Search PubMed.
- M. J. Frisch, W. Trucks, G. H. B. Schlegel, G. E. Scuseria, M. A. Robb and J. R. G. Cheeseman, GAUSSIAN, 2009 Search PubMed.
- R. I. Dennington, T. Keith and J. Millam, GaussView, Version 5.0.8, Semichem. Inc., Shawnee Mission, KS, 2008 Search PubMed.
- A. D. Becke, J. Chem. Phys., 1996, 104, 1040–1046 CrossRef CAS.
- C. Lee, W. Yang and R. G. Parr, Phys. Rev. B: Condens. Matter Mater. Phys., 1988, 37, 785 CrossRef CAS PubMed.
- S. Grimme, J. Antony, S. Ehrlich and H. Krieg, J. Chem. Phys., 2010, 132, 154104 CrossRef PubMed.
- P. J. Hay and W. R. Wadt, J. Chem. Phys., 1985, 82, 299 CrossRef CAS.
- M. A. Spackman and D. Jayatilaka, Cryst. Eng. Comm., 2009, 11, 19–32 RSC.
- H. Wang, H. Xiao, N. Liu, B. Zhang and Q. Shi, Open J. Inorg. Chem, 2015, 5, 63 CrossRef CAS.
- T. Lu and F. Chen, J. Comput. Chem., 2012, 33, 580–592 CrossRef CAS PubMed.
- I. B. Gharbia, R. Kefi, C. B. Nasr and A. Durif, Rev. Roum. Chim., 2008, 53, 169–175 Search PubMed.
- L. Yang, D. R. Powell and R. P. Houser, Dalton Trans, 2007, 9, 955–964 RSC.
- W. H. Baur, Acta. Crystallogr., B: Struct. Sci., Cryst. Eng. Mater., 1974, 30, 1195–1215 CrossRef CAS.
- R. Elwej and F. Hlel, Phys. E, 2016, 84, 498–504 CrossRef CAS.
- N. A. Dlala, Y. Bouazizi, H. Ghalla and N. Hamdi, J. Chem., 2021, 12, 1–17 Search PubMed.
- R. F. Bader, Atoms in Molecules a, Quantum Theory (AIM), 1990 Search PubMed.
- T. B. Issa, F. Sayari, H. Ghalla and L. Benhamada, J. Mol. Struct., 2019, 1178, 436–449 CrossRef CAS.
- P. L. A. Popelier and R. F. W. Bader, Chem. Phys. Lett., 1992, 189, 542–548 CrossRef CAS.
- X. Niu, Z. Huang, L. Ma, T. Shen and L. Guo, Chem. Sci. J., 2013, 125, 949–958 CrossRef CAS.
- F. J. Luque, J. M. López and M. Orozco, Theor. Chem. Acc., 2000, 103, 343–345 Search PubMed.
- N. Okulik and A. H. Jubert, Internet Electron. J. Mol. Des., 2005, 4, 17–30 Search PubMed.
- K. Y. Shi, L. L. Guo, H. X. Liu, L. Zou and S. F. Ying, Solid State Phenom., 2006, 111, 119–122 CAS.
- C. Zhou, X. Yu, H. Ma, X. Huang, H. Zhang and J. Jin, Carbohydr. Polym., 2014, 105, 300–307 CrossRef CAS PubMed.
- H. L. Friedman, J. Am. Chem. Soc., 1952, 74, 5–10 CrossRef CAS.
- T. Backer, O. Breunig, M. Valldor, K. Merz, V. Vasylyeva and A. V. Mudring, Cryst. Growth Des., 2011, 11, 2564–2571 CrossRef CAS.
- R. E. Marotti, D. N. Guerra, C. Bello, G. Machado and E. A. Dalchiele, Sol. Energy Mater. Sol. Cells, 2004, 82, 85–103 CrossRef CAS.
- R. Henrıquez, P. Grez, E. Munoz, H. Gomez, J. A. Badan, R. E. Marotti and E. A. Dalchiele, Thin Solid Films, 2010, 518, 1774–1778 CrossRef.
- P. Kubelka and F. Munk, Z. Phys., 1931, 12, 593–601 Search PubMed.
- I. B. Saad, N. Hannachi, T. Roisnel and F. Hlel, J. Adv. Dielectr., 2019, 9, 1950040 CrossRef.
- M. Belletête, J. F. Morin, M. Leclerc and G. Durocher, J. Phys. Chem., 2005, 109, 6953–6959 CrossRef PubMed.
- N. Mhadhbi, S. Saïd, S. Elleuch and H. Naïli, J. Mol. Struct., 2016, 1108, 223–234 CrossRef CAS.
- S. Y. Ebrahimipour, M. Khosravan, J. White and S. Fekri, Appl. Organomet. Chem., 2018, 32, e4233 CrossRef.
- Y. Dang, C. Zhong, G. Zhang, D. Ju, L. Wang, S. Xia and X. Tao, Chem. Mater., 2016, 28, 6968–6974 CrossRef CAS.
- W. B. Weir, Proc. IEEE, 1974, 62, 33–36 Search PubMed.
- T. Dabbebi, S. Hcini, B. Alzahrani, H. Rahmouni, E. Dhahri, H. AlRobei and M. L. Bouazizi, J. Mater. Sci.: Mater. Electron., 2022, 33, 490–504 CrossRef CAS.
- F. Hcini, S. Hcini, B. Alzahrani, S. Zemni and M. L. Bouazizi, Appl. Phys. A, 2020, 126, 362 CrossRef CAS.
- A. Sahoo, T. Paul, S. Maiti and R. Banerjee, Nanotechnology, 2022, 33, 195703 CrossRef PubMed.
- K. W. Wagner, Ann. Phys., 1913, 4, 817 CrossRef.
- S. Kumari, N. Ortega, A. Kumar, S. P. Pavunny, J. W. Hubbard, C. Rinaldi and R. S. Katiyar, J. Appl. Phys., 2015, 117, 114102 CrossRef.
- S. Patra, P. Sengupta, A. Ray, A. Roy and S. Das, Ceram. Int., 2018, 44, 14236–14241 CrossRef CAS.
- G. A. Samara, Phys. Rev. B: Condens. Matter Mater. Phys., 1983, 27, 3494 CrossRef CAS.
- Q. Li, R. Cao, J. Cho and G. Wu, Adv. Energy Mater., 2014, 4, 1301415 CrossRef.
- Z. Fu, X. Zhang, H. Zhang, Y. Li, H. Zhou and Y. Zhang, Chin. J. Chem., 2021, 39, 381 CrossRef CAS.
- J. Gao, Y. Wang, Y. Liu, X. Hu, X. Ke, L. Zhong and X. Ren, Sci. Rep., 2017, 7, 1 CrossRef PubMed.
- M. Ahmadi, T. Wu and B. Hu, Adv. Mater., 2017, 29, 1605242 CrossRef PubMed.
- Y. C. Hsiao, T. Wu, M. Li, Q. Liu and W. B. Hu, J. Mater. Chem. A., 2015, 3, 15372 RSC.
- A. Daus, C. Roldan-Carmona, K. Domanski, S. Knobelspies, G. Cantarella, C. Vogt and G. Troster, Adv. Mater., 2018, 30, 1707412 CrossRef PubMed.
- C. R. Kagan, D. B. Mitzi and C. D. Dimitrakopoulos, Science, 1999, 286, 945 CrossRef CAS PubMed.
- K. S. Cole and R. H. Cole, J. Chem. Phys., 1941, 9, 341–351 CrossRef CAS.
- A. Ghoudi, K. B. Brahim, A. Oueslati, K. Khirouni and A. Aydi, J. Mater. Sci.: Mater. Electron., 2022, 1–15 Search PubMed.
- D. Ming, J. M. Reau, J. Ravez, J. Gitae and P. Hagenmuller, J. Solid State Chem., 1994, 116, 185–192 CrossRef.
- V. Khopkar and B. Sahoo, Phys. Chem. Chem. Phys., 2020, 22, 2986–2998 RSC.
- P. Bhuyan, D. Cho, M. Choe, S. Lee and S. Park, Polymers, 2022, 14, 710 CrossRef CAS PubMed.
- K. C. Kao, Dielectric Phenomena in Solids, Elsevier, Amsterdam, 2004 Search PubMed.
- F. Gaâbel, M. Khlifi, N. Hamdaoui, L. Beji, K. Taibi and J. Dhahri, J. Mater. Sci.: Mater. Electron., 2019, 30, 14823–14833 CrossRef.
- S. Singh, G. Banappanavar and D. Kabra, ACS Mater. Lett., 2020, 5, 728 CAS.
- W. Wan, J. Luo, C.-e. Huang, J. Yang, Y. Feng, W.-X. Yuan, Y. Ouyang, D. Chen and T. Qiu, Ceram. Int., 2018, 44, 5086–5092 CrossRef CAS.
- B. K. P. Scaife, Proc. Phys. Soc., 1963, 81, 124 CrossRef CAS.
- I. B. Slima, K. Karoui, A. Mahmoud, F. Boschini and A. B. Rhaiem, RSC Adv., 2022, 12, 1563–1570 RSC.
- C. Rayssi, S. E. Kossi, J. Dhahri and K. Khirouni, RSC Adv., 2018, 8, 17139–17150 RSC.
- R. Das and R. N. P. Choudhary, Solid State Sci., 2019, 87, 1–8 CrossRef CAS.
- R. Ranjan, R. Kumar, N. Kumar, B. Behera and R. N. P. Choudhury, J. Alloy. Comp., 2011, 509, 6388 CrossRef CAS.
- I. M. Hodge and C. A. Angell, J. Chem. Phys., 1977, 67, 1647–1658 CrossRef CAS.
- K. L. Ngai, J. Non-Cryst. Solids, 1996, 203, 232–245 CrossRef CAS.
- J. Hazarika and A. Kumar, Synth. Met., 2014, 198, 239–247 CrossRef CAS.
- R. Bergman, J. Appl. Phys., 2000, 88, 1356–1365 CrossRef CAS.
- A. Starczewska, B. Toron, P. Szperlich and M. Nowak, Materials, 2021, 14, 2579 CrossRef CAS PubMed.
- A. K. Jonscher, Nature, 1977, 276, 673–679 CrossRef.
- R. Thomas, V. K. Varadan, S. Komarneni and D. C. Dube, J. Appl. Phys., 2001, 90, 1480–1488 CrossRef CAS.
- P. R. Das, B. N. Parida, R. Padhee and R. N. P. Choudhary, J. Adv. Ceram., 2013, 2, 112–118 CrossRef CAS.
- W. K. Lee, J. F. Liu and A. S. Nowick, Phys. Rev. Lett., 1991, 67, 1559–1561 CrossRef CAS PubMed.
- P. Sengupta, P. Sadhukhan, A. Ray, R. Ray, S. Bhattacharyya and S. Das, J. Appl. Phys., 2020, 127, 204103 CrossRef CAS.
- G. R. Neupane, M. Bamidele, V. Yeddu, D. Y. Kim and P. Hari, J. Mater. Res., 2022, 37, 1357–1372 CrossRef CAS.
- H. H. Gullu and D. E. Yildiz, J. Mater. Sci.: Mater. Electron., 2021, 32, 13549–13567 CrossRef CAS.
- Y. Zheng, A. Fischer, N. Sergeeva, S. Reineke and S. C. Mannsfeld, Org. Electron., 2019, 65, 82 CrossRef CAS.
Footnote |
| † Electronic supplementary information (ESI) available. CCDC 2223635. For ESI and crystallographic data in CIF or other electronic format see DOI: https://doi.org/10.1039/d3ra01239e |
| This journal is © The Royal Society of Chemistry 2023 |

