 Open Access Article
Enhanced electrochromic properties of WO3/ITO nanocomposite smart windows
Feng Hui Ana,
Yu Zheng Yuanb,
Jian Qiang Liu *c,
Meng Dong Heb and
Bo Zhangd
aJiangxi Province Engineering Research Center of Material Surface Remanufacturing, Jiujiang University, Jiujiang, Jiangxi 332005, China
bInstitute of Mathematics and Physics, Central South University of Forestry and Technology, Changsha 410004, China
cCollege of Science, Jiujiang University, Jiujiang, Jiangxi 332005, China. E-mail: jqliu2007@163.com
dEnergy Materials Computing Center, School of Energy and Mechanical Engineering, Jiangxi University of Science and Technology, Nanchang 330013, China
First published on 28th April 2023
Abstract
Tungsten oxide is regarded as the most promising electrochromic material owing to its continuously tunable optical properties, low cost, and high coloration efficiency. Further improving its optical modulation, switching speed, and coloration efficiency is important to electrochromic smart windows and related devices. Here, we demonstrate an enhanced electrochromic film composed of a WO3 nanosheet and ITO nanoparticles developed by an all-solution technology. The WO3 nanosheet is fabricated by an acid-assisted hydrothermal process with high product efficiency. The introduction of an ITO into the WO3 nanosheets significantly improved the electrochemical activity and the conductivity of the composite film. Compared with a reported electrochromic film without ITO doping, our synthesized composite WO3 film exhibited optical modulation up to 88% and a high coloration efficiency of 154.16 cm2 C−1. Particularly, our electrochromic film was based on the dispersant solution and spin-coating technology, which may also be realized with nano-spray coating for large scale applications. The results offer an effective way to develop large-area electrochromic film and devices.
1. Introduction
Electrochromic (EC) devices can change in reflectance and transmittance in the range of visible and near infrared wavelength regions based on the redox reaction as a response to an external voltage. It has received much attention in the smart windows, sensors, and energy storage technologies,1–3 etc. Tungsten oxide (WO3) is the most promising electrochromic material due to its outstanding optical properties, including fast switching speed, high coloration efficiency, and low-cost preparation process.4–6 Currently, the major problem in the field of electrochromic materials7–9 and devices is to further improve the contrast, coloration efficiency (CE), switching speed, and cycling life stability. In the past decades, researchers have proposed a number of strategies, such as constructing nanostructure,10,11 regulating crystallinity,12,13 and doping modifications,14,15 to improve the EC performance based on WO3. For example, various nanostructured WO3, such as nanodots,16 nanowires,17 nanorods,18 and nanosheets,19,20 have been fabricated by liquid phase method. Yao et al. prepared a WO3 quantum-dot (QD) film by a common atmospheric pressure solution-based deposition (APSD) method, showing a huge optical modulation in the visible and near-infrared range.21 Lavi et al. proposed an effective method to enhance tungstate oxide EC via the formation of a transparent conductive network by adding indium tin oxide (ITO) nanoparticles onto a WO3 film.22 Recently, Gao et al. experimentally showed higher optical modulation and faster switching speed by preparing hexagonal WO3 nanorod and ITO composite films.23 The architecture of ITO nanocrystals embedded in amorphous WO3 with improved electrochromic performance was reported by Zhang et al.24Compared with the one-dimensional (1D) WO3 nanostructure, two-dimensional (2D) nanostructures, such as nanosheets and nanoflakes, have a larger surface area and stability, indicating more active electrochemical property and better EC characteristics. Most recently, a strategy of compositing amorphous WO3 on crystalline WO3 nanosheets14 was proposed to improve the cyclic stability of EC devices. A. Azam et al. reported a novel solution-phase synthesis of 2D WO3 nanosheets19 through oxidation from 2D tungsten disulfide (WS2) nanosheets, exhibiting a greater color modulation of 62.57% at 700 nm wavelength compared to the conventional device and an enhancement of the response time. However, the properties, including optical modulation, coloration efficiency, and response time, for such EC devices based on WO3 nanosheets could be further improved.
Here, we prepared monoclinic WO3 nano-sheet by hydrothermal method and coated WO3/ITO composite film through spin coating on the ITO glass substrate. Remarkably, larger optical modulation, faster switching speed, and higher coloration efficiency are observed by adding ITO particles into the as-prepared monoclinic WO3 nano-sheet film. Our experimental results provide another way to develop EC devices and smart windows with excellent optical properties.
2. Experimental section
2.1 Preparation of WO3 nanosheets
WO3 nanosheets were synthesized with assisted (H2SO4) hydrothermal process under a relatively low temperature acid. The main chemicals used for the present work such as Na2WO4·2H2O, AlCl3·6H2O are AR grades from Aladdin Reagent (Shanghai) Co., Ltd. Ethanol and PEG-600 were brought from Chinese Medicine Group Chemical Reagent Co., Ltd. The dispersant used in this work, BYK-2013, was purchased from BYK-Chemie® Inc. ITO nanoparticles and glasses with ITO were purchased from Nangong Bole Metal Materials Co., Ltd., and Luoyang Shangzhuo Technology Co., Ltd., respectively. All chemical reagents used in the experiment were of analytical grade without further purification.In a typical synthesis of WO3 nanosheets,25 2.64 g Na2WO4·2H2O was firstly dissolved in 80 ml distilled water contained in a 100 ml beaker with 10 minutes stirring under room temperature, then 80 ml H2SO4 (98%) was dropped into the above solution under vigorous stirring. In this process, the solution gradually changed color from transparent to yellow, indicating that H2WO4 was formed. Then, the solution was heated to 160 °C for 4.5 h in an oil bath. After cooling to room temperature, the prepared product powders were centrifuged and washed alternately with distilled water and ethanol 3 times, respectively. Finally, the WO3 powder was dried at 60 °C for 12 h and the yellow WO3 nanosheet powder was obtained.
2.2 Preparation of the WO3/ITO dispersant solution and EC composite film
Firstly, 0.27 g polyethylene glycol and BYK2013 (0.18 g) were added into an ethanol solution (8.55 g), then the WO3 nanopowders and ITO nanoparticles were weighed according to the composition of Y (Y = ITO/WO3, 0%, 8%, 16% and 24% in weight), respectively. The total amount of ITO and WO3 is fixed at around 10 g. Then, the mixture was milled with 0.5 mm ZrO2 beads for 6 h at 1000 rpm, producing the dispersed mixture of WO3 and ITO nanoparticles.The glass substrates (25 mm × 12.5 mm × 1.6 mm) with ITO were cleaned under ultrasonic process by isopropyl alcohol, acetone, and deionized water, respectively. After the cleaning process, the ITO glasses were dried for several minutes. WO3 nanosheet dispersions (200 μl each sample) with different ITO content were coated on processed ITO glass (ITO film/glass) by spin-coating method with a 4000 rpm rate. At last, all of the samples were annealed at 300 °C for 1 h to form better contact between composite films and ITO substrates. The prepared transparent EC films with the 0%, 8%, 16% and 24% ITO are denoted according to the following nomenclature, Y0, Y8, Y16 and Y24, respectively.
The schematic of the measurement experimental setup is shown in Fig. 1(a). In the process of measurement, the quartz cell and reference quartz cell shown in Fig. 1(b), were placed into a UV-Vis spectrophotometer.7,10,26 At the same time, the square wave power was supplied by the electrochemical workstation from −0.7 V to +0.7 V. The transmittance of the thin film shown in Fig. 1(c) was recorded by a UV-Vis spectrophotometer and processed by a computer.
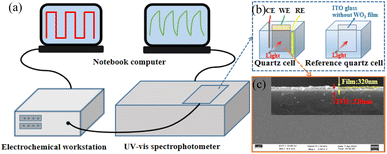 | ||
| Fig. 1 (a) Schematic representation of the experimental setup, (b) quartz cell, and (c) the top-view and cross-sectional (inset) SEM images of the WO3/ITO thin film. | ||
2.3 Characterization
The crystal phase of the samples was measured by X-ray diffraction (XRD) (3 kW, D8 ADVANCE, Bruker Corporation, Germany) using a copper K-alpha source. The surface morphology of the WO3/ITO films after annealing were characterized by scanning electron microscopy (SEM, Sigma 300, Zeiss Oberkochen, Germany). The optical transmittance of films was measured by UV-Vis spectrophotometer (UV1901PC, Shanghai AuCy Scientific Instrument, Shanghai). The in situ spectroelectrochemical measurements were carried out in a quartz cell containing 1 M AlCl3 in H2O20,27,28 placed in an electrochemical workstation (CS 350, Wuhan Corrtest Instrument, Wuhan) using a three-electrode system consisting of a standard Ag/AgCl electrode as the reference electrode, a platinum plate as the counter electrode, and the fabricated WO3 films on ITO glass as the working electrode. Electrochemical impedance spectroscopy (EIS) measurements were conducted on an electrochemical workstation by applying an amplitude sinusoidal voltage of 10 mV in the frequency range of 0.01–100 kHz. The transmittance, optical modulation, and cycling stability measurement were carried out by combining a UV-Vis spectrophotometer and electrochemical workstation.3. Results and discussion
Fig. 2(a) and (b) show the measured XRD patterns of the prepared WO3 nanosheets with 16% ITO content and its field emission scanning electron microscopy (SEM) image. The two lines displayed at the bottom of Fig. 2(a) correspond to WO3 (JCPDS no. 87-2385) and In2O3 (JCPDS no. 65-3170), respectively. The blue and red cures denote the XRD spectrophotometer for the WO3 nanosheet powder with ITO contents of 0% and 16%, respectively. The Bragg peaks of the red and blue curves clearly show the monoclinic WO3 crystal faces indexed as (0 0 2), (1 1 0), (0 1 2), (2 0 0), (1 1 2), (0 2 2), (2 2 0), (3 1 0). Comparing the curves shown in Fig. 2(a), it is clear that ITO has been successfully mixed into the monoclinic WO3 powder. Fig. 2(b) exhibits the square morphology of the ITO-doped WO3 nanosheets with size distributions of about 200–500 nm and thickness of around 100 nm.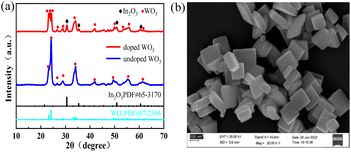 | ||
| Fig. 2 (a) The measured XRD pattern of the as-prepared WO3 nanosheet powder and WO3/ITO EC film. (b) SEM image of WO3 with doped 16% ITO nanoparticles. | ||
To better understand the electrochemical behavior, we performed cyclic voltammetry (CV) and impedance (EI) spectroscopy measurements, shown in Fig. 3(a) and (b), respectively. The CV measurement was performed in 1 M AlCl3·H2O at a sweep rate of 100 mV s−1 from −0.7 V to +0.7 V. As illustrated in Fig. 3(a), the cathodic current peaks are observed and the transparent films gained coloration with the reduction of W6+ → W5+ due to the Al3+ ion insertion in the films. Reversing the potential from −0.7 V to +0.7 V, these processes correspond to the oxidation of W5+ → W6+. In Fig. 2(a), the WO3/ITO nanocomposite films demonstrate a much larger area of CV and higher current density than the pure WO3 films (Y0). The areas enclosed by the CV curves become larger with increasing ITO concentration, indicating that more ions and electrons are involved at the interface between the WO3/ITO nanocomposite films and the electrolyte. The CV measurement illustrates an enhancement of the electrochemical activity related to the EC performances, originating from the introduction of ITO into the nanosheet structures with higher surface area than that of the WO3 nanorod.
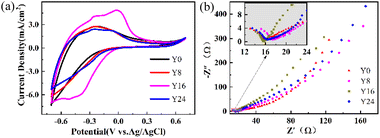 | ||
| Fig. 3 (a) CV curves of the samples measured in the potential range of −0.7 V to 0.7 V at a scan rate of 100 mV s−1 with a three-electrode system. (b) Nyquist plot of samples Y0, Y8, Y16, and Y24. | ||
Further evidence for the increased electric activity is demonstrated in Fig. 3(b) through the electrochemical impedance spectroscopy (EIS) measurements (Nyquist plot) by applying an amplitude sinusoidal voltage of 10 mV in the frequency range of 0.01–100 kHz. The curves show a semi-circle in high (inset of Fig. 3(b)) and skew cure in the low-frequency ranges. The slope of the curve in Fig. 3(b) corresponds to the ion diffusion in the process of intercalation/deintercalation of Al3+. The increase of the slope for samples Y0, Y8, Y16, and Y24 suggests that the conductivity is further increased23–25 due to the increased ITO concentration from Y0 to Y24, agreeing with the measured CV curves in Fig. 3(a).
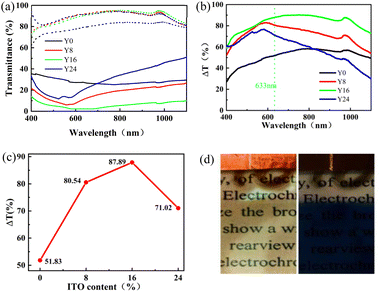
Fig. 4(a) and (b) illustrate the optical modulation for the prepared WO3 nanosheet with ITO concentrations varying from 0% to 24% (denoted with Y0, Y8, Y16, Y24) at the bleached and colored states in the optical wavelength range of 400–1100 nm. The glasses with ITO substrate have become more transparent (high transmission) in the bleached state with the addition of ITO nanoparticles into the WO3 nanosheet film. On the contrary, the composite WO3/ITO showed lower transmission in the colored state, except for sample Y24. Particularly, as shown in Fig. 4(b), the optical modulation rate ΔT is up to 87.89% at wavelength 633 nm, which is higher than many reported electrochromic devices.10,29–31 As illustrated in Table 1, the optical modulation has reached 90.28% around wavelength 749 nm. Fig. 4(c) plots the variation of the optical modulation ΔT with the content of ITO, suggesting that the optimized concentration of ITO in the WO3 nanosheet composite film is 16%. This optimized content of ITO is smaller than that of the reported 20% in the WO3 nanorod and ITO composite film23 due to the larger surface area in the prepared nanosheet morphology. The bleached (transparent) and colored (blue) states of the composite film with 16% ITO content are illustrated in Fig. 4(d), exhibiting the high contrast in the visible range. The switching process between the colored state and bleached state of the WO3/ITO films can be explained by the following EC reaction:27,28
| WO3 + xAl3+ + 3xe− ↔ AlxWO3 | (1) |
| Samples | Tb (%) | Tc (%) | ΔTI (%) | ΔTII (%) | MaxTb (%) | MaxTc (%) | MaxΔT (%) |
|---|---|---|---|---|---|---|---|
| Y0 | 79.23 | 29.4 | 51.83 | 48.57 | 84.35 | 25.1 | 58.44 |
| Y8 | 91.55 | 11.01 | 80.54 | 73.50 | 94.91 | 6.10 | 82.92 |
| Y16 | 90.23 | 2.34 | 87.89 | 55.57 | 95.39 | 2.27 | 90.28 |
| Y24 | 91.16 | 20.14 | 71.02 | 77.17 | 94.53 | 11.63 | 76.69 |
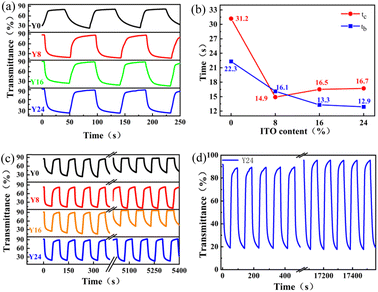
We now turn to the coloration and bleaching time (switching speed), which is an important criterion for the practical applications of EC films and devices. The switching speed is defined as the time required for 90% of the full optical transmittance contrast when the EC material is in the colored/beached state. The calculated results for different samples with ITO content from the measured transmission in Fig. 5(a) are shown in Fig. 5(b), where tb and tc correspond to the bleaching/coloration time, respectively. A remarkable shortening of the bleaching time is observed in Fig. 5(b) after introducing ITO nanoparticles to the WO3 film. Basically, the coloration times tc of the WO3/ITO nanocomposite films are longer than the bleaching time tb, indicating that the charge/Al3+ ion insertion process is more difficult than the extraction process. The shortest bleaching and coloration times are 14.9 s and 16.1 s, respectively, corresponding to 8% content of ITO nanoparticles at the composite film. As the content of ITO is 24%, the bleaching time tb is 12.9 seconds, which exceeds the reported responding time of the WO3 nanosheet.32,33 Therefore, the addition of ITO nanoparticles into the monoclinic WO3 nanosheet is an effective way to improve its switching speed. The underlying physical mechanism could be attributed to the increased conductivity of the WO3/ITO film due to the introduction of ITO nanoparticles.
Next, we focus on the cycling stability of the as-prepared samples. Fig. 5(c) shows the transmission spectra of all of the samples at 633 nm at an applied voltage from −0.7 V to +0.7 V for 50 cycles. It can be seen that the samples illustrate higher transmittance at the coloration state with the increase of the cycling times because a small amount of the WO3 powder drops from the glass substrate in the process of measurement. The most stable transmittance sample is Y24 (24% content of ITO), which exhibits almost the same transmittance at the coloration/bleaching state even after 180 cycles (Fig. 5(d)). This phenomenon shows that the film becomes a more stable film with a higher content of ITO in the samples.
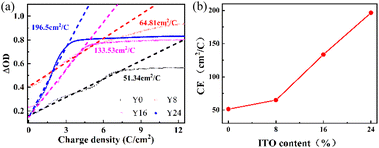
Finally, we discuss the coloration efficiency (CE) for the prepared samples, which is defined as the ratio of the optical density (ΔOD) variation at a certain wavelength and the corresponding inserted (or extracted) charge density (Q) per unit area of the film. CE denotes the ability of the optical modulation at a certain charge density for a designed EC device. Here, CE is calculated by the following equation:
 | (2) |
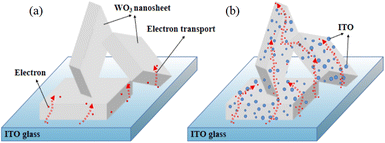
To explain the underlying mechanism of the enhanced EC properties discussed above, Fig. 7 displays a schematic of the electron transport process. For a pure WO3 film (without ITO nanoparticles), WO3 possesses a high charge-transport-barrier because of its poor electrical conductivity,23 and electrons can only transport from the contact point of the WO3 nanosheets and substrate, as shown in Fig. 7(a). As for the WO3/ITO composite film illustrated in Fig. 7(b), conductive ITO nanoparticles attached on the WO3 nanosheets serve as many extended 3-dimensional electrodes. Therefore, more WO3 nanoparticles could participate in the EC reaction, which increases the electron exchange area and accelerates the EC reaction speed. In addition, for the reported one-dimensional WO3 nanostructures such as nanorods, the electrons mainly accumulate at the contact points of the WO3 nanorods and the ITO glass substrate. However, for our prepared WO3/ITO nanosheets composite film, the ITO nanoparticles are uniformly distributed around the WO3 nanosheets, leading to a more homogeneous EC reaction.
4. Conclusion
In summary, we have demonstrated enhanced electrochromic properties through introducing ITO nanoparticles into the monoclinic WO3 nanosheet and ITO composite film. The optical modulation has improved to 87.89% at the wavelength of 633 nm, which is much larger than the values of most reported pristine WO3 films. The switching speed and cycling stability are also enhanced by adding ITO nanoparticles into the WO3 nanosheet. Particularly, the coloration efficiency is boosted remarkably in the prepared composite EC film. These enhanced EC properties are explained by the increased conductivity and electrochemical activity because the coated composite film forms an effective conductive network on the ITO substrate. The excellent EC properties and low-cost fabrication method of the composite WO3/ITO films suggest its broad applications in commercial production of electrochromic smart devices and great potential for other electrochemical electronics.Author contributions
Yuan Yu Zheng performed the experiments and characterization. Feng Hui An and Jian Qiang Liu analyzed the data and wrote the manuscript. Meng Dong He and Bo Zhang provided helpful discussions and revised the manuscript. The first two authors contributed to this work equally. All authors have given approval to the final version of the manuscript.Conflicts of interest
There are no conflicts to declare.Acknowledgements
This work was financially supported by the National Natural Science Foundation of China (Grant No. 11764018), the Natural Science Foundation of Jiangxi Province (Grant No. 20202ACBL211004), and the Science and Technology Research Foundation of Jiangxi Provincial Department of Education (Grant No. GJJ211820).References
- R. Kumar, D. K. Pathak and A. Chaudhary, Current status of some electrochromic materials and devices: a brief review, J. Phys. D: Appl. Phys., 2021, 54, 503002, DOI:10.1088/1361-6463/ac10d6.
- S. K. Deb, Opportunities and challenges in science and technology of WO3 for electrochromic and related applications, Sol. Energy Mater. Sol. Cells, 2008, 92, 245–258, DOI:10.1016/j.solmat.2007.01.026.
- B. R. Li, J. Dang, Q. Y. Zhuang and Z. P. Lv, Recent advances in inorganic electrochromic materials from synthesis to applications: critical review on functional chemistry and structure engineering, Chem.–Asian J., 2022, 17(7), e202200022, DOI:10.1002/asia.202200022.
- C. C. Mardare and A. W. Hassel, Review on the versatility of tungsten oxide coatings, Phys. Status Solidi A, 2019, 216(12), 1900047, DOI:10.1002/pssa.201900047.
- G. F. Cai, M. Q. Cui, V. Kumar, P. Darmawan, J. X. Wang, W. Xang, A. L. S. Eh, K. Qian and P. S. Lee, Ultra-large optical modulation of electrochromic porous WO3 film and the local monitoring of redox activity, Chem. Sci., 2016, 7(2), 1373–1382, 10.1039/c5sc03727a.
- Z. Wang, W. B. Gong and X. Y. Wang, Remarkable Near-Infrared electrochromism in tungsten oxide driven by interlayer water-induced battery-to-pseudocapacitor transition, ACS Appl. Mater. Interfaces, 2020, 12(30), 33917–33925, DOI:10.1021/acsami.0c08270.
- G. J. Yang, Y. M. Zhang, Y. R. Cai, B. G. Yang, C. Gu and S. X. A. Zhang, Advances in nanomaterials for electrochromic devices, Chem. Soc. Rev., 2020, 49, 8687–8720, 10.1039/D0CS00317D.
- W. Wu, M. Wang, J. M. Ma, Y. L. Cao and Y. H. Deng, Electrochromic metal oxides: recent progress and prospect, Adv. Electron. Mater., 2018, 4(8), 1800185, DOI:10.1002/aelm.201800185.
- J. Y. Zheng, Q. Sun, J. Cui, a X. M. Yu, S. Li, L. L. Zhang, S. Y. Jiang, W. Ma and R. Z. Ma, Review on recent progress in WO3-based electrochromic films: preparation methods and performance enhancement strategies, Nanoscale, 2023, 15, 63–79, 10.1039/d2nr04761f.
- J. Pan, Y. Wang, R. Zheng, M. Wang, Z. Wan, C. Jia, X. Weng, J. Xie and L. Deng, Directly grown high-performance WO3 films by a novel one-step hydrothermal method with significantly improved stability for electrochromic applications, J. Mater. Chem. A, 2019, 7, 13956–13967, 10.1039/c9ta01333d.
- Y. Zhao, X. Zhang, X. Chen, W. Li, L. Wang, F. Ren, J. Zhao, F. Endres and Y. Li, Preparation of WO3 films with controllable crystallinity for improved near-infrared electrochromic performances, ACS Sustainable Chem. Eng., 2020, 8, 11658–11666, DOI:10.1021/acssuschemeng.0c03141.
- C. H. Kim, Y. S. Kim, J. Y. Choi, I. S. Lee, B. C. Cha and D. W. Kim, Enhancement of electrochromic properties using nanostructured amorphous tungsten trioxide thin films, RSC Adv., 2022, 12, 35320, 10.1039/d2ra06472c.
- X. Huo, H. Zhang, W. Shen, X. Miao, M. Zhang and M. Guo, Bifunctional aligned hexagonal/amorphous tungsten oxide core/shell nanorod arrays with enhanced electrochromic and pseudocapacitive performance, J. Mater. Chem. A, 2019, 7, 16867–16875, 10.1039/c9ta03725j.
- Z. X. Li, Z. F. Liu, L. Zhao, Y. Chen, J. W. Li and W. G. Yan, Efficient electrochromic efficiency and stability of amorphous/crystalline tungsten oxide film, J. Alloys Compd., 2023, 930, 167405, DOI:10.1149/1945-7111/ac0997.
- V. G. Deonikar, J. M. C. Puguan and H. Kim, Ag nanoparticles embedded defective tungsten oxide hydrate thin films for the enhanced electrochromic performance: insights on the physico-chemical properties and localized surface plasmon resonance mechanism, Acta Mater., 2021, 207, 116693, DOI:10.1016/j.actamat.2021.116693.
- M. Bourdin, I. Mjejri, A. Rougier, C. Labrugere, T. Cardinal, Y. Messaddeq and M. Gaudon, Nano-particles (NPs) of WO3-type compounds by polyol route with enhanced electrochromic properties, J. Alloys Compd., 2020, 823, 153690, DOI:10.1016/j.jallcom.2020.153690.
- J. W. Liu, J. Zheng, J. L. Wang, J. Xu, H. H. Li and S. H. Yu, Ultrathin W18O49 nanowire assemblies for electrochromic devices, Nano Lett., 2013, 13, 3589–3593, DOI:10.1021/nl401304n.
- T. Gao and B. P. Jellea, Electrochromism of hexagonal sodium tungsten bronze nanorods, Sol. Energy Mater. Sol. Cells, 2018, 177, 3–8, DOI:10.1016/j.solmat.2017.11.025.
- A. Azam, J. Kim, J. Park, T. G. Novak, A. P. Tiwari, S. H. Song, B. Kim and S. Jeon, Two-dimensional WO3 nanosheets chemically converted from layered WS2 for high-performance electrochromic devices, Nano Lett., 2018, 18, 5646–5651, DOI:10.1021/acs.nanolett.8b02150.
- S. Wang, H. B. Xu, J. P. Zhao and Y. Li, Two-dimensional WO3 nanosheets for high performance electrochromic supercapacitors, Inorg. Chem. Front., 2022, 9, 514–523, 10.1039/D1QI01289D.
- Y. J. Yao, Q. Zhao, W. Wei, Z. Chen, Y. Zhu, P. Zhang, Z. Zhang and Y. Gao, WO3 Quantum-dots electrochromism, Nano Energy, 2020, 68, 104350, DOI:10.1016/j.nanoen.2019.104350.
- O. Lavi, G. L. Frey, A. Siegmann and Y. E. Eli, Enhanced tungstate electrochromism via formation of transparent conductive networks, Electrochem. Commun., 2008, 10(8), 1210–1213, DOI:10.1016/j.elecom.2008.06.001.
- Q. Zhao, Y. S. Fang, K. Qiao, W. Wei, Y. J. Yao and Y. F. Gao, Printing of WO3/ITO nanocomposite electrochromic smart windows, Sol. Energy Mater. Sol. Cells, 2019, 194, 95–102, DOI:10.1016/j.solmat.2019.02.002.
- Y. X. Zhang, Z. Q. Cheng, Y. Zeng, H. Y. He, G. Xu, Y. Liu and G. R. Han, Electrochemical characteristics of reconstructed WO3 electrodes by embedding ITO nanocrystals, J. Electrochem. Soc., 2021, 168, 066517, DOI:10.1149/1945-7111/ac0997.
- Z. J. Sun, D. Y. Lin, Y. He, Y. F. Sun and L. B. Yang, Preparation of tungsten trioxide ultrathin nanosheets for SERS active substrate and its performance, Chinese Journal of Light Scattering, 2020, 32(4), 320–327, DOI:10.13883/j.issn1004-5929.202004005.
- Z. Y. Bai, S. S. Wen and H. M. Xv, Preparation and properties of all solid-state electrochromic devices based on tungsten oxide nanocomposites, Mater. Res. Express, 2021, 8, 095703, DOI:10.1088/2053-1591/ac2406.
- X. T. Huo, X. W. Miao and X. Han, High-performance electrochromo-supercapacitors based on the synergetic effect between aqueous Al3+ and ordered hexagonal tungsten oxide nanorod arrays, J. Mater. Chem. A, 2020, 8, 9927–9938, 10.1039/D0TA01808B.
- J. L. Xie, B. Song, G. L. Zhao and G. R. Han, Citric acid induced W18O49 electrochromic films with enhanced optical modulation, Appl. Phys. Lett., 2018, 112, 231902, DOI:10.1063/1.5026893.
- H. Yu, J. J. Guo, C. Wang, J. Y. Zhang, J. Liu, G. B. Dong, X. L. Zhong and X. G. Diao, Essential role of oxygen vacancy in electrochromic performance and stability for WO3-y films induced by atmosphere annealing, Electrochim. Acta, 2020, 332, 135504, DOI:10.1016/j.electacta.2019.135504.
- Y. B. A. Liu, X. S. Cai, X. D. Xiao, J. X. Wang, G. Z. Sheng and G. Xu, Preparation of WO3 gel electrochromic device by simple two-step method, Mater. Today Commun., 2022, 30, 103090, DOI:10.1016/j.mtcomm.2021.103090.
- Y. Liu, G. Z. Yuan, C. Z. Hua, Y. X. Zhang, G. R. Han and H. Jiang, Improvement of electrochromic performance by embedding ITO nanocrystals in amorphous WO3 film, ECS J. Solid State Sci. Technol., 2019, 8(1), 1–9, DOI:10.1149/2.0021901jss.
- K. F. Wang, P. F. Zeng, J. Zhai and Q. Q. Liu, Electrochromic films with a stacked structure of WO3 nanosheets, Electrochem. Commun., 2013, 26, 5–9, DOI:10.1016/j.elecom.2012.09.037.
- W. Xiao, W. T. Liu, X. H. Mao, H. Zhu and D. H. Wang, Na2SO4-assisted synthesis of hexagonal-phase WO3 nanosheet assemblies with applicable electrochromic and adsorption properties, J. Mater. Chem. A, 2013, 1, 1261–1269, 10.1039/c2ta00545j.
| This journal is © The Royal Society of Chemistry 2023 |

