
 Open Access Article
 This Open Access Article is licensed under a Creative Commons Attribution-Non Commercial 3.0 Unported Licence
Constructing carbon supported copper-based catalysts for efficient CO2 hydrogenation to methanol
Zhong Xie *a,
Jinpei Heia,
Chuan Lia,
Xiaojie Yina,
Fengyi Wua,
Lei Chenga and
Sugang Meng*b
*a,
Jinpei Heia,
Chuan Lia,
Xiaojie Yina,
Fengyi Wua,
Lei Chenga and
Sugang Meng*b
aEngineering Technology Research Center of Preparation and Application of Industrial Ceramics of Anhui Province, School of Chemistry and Material Engineering, Chaohu University, 1 Bantang Road, Chaohu, 238000, P. R. China. E-mail: zhongxie@chu.edu.cn
bKey Laboratory of Green and Precise Synthetic Chemistry and Applications, Ministry of Education, Huaibei Normal University, Huaibei, Anhui 235000, P. R. China. E-mail: mengsugang@126.com
First published on 12th May 2023
Abstract
An activated carbon-supported Cu/ZnO catalyst (CCZ-AE-ox) was successfully obtained by the ammonia evaporation method for the hydrogenation of carbon dioxide to methanol, and the surface properties of the catalyst post-calcination and reduction were investigated. Activated carbon facilitated the increased dispersion of the loaded metals, which promote the CO2 space-time yield (STY) of methanol and turnover frequency (TOF) on the active sites. Furthermore, the factors affecting the catalyst in the hydrogenation of CO2 to methanol were in-depth investigated. The larger surface area and higher CO2 adsorption capacity are found to make possible the main attributions of the superior activity of the CCZ-AE-ox catalyst.
1. Introduction
The atmospheric CO2 in the world has been continuously increasing since the 1950s, and now has doubled from 212 ppm in 1958 to 445 ppm in 2021.3 In the context of the greenhouse effect of carbon dioxide on global climate change, increasing attention has been paid to the study of carbon dioxide in recent years.1,2 To solve the environmental problems as well as the impending lack of energy, it is viewed as a promising and efficient approach for sustainable development to convert CO2 into beneficial compounds and petroleum derivatives. The most attractive and promising production is of methanol by using carbon dioxide as a reactant.4–10 Most of the methanol synthesis methods adopted copper-based catalysts, like Cu/ZnO/SiO2, Cu/ZnO/Al2O3, Cu/ZnO, Cu/ZnO/Al2O3/ZrO2, and so forth.11–15 Cu reduces activation energy for H dissociation, while ZnO plays a role in dramatically improving the catalytic activity of copper-based catalysts, which can decrease the energy barrier of methanol synthesis by impeding the generation of carbon monoxide and accelerating the H spillover.Researches have shown many problems with copper-based catalysts. For example, copper sintering can lead to low selectivity, low activity, and short lifetime.16–18 The two main factors claimed that cause copper sintering are low dispersion and water vapor oxidization of copper, which subsequently results in catalyst deactivation. A great many approaches have been used to solve the copper sintering problem. For example, metal oxides have been added to improve copper dispersion.19 Moreover, several carriers have been modified to develop copper-based catalysts with Cu0 or Cuξ+ sites.10 Arena et al. reported that the carrier effectively controlled the catalyst texture and metal surface exposure, which in turn influenced its adsorption properties.20 Copper dispersion and reduction of copper-based catalysts have significantly improved recently, but there is little change in the catalytic activity, which is still at a low level.
Furthermore, the most common catalytic supports are graphene, carbon nanotubes (CNTs), and activated carbon (AC) in view of their large surface area, strong thermal stability, and unique structure.21 In addition, the functionalization of the carbon surface can greatly promote the anchoring of the metal. The hydrophobic nature of carbon effectively ensures excellent stability even in the presence of water. Many cases have demonstrated that carbon-supported catalysts outperformed traditional oxide-supported catalysts. Fan et al. declared that reduced graphene oxide (rGO) supporting copper-based catalysts generated a certain surface area, controlling metal surface exposure and catalyst texture, and accordingly influenced adsorption performance.22 Cu/ZnO catalysts supported on activated carbon have been achieved for hydrogenation to methanol, promoting the dispersion of ZnO and Cu, and low particle agglomeration.23 Thus, carbon carrier in combination with Cu–ZnO catalysts is expected to result in extremely active and stable catalysts for methanol generation.
This article adopts the ammonia evaporation approach to produce the activated carbon-supported Cu/ZnO (CCZ) catalysts. Owing to the large surface area, AC successfully enhanced the dispersion of the active Cu species. The purpose of this research is to survey and compare the structure and adsorption properties of the calcined and reduced catalysts and investigate catalytic activity with the aid of a fixed-bed reactor.
2. Experimental
2.1. Catalyst preparation
All reagents are grade chemicals without in-depth purification. To impregnate copper and zinc precursors on activated carbon, the ammonium evaporation method was adopted. First, a solution containing 2.7511 g of Cu(NO3)2·3H2O (Macklin, 99%), 1.7169 g of Zn(NO3)2·6H2O (Aladdin, 99%), and 40.4251 g of deionized water were mixed in a three-neck flask. Second, 37 g of NH3·H2O solution (Aladdin, 25%) was added into the above-mentioned solution and stirred at room temperature for 10 min until the solution became dark blue. Then, 5 g of activated carbon (Macklin, 8–16 mesh) was added and formed a suspension under vigorous stirring at 80 °C for 5 hours, and then at 50 °C for 20 hours. Lastly, the temperature of the bath was elevated to 80 °C for 7 hours to evaporate the ammonia and deposit the metal species on the AC. The evaporation ended at a pH reduction to 7–8. Then we filtered the resulting suspension and wash the solid repeatedly with deionized water as well as dry it at 90 °C for 24 hours, followed by the calcination of dried samples at 360 °C for 4 hours under N2 to generate the CCZ-AE-ox. Additionally, the catalyst was reduced under a pressure of 2.5 MPa at 75% H2/N2 (100 ml min−1) flow rate at 300 °C for 1 hour, marked as CCZ-AE-re. The activated carbon calcined at the same conditions without adding metal salts was named AC-ox.2.2. Catalyst characterization
This article researched the chemical ingredient of the catalysts with two methods, namely, the aid of X-ray photoelectron spectroscopy (XPS, Thermo Scientific K-Alpha) and X-ray diffraction (XRD, Rigaku D/MAX-2400). To analyze the bulk composition, the article utilized inductively coupled plasma-atomic emission spectroscopy (ICP-OES; Agilent 5110).Scanning electron microscopy (SEM, Hitachi Regulus 8100) and high-resolution transmission electron microscopy (HRTEM, FEI Talos-F200S) were scanned to characterize the framework and morphology of the catalysts.
The surface area and pore volume of the catalysts were calculated by BET and BJH methods from nitrogen adsorption–desorption isotherms at 77 K determined with a Micromeritics ASAP 2020 Plus HD88 apparatus.
We used the same instruments as for TPR to conduct the CO2 temperature programmed desorption (CO2-TPD) was conducted using the same instrument as for TPR. First, 200 mg of the sample was reduced in inflowing 10% H2/Ar at 300 °C for 30 min, cooled to 50 °C, and exposed to pure CO2 for 1 h, followed by purging with Ar for 1 h to remove the physisorbed molecules. Finally, the TPD measurement was carried out in flowing Ar and heated up to 900 °C with a heating rate of 10 °C min−1.
H2 temperature-programmed reduction (TPR) was conducted on a Micromeritics AutoChem II 2920 instrument with thermal conductivity (TCD) to test the reducibility of catalysts. 100 mg of the catalyst was put in the U-shaped quartz reactor and then pretreated by pure Ar flow at 300 °C for half an hour. The temperature was reduced to 40 °C, and then flowed 10% H2 in Ar was through the sample at 40 °C for 15 minutes. Finally, the sample was heated to 800 °C at a boosting rate of 10 °C min−1.
N2O oxidation and H2 titration were successively adopted to determine the surface area of metallic copper (SCu). 100 mg of the sample was pretreatment in 10% H2/Ar flow at 300 °C for one hour, then purged it using He (30 mL min−1) for half an hour, followed by cooling to 60 °C. After that, a flow of 10% N2O/He (30 mL min−1) gas was fed in the reactor for one, hour and conducted the TPR measurement under a flow of 10% H2/Ar (30 mL min−1) to 300 °C at a boosting rate of 10 °C min−1.
CuO was reduced in the first TPR:
| CuO + H2 → Cu + H2O, hydrogen consumption = X |
Reduction of surface copper atoms only:
| Cu2O + H2 → 2Cu + H2O, hydrogen consumption in this TPR = Y |
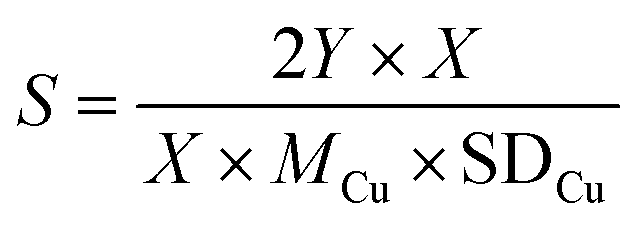
We calculated the dispersion of Cu (D) and exposed Cu surface area (S) as follows:
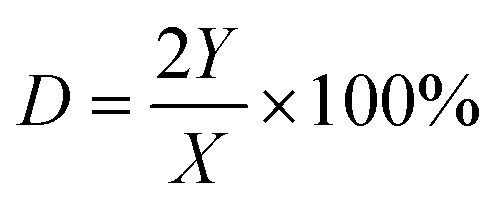
where NA denotes number of Avogadro (6.02 × 10²³ atoms per mol), MCu denotes relative atomic mass (63.546 g mol−1), and SDCu denotes quantity of copper atoms per square meter (1.47 × 10¹⁹ atoms per m).
2.3. Activity test and product analysis
The activity test for CO2 hydrogenation to methanol was performed in a high-pressure fixed-bed stainless steel reactor. 2.841 g of catalyst was placed in the reactor with a quantity of quartz sand on both sides, then reduced the catalyst with 75% H2/N2 at 300 °C for 1 h under 2.5 MPa pressure, designated as CCZ-AE-re. After the reduction treatment, the temperature of the reactor was cooled to reaction temperature, then a mixed gas of CO2/H2 was introduced, a gaseous hourly space velocity (GHSV) of 1650–4000 ml gcat−1 h−1, the temperature from 230 to 280 °C, and the ratio of H2/CO2 at 0.9–4.1. After the reaction system was stabilized, the liquid products were condensed and analyzed by a gas chromatograph (Huifen 7990) equipped with a flame ionization detector (FID) and a 60 m DB-WAX capillary column. The flow velocity of outlet gas was measured by wet gas meters, and the composition of the effluent gaseous products was analyzed using gas chromatography with a thermal conductivity detector.This article defines CO2 conversion, CH3OH selectivity, space-time yield (STY) of methanol and turnover frequency (TOF) as follows:
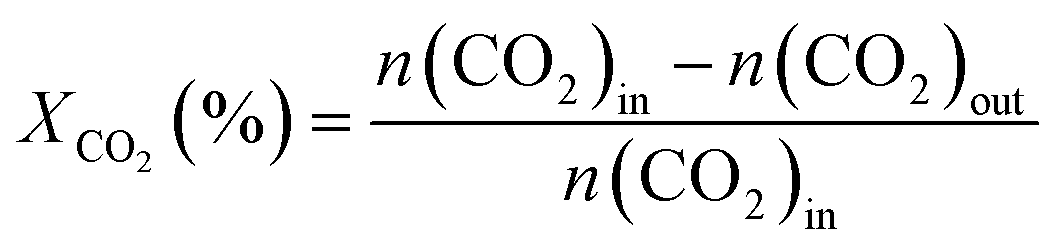
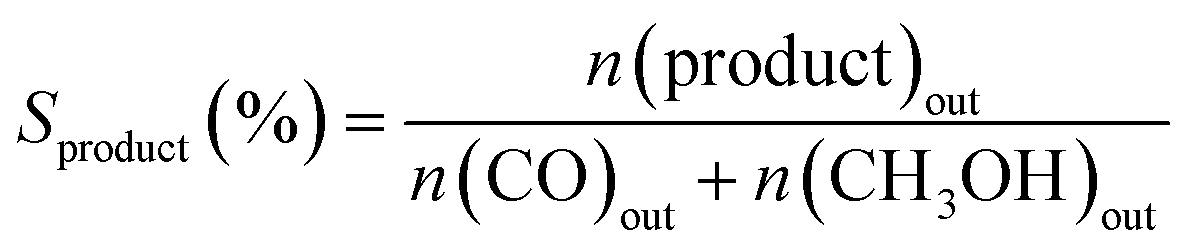
where n refers to the molar amount of the molecule in the effluent, F stands for the molar flow rate, M is the molar mass, DCu indicates the dispersion of Cu and W expresses the weight of the catalyst.
3. Results and discussion
3.1. The structural and morphological properties
The bulk concentration of Cu and Zn measured by ICP are shown in Table 1. There were 12.12% Cu and 4.43% Zn in the high-temperature calcined CCZ-AE-ox catalyst, the Cu/Zn ratio was 2.82; the copper and zinc content in CCZ-AE-re produced by H2/N2 reduction of CCZ-AE-ox was decreased to 7.32% and 2.61%, respectively, but Cu/Zn ratio has not changed basically. The unstable particles on the surface of the catalyst were blown away during the reduction process. The invariable Cu/Zn ratio indicated that uniform copper-zinc sediments were generated. Furthermore, the metal has not been detected in AC-ox, showing that all metals in CCZ-AE-ox and CCZ-AE-re were derived from metal salt.| Catalyst | Cu wt% | Zn wt% | Cu/Zn |
|---|---|---|---|
| AC-ox | 0.01 | 0 | — |
| CCZ-AE-ox | 12.12 | 4.43 | 2.82 |
| CCZ-AE-re | 7.32 | 2.61 | 2.89 |
Fig. 1 shows the X-ray diffraction patterns of the catalysts. After being calcinated at 360 °C, the diffraction peaks appeared at 35.4 and 38.9° indexed to the diffractions from lattice planes (002) and (200), which confirmed the monoclinic structure of CuO (PDF# 48-1548). Unique diffraction peaks of ZnO (PDF# 80-0075) appeared at 31.7°, 34.4°, 36.2°, and 47.5° that indexed to (100), (002), (101), and (102). Followed by the reduction process at 300 °C, the distinctive peaks of (100), (002), and (110) assigned to ZnO phases showed no obvious changes, while the peaks of CuO phases faded away. The peaks at 43.2°, 50.3°, and 74.9° indexed to (111), (200), and (220) of the metallic Cu, exerting a core effect as an active part in methanol synthesis. Comparing the XRD of the spent catalyst and the fresh catalyst, it can be seen that the catalyst maintained good structural stability.
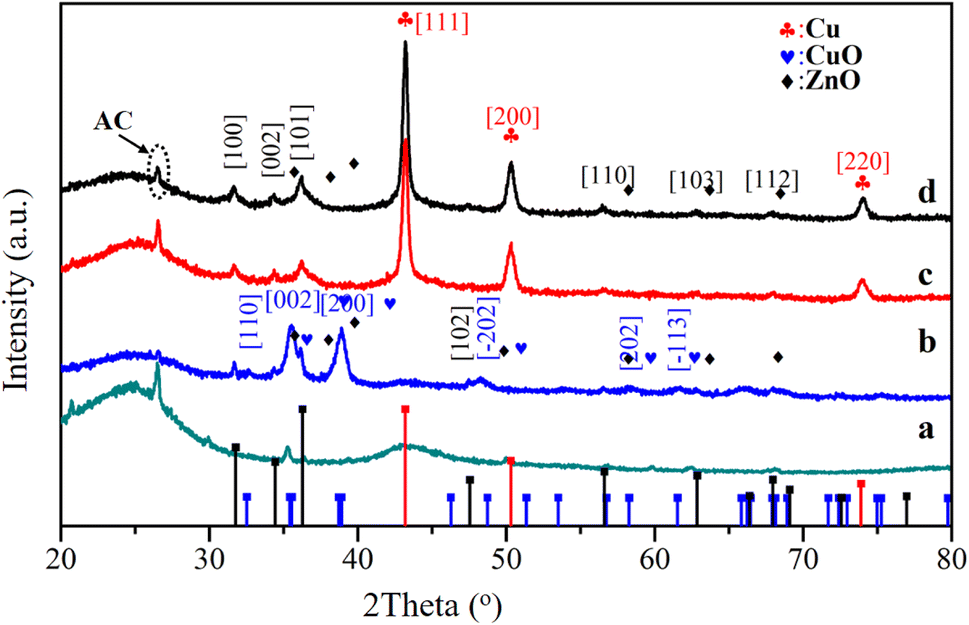 | ||
| Fig. 1 XRD patterns of the catalysts (a, b, c, and d represent the AC-ox, CCZ-AE-ox, CCZ-AE-re, and spent catalyst, respectively). | ||
The results of N2 adsorption–desorption measurements to analyze the physical properties of all catalysts are illustrated in Fig. 2. As seen in Fig. 2A, all isotherms showed obvious microporous adsorption characteristics, demonstrating the existence of narrow micropores. The pore size distributions of the three catalysts exhibited three peaks around 0.7 nm, 1.18 nm, and 1.48 nm in Fig. 2B. Moreover, the surface area (BET) and pore volume (Vp) are inserted in Fig. 2A. The Vp of the metal loading catalyst decreased from 0.3794 cm3 g−1 to 0.2719 cm3 g−1, indicating numerous Cu and Zn components entered the pores of activated carbon. Nevertheless, when the catalyst of CCZ-AE-ox was reduced, the pore volume of CCZ-AE-re increased to 0.3251 cm3 g−1. The specific surface area of the catalyst showed similar changes to pore volume. The specific surface of the catalyst fell from 680.5365 m2 g−1 to 461.1393 m2 g−1 after metal loading and rose to 530.7036 m2 g−1 after reduction. The cause possibly lies in two aspects. One was the blockage of the pore of the activated carbon by the loading metal, which resulted in decreased specific surface area of CCZ-AE-ox. Another was the loss of certain metals from the reduced CCZ-AE-re sample, which released the number of pores correspondingly and in turn increased the specific surface area of the catalyst.
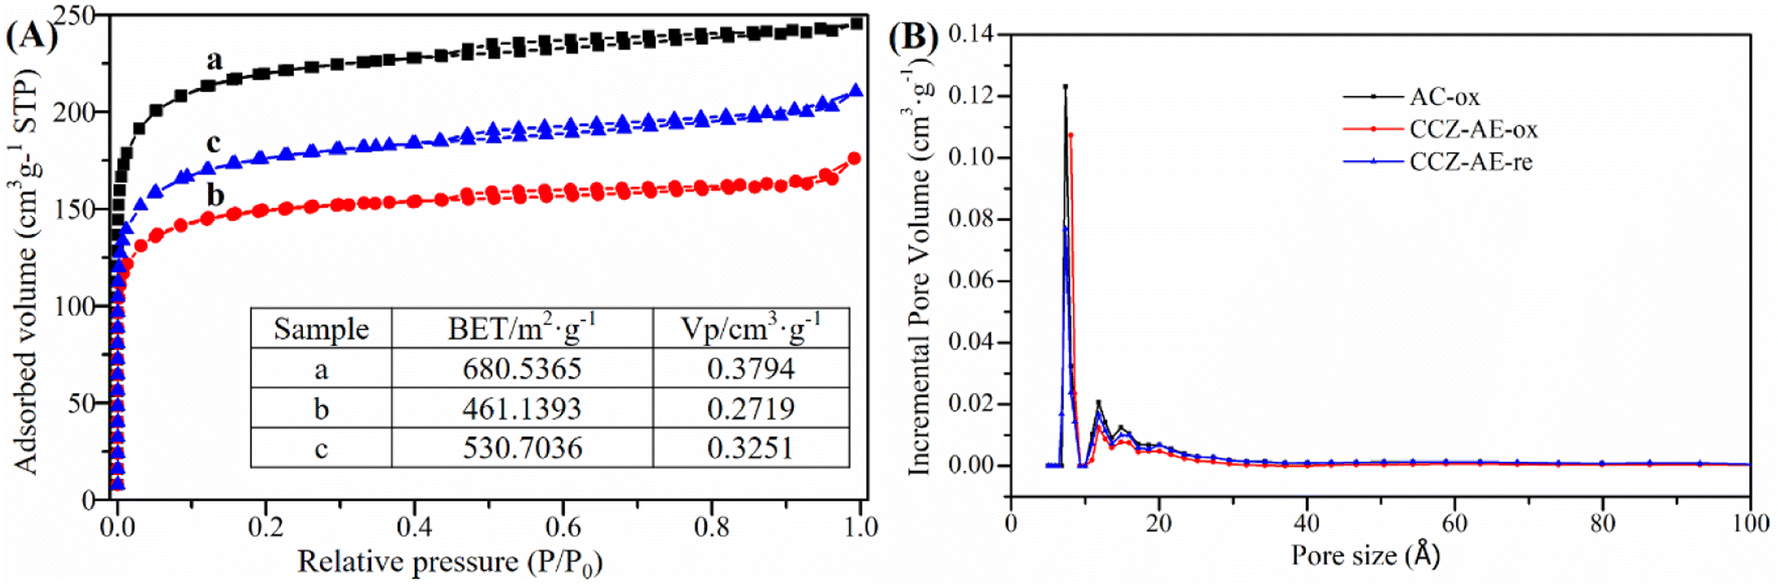 | ||
| Fig. 2 N2 adsorption–desorption isotherms (A) and pore size distributions (B) of the catalysts (a, b, and c represent AC-ox, CCZ-AE-ox, CCZ-AE-re, respectively). | ||
The characterizations of scanning electron microscopy (SEM) and elemental mapping analysis were made for investigating the morphology of the catalysts. Seen from SEM images of the CCZ-AE-ox catalyst, the support surface was covered with rough particles (Fig. 3A-1). In the magnification image of Fig. 3A-2 and A-3, it is found that the particles have a lamellar structure. As seen in the element mapping images, he Cu and Zn showed homogeneous distribution in the materials. During the reduction process, the rough packing structure transformed into a uniform granular layer, formed by loose spherical particles. The Cu and Zn components were uniformly distributed on the inner surface of the activated carbon.
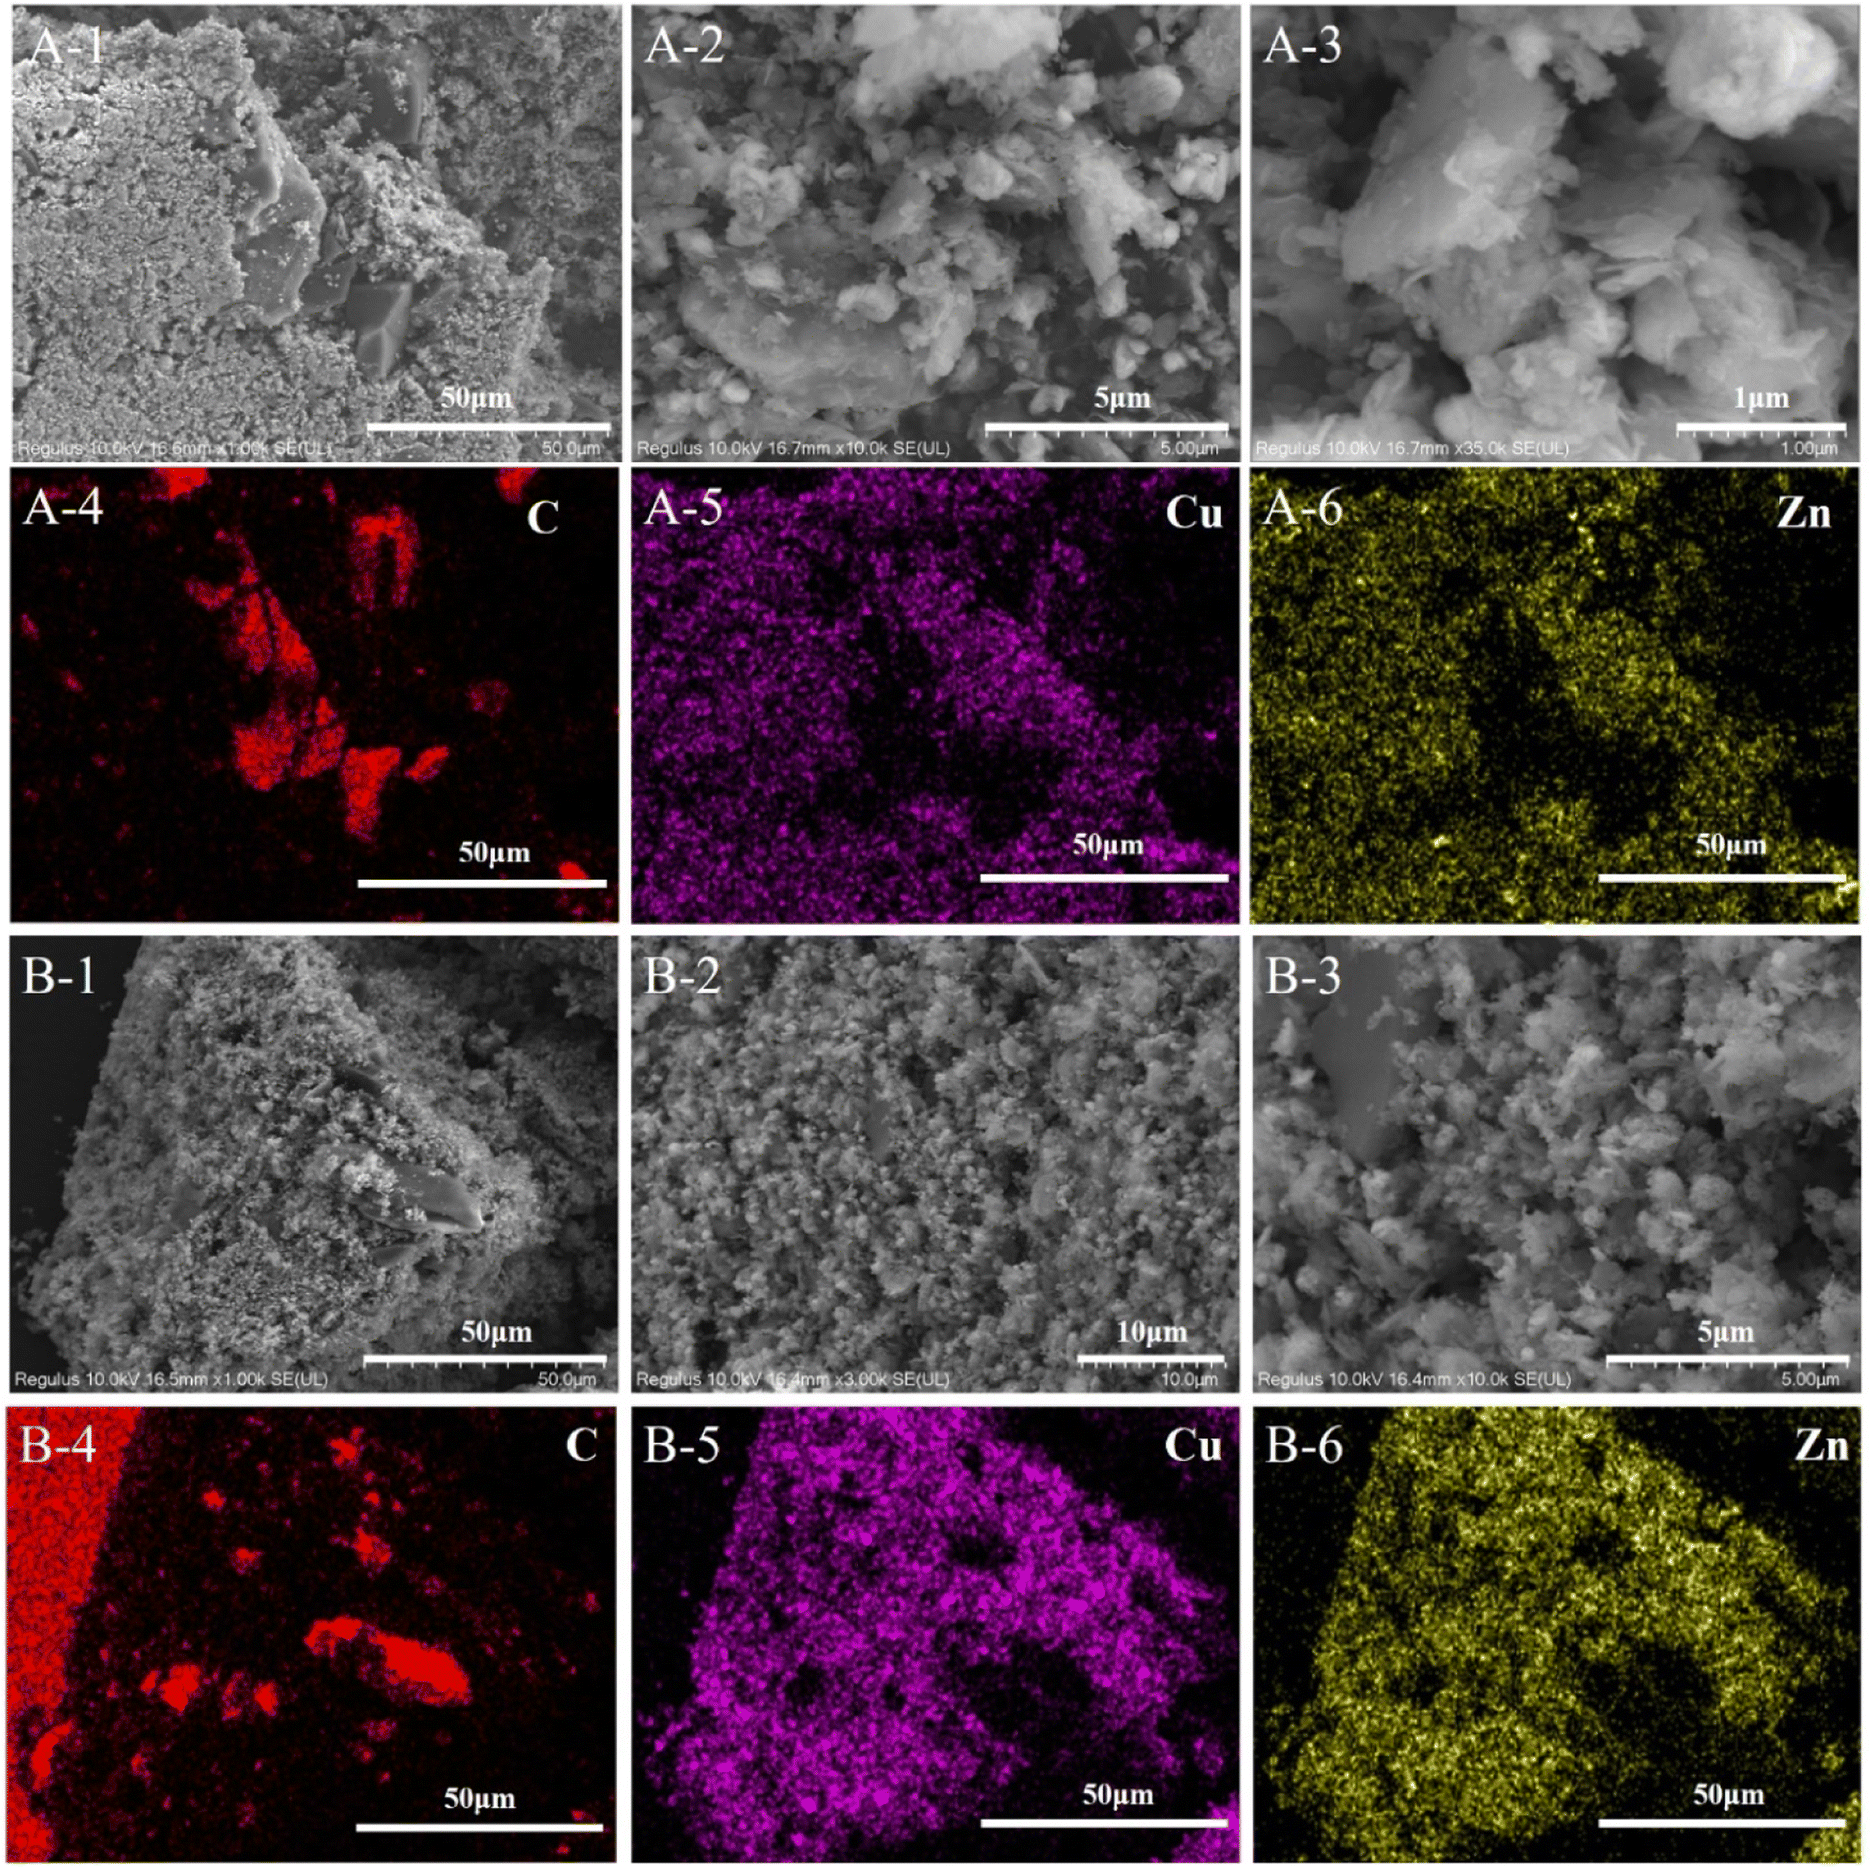 | ||
| Fig. 3 SEM and element mapping images of CCZ-AE-ox (A), and CCZ-AE-re (B). | ||
As seen in Fig. 4A, the TEM images of CCZ-AE-ox showed lattice fringes at 0.231 nm, 0.253 nm, and 0.275 nm ascribed to the characteristic (200), (002) and (110) planes of CuO, respectively. Moreover, the lattice spacings of 0.248 nm and 0.261 nm were also found to be corresponding to ZnO (101) and (002). After being reduced by H2, the CCZ-AE-re catalyst had got prominent lattice stripes of ZnO, displaying new lattice fringe assigned to ZnO (111) but with the disappearance of (101) lattice planes (Fig. 4B). Meanwhile, the lattice spacing of 0.208 nm and 0.181 nm was found to ascribe to Cu (111), (200), which confirmed to the outcomes of XRD. Furthermore, the lattice fringes of Cu2O (111) emerged in the TEM of the reduced catalyst. As seen from the TEM images, there was a sharp interface between the catalysts and activated carbon, which indicated the active components of the catalyst were well bound to carbon.
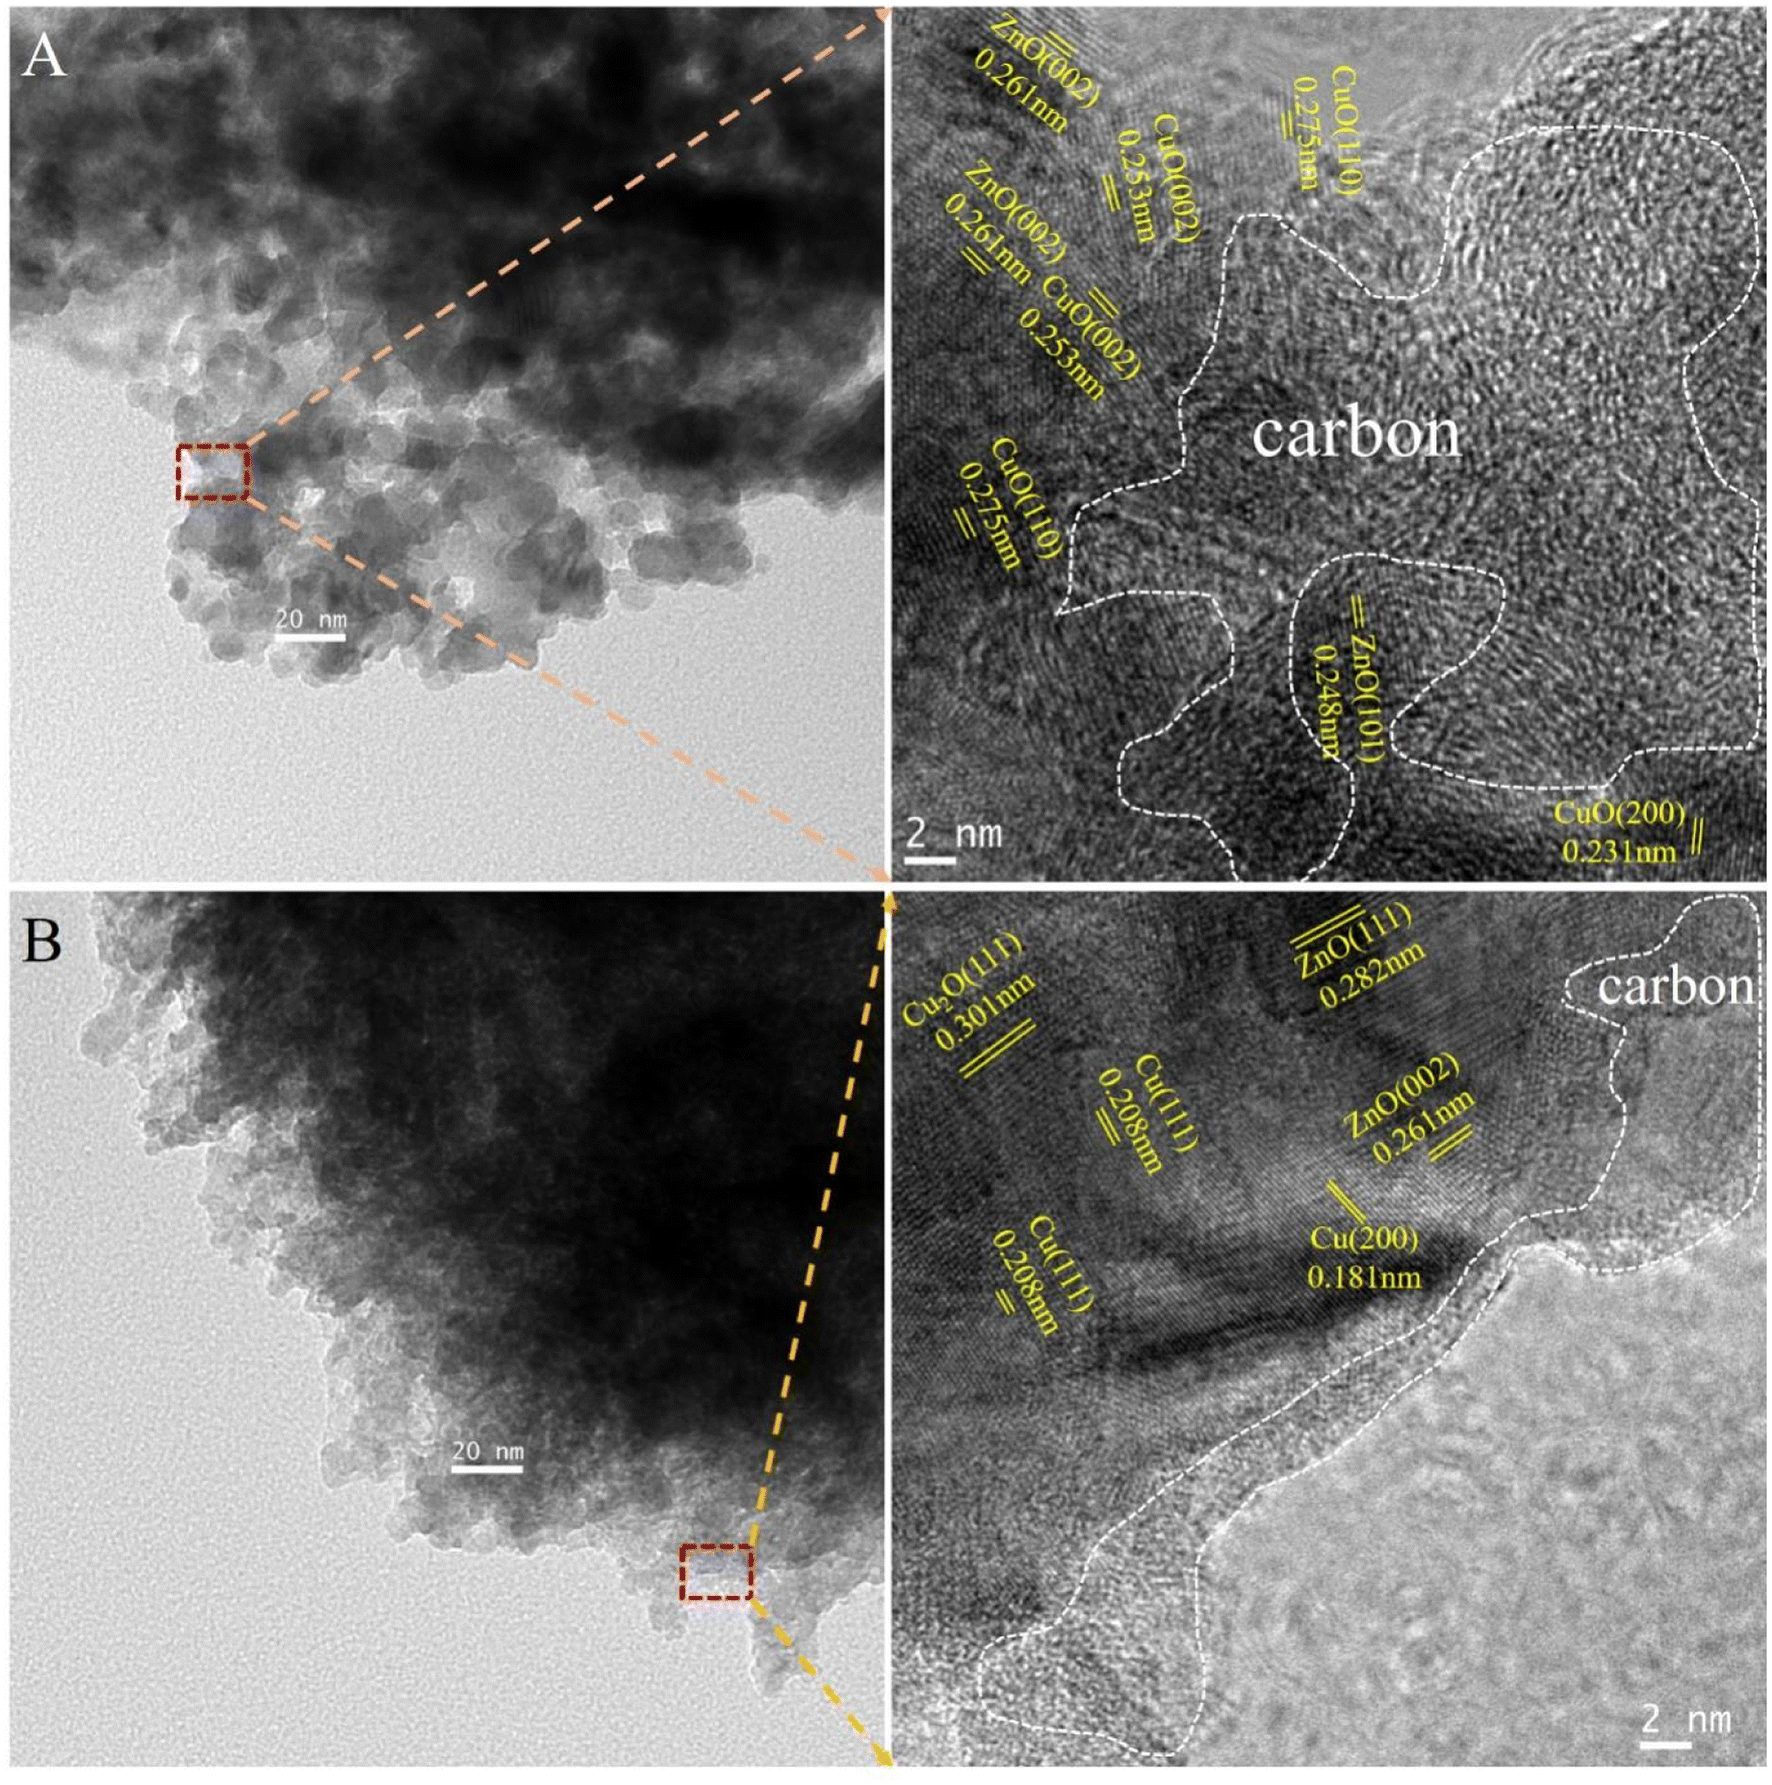 | ||
| Fig. 4 TEM images of CCZ-AE-ox (A), and CCZ-AE-re (B). | ||
3.2. Surface composition and reduction behavior
Fig. 5A shows the CO2-TPD curve of different catalysts used in determining the surface basicity, adsorbing, and activating CO2 as well as combining with hydrogen to synthesize methanol. The weak desorption peak of all catalysts occurred at 80–90 °C, ascribing to the physical adsorption of CO2 by activated carbon. No desorption of CO2 occurred in the AC-ox catalyst (the resulting product of the calcination of activated carbon) after 100 °C, thus it's easy to conclude that the adsorption of CO2 on AC-ox was weak. The catalyst of CCZ-AE-ox exhibited a desorption peak at 186 °C, which was assigned to the moderately basic site considered to be metal oxygen pairs (such as Zn–O). By comparison, the desorption temperature of the CCZ-AE-re catalyst was at 167 °C. The slightly lower temperature implied that the basicity of CCZ-AE-re was weakened by the high-pressure reduction of CCZ-AE-ox. Meanwhile, the amounts of CO2 desorbed from the basic site on the two catalysts were quantitatively calculated and summarized (inserted in Fig. 5A). The quantity of CO2 desorbed from CCZ-AE-ox was 344.0777 μmol g−1, considerably higher than that of CCZ-AE-re (234.8951 μmol g−1), which implied higher pressure for catalyst reduction resulted in less basic sites.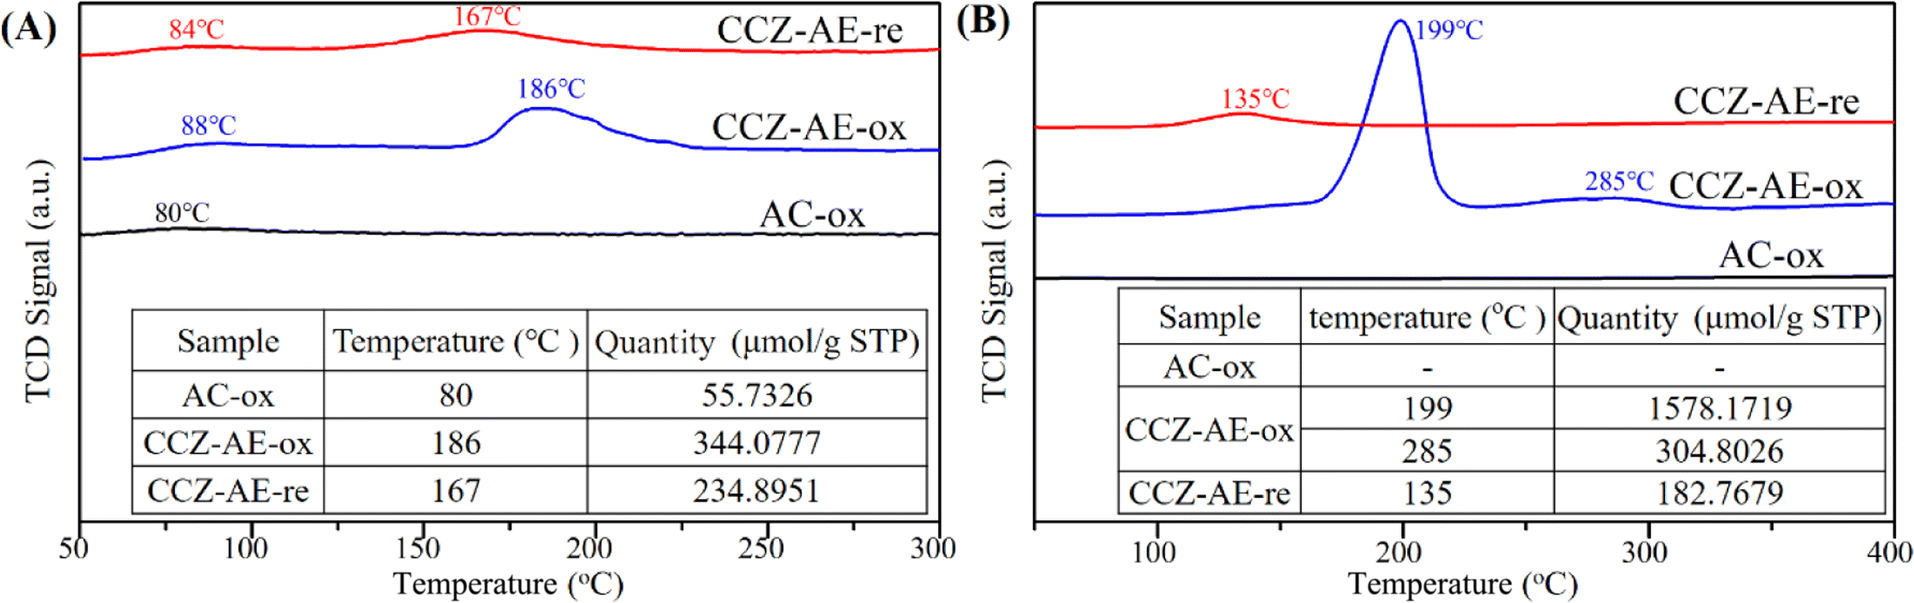 | ||
| Fig. 5 (A) CO2-TPD and (B) H2-TPR profiles of CCZ catalysts. | ||
Fig. 5B shows the H2-TPR experiments conducted on three catalysts to study the redox behaviors. No reduction peaks of the calcined activated carbon of AC-ox occurred at 100–400 °C, which implied that AC-ox cannot be reduced at this temperature. For CCZ-AE-ox, the TPR profile features a main peak around 199 °C accompanied by an obvious peak of 285 °C, suggesting a complicated reduction process for CuO species. The peak at 199 °C may be attributed to the reduction of the dispersed CuOx species.22,24 In contrast, the higher reduction temperatures at 285 °C, may be ascribed to the reduction of CuOx species strongly interacting with the ZnO matrix.25,26 The peaks in the CCZ-AE-re catalyst located at 135 °C might be attributed to the reduction in the surface CuxO species which is oxidized by air oxidation during the test. As shown in the insertion figure of Fig. 5B, the total hydrogen consumption of CCZ-AE-ox was to 1872.97 μmol gcat−1, and the calculated Cu content was 11.97%.
Additionally, the metallic Cu dispersion (DCu) and exposed Cu surface area (SCu) catalysts calculated by N2O chemisorption experiments are important parameters for the activity of Cu-based catalysts for CO2 hydrogenation to methanol. As shown in Table 2, CCZ-AE-ox displays a metal Cu dispersion of 4.14% and Cu surface area of 3.34 m2-Cu per gcat. During the high-pressure reduction, the loose particles on the surface of the metal carrier were lost, and the copper-specific surface area of the CCZ-AE-re catalyst fell to 2.74 m2-Cu per gcat.
| Catalyst | H2 consumption, μmol gcat−1 | DCu, % | SCu, m2-Cu per gcat | Position, °C |
|---|---|---|---|---|
| CCZ-AC | — | — | — | — |
| CCZ-AE-ox | 39 | 4.14 | 3.34 | 153.7 |
| CCZ-AE-re | 32 | — | 2.74 | 146.3 |
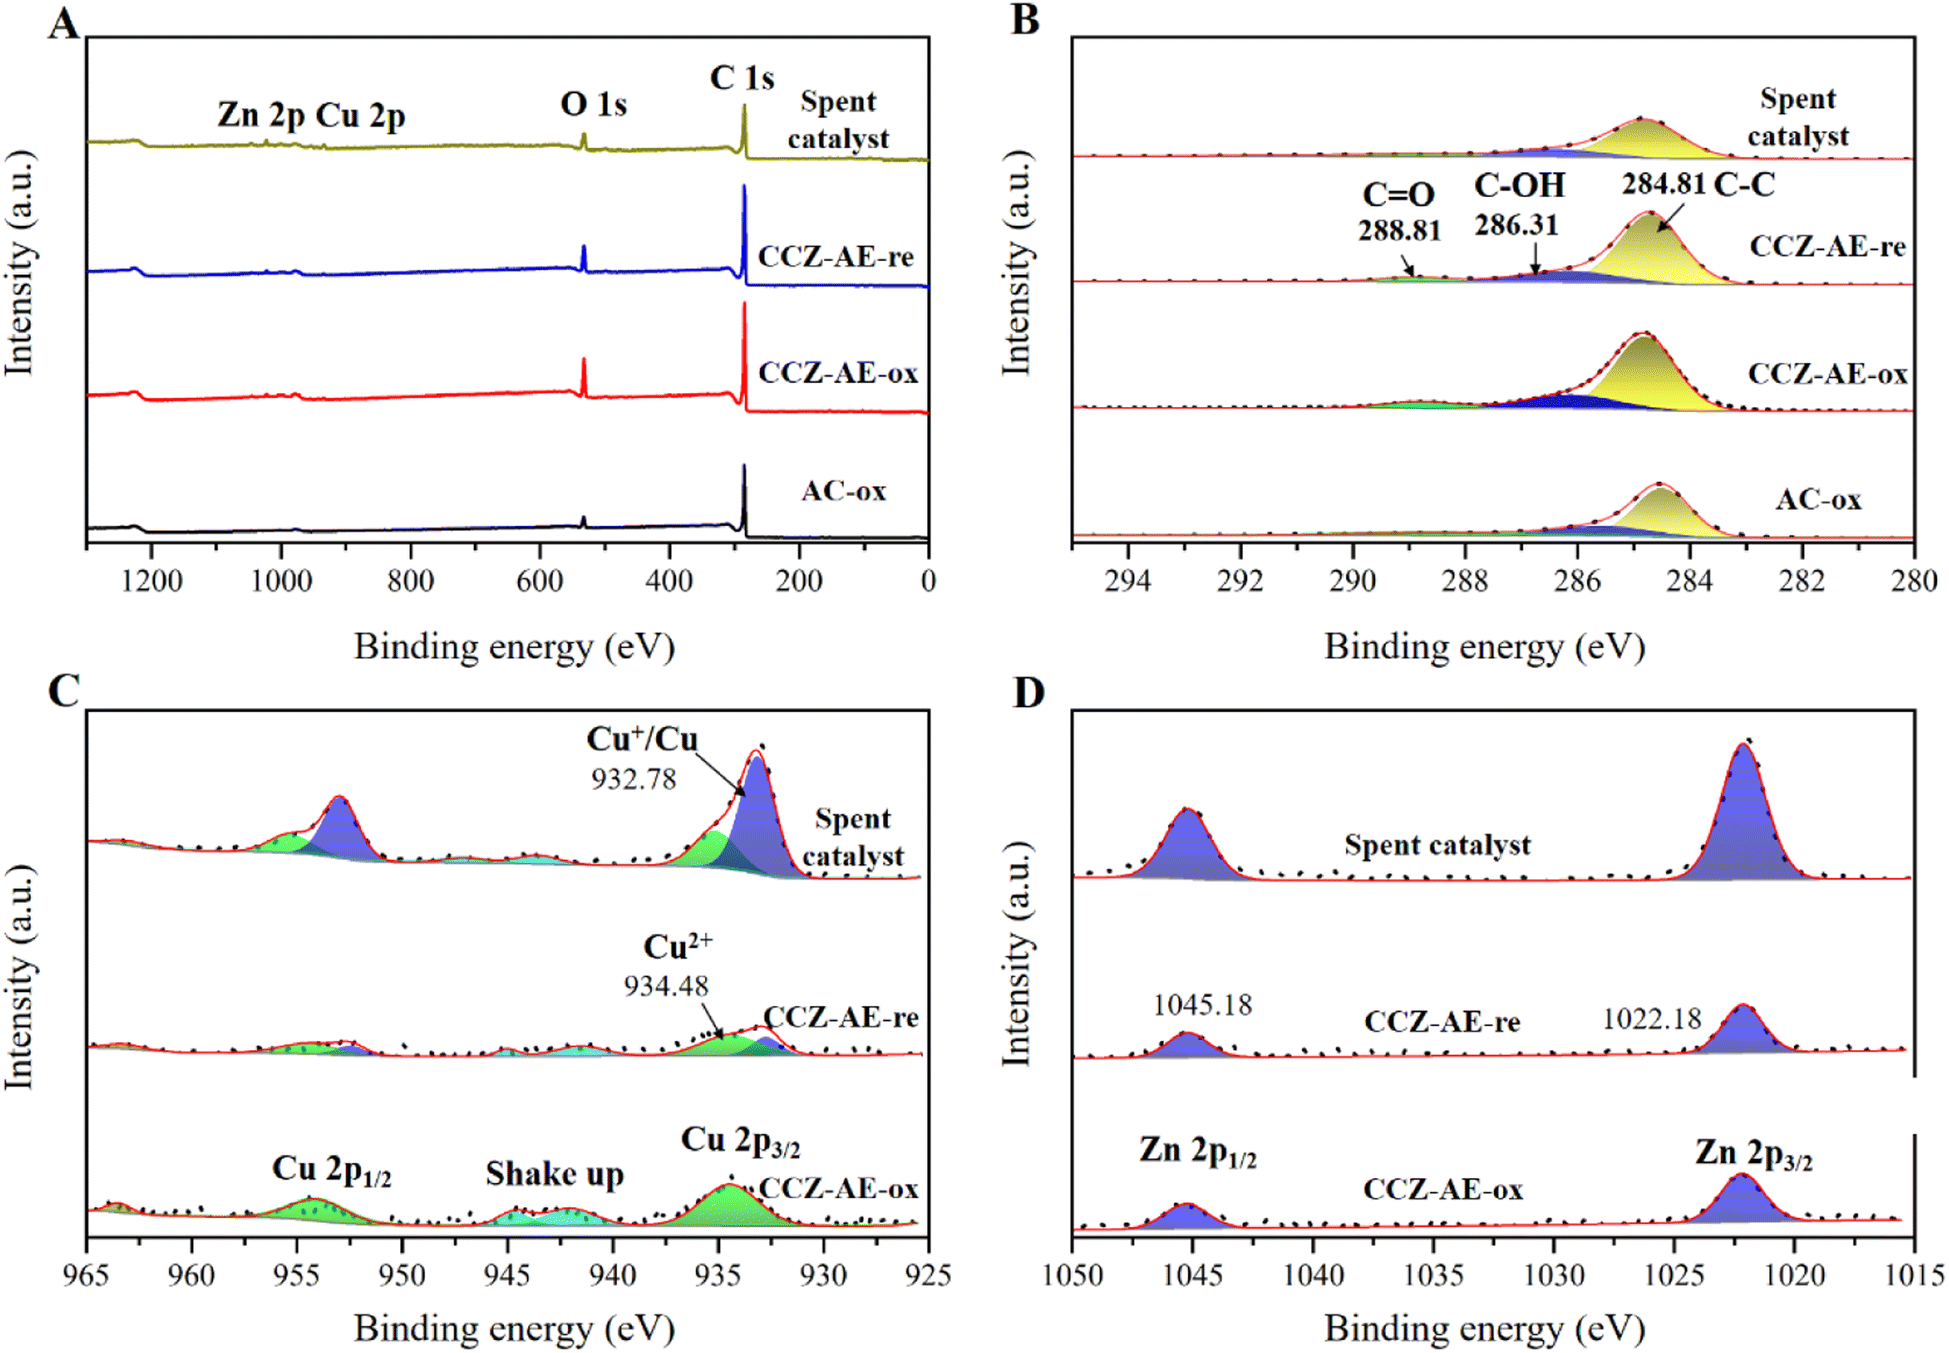
The surface state of the catalyst has a major impact on its catalytic behavior, the elemental chemical state and surface composition of the calcined and reduced catalysts were further evaluated by X-ray photoelectron spectroscopy (XPS) analysis in Fig. 6. Fig. 6A shows the XPS full spectrum of all catalysts, which have shown the peaks of C 1s, O 1s, Cu 2p and Zn 2p. In the C 1s core-level XPS spectrum of Fig. 6B, three peaks occurred in the deconvoluted C 1s spectrum at 284.8, 286.2, and 288.8 eV, corresponding to C atoms in C–C, C–O, and C![[double bond, length as m-dash]](https://www.rsc.org/images/entities/char_e001.gif) O shake-up satellite peak, respectively.27
O shake-up satellite peak, respectively.27
 | ||
| Fig. 6 XPS spectra of the catalyst for (A) full spectra, (B) C 1s, (C) Cu 2p, and (D) Zn 2p. | ||
The Cu 2p XPS spectrum is shown in Fig. 5C. The presence of CuO in the CCZ-AE-ox is indicated by the two peaks at 934.4 and 954.2 eV, which correspond to Cu 2p3/2 and Cu 2p1/2 of Cu2+, respectively.28–30 Two shake-up peaks occurred at 942.3 and 962.4 eV, which confirmed the presence of Cu2+.31–33 Binding energies centered at 1022.2 and 1045.2 eV derived from Zn2+ (Fig. 6D) proved that Zn2+ was the existing state of the Zn element.34 The CCZ-AE-re and spent catalyst occurred two peaks at 932.8 and 952.5 eV, corresponding to Cu 2p3/2 and Cu 2p1/2 peaks of Cu+/Cu0, respectively, which confirmed the presence of low valence copper. Except for the peaks of Cu+/Cu0, there was another obvious satellite peak, which implied the presence of Cu2+ possibly caused by air oxidation during the test.
3.3. Catalytic performance for methanol synthesis
To investigate the catalytic performance of samples, we conducted the performance testing of the as-prepared CCZ-AE-ox catalyst for CO2 hydrogenation to methanol. As seen from Fig. 7A and Table 3, the conversion rate of CO2 increased with reaction temperature increasing from 230 °C to 270 °C (P = 2 MPa, GHSV = 3000 h−1, H2/CO2 = 2.4/1), while methanol selectivity showed a downward trend. By contrast, the space-time yield (STY) of CH3OH increased constantly from 25.75 g kgcat−1 h−1 to 33.73 g kgcat−1 h−1. AC-ox was also used as a catalyst for the hydrogenation of carbon dioxide. No apparent CO2 conversion and product generation were found, implying that AC has no catalytic roles.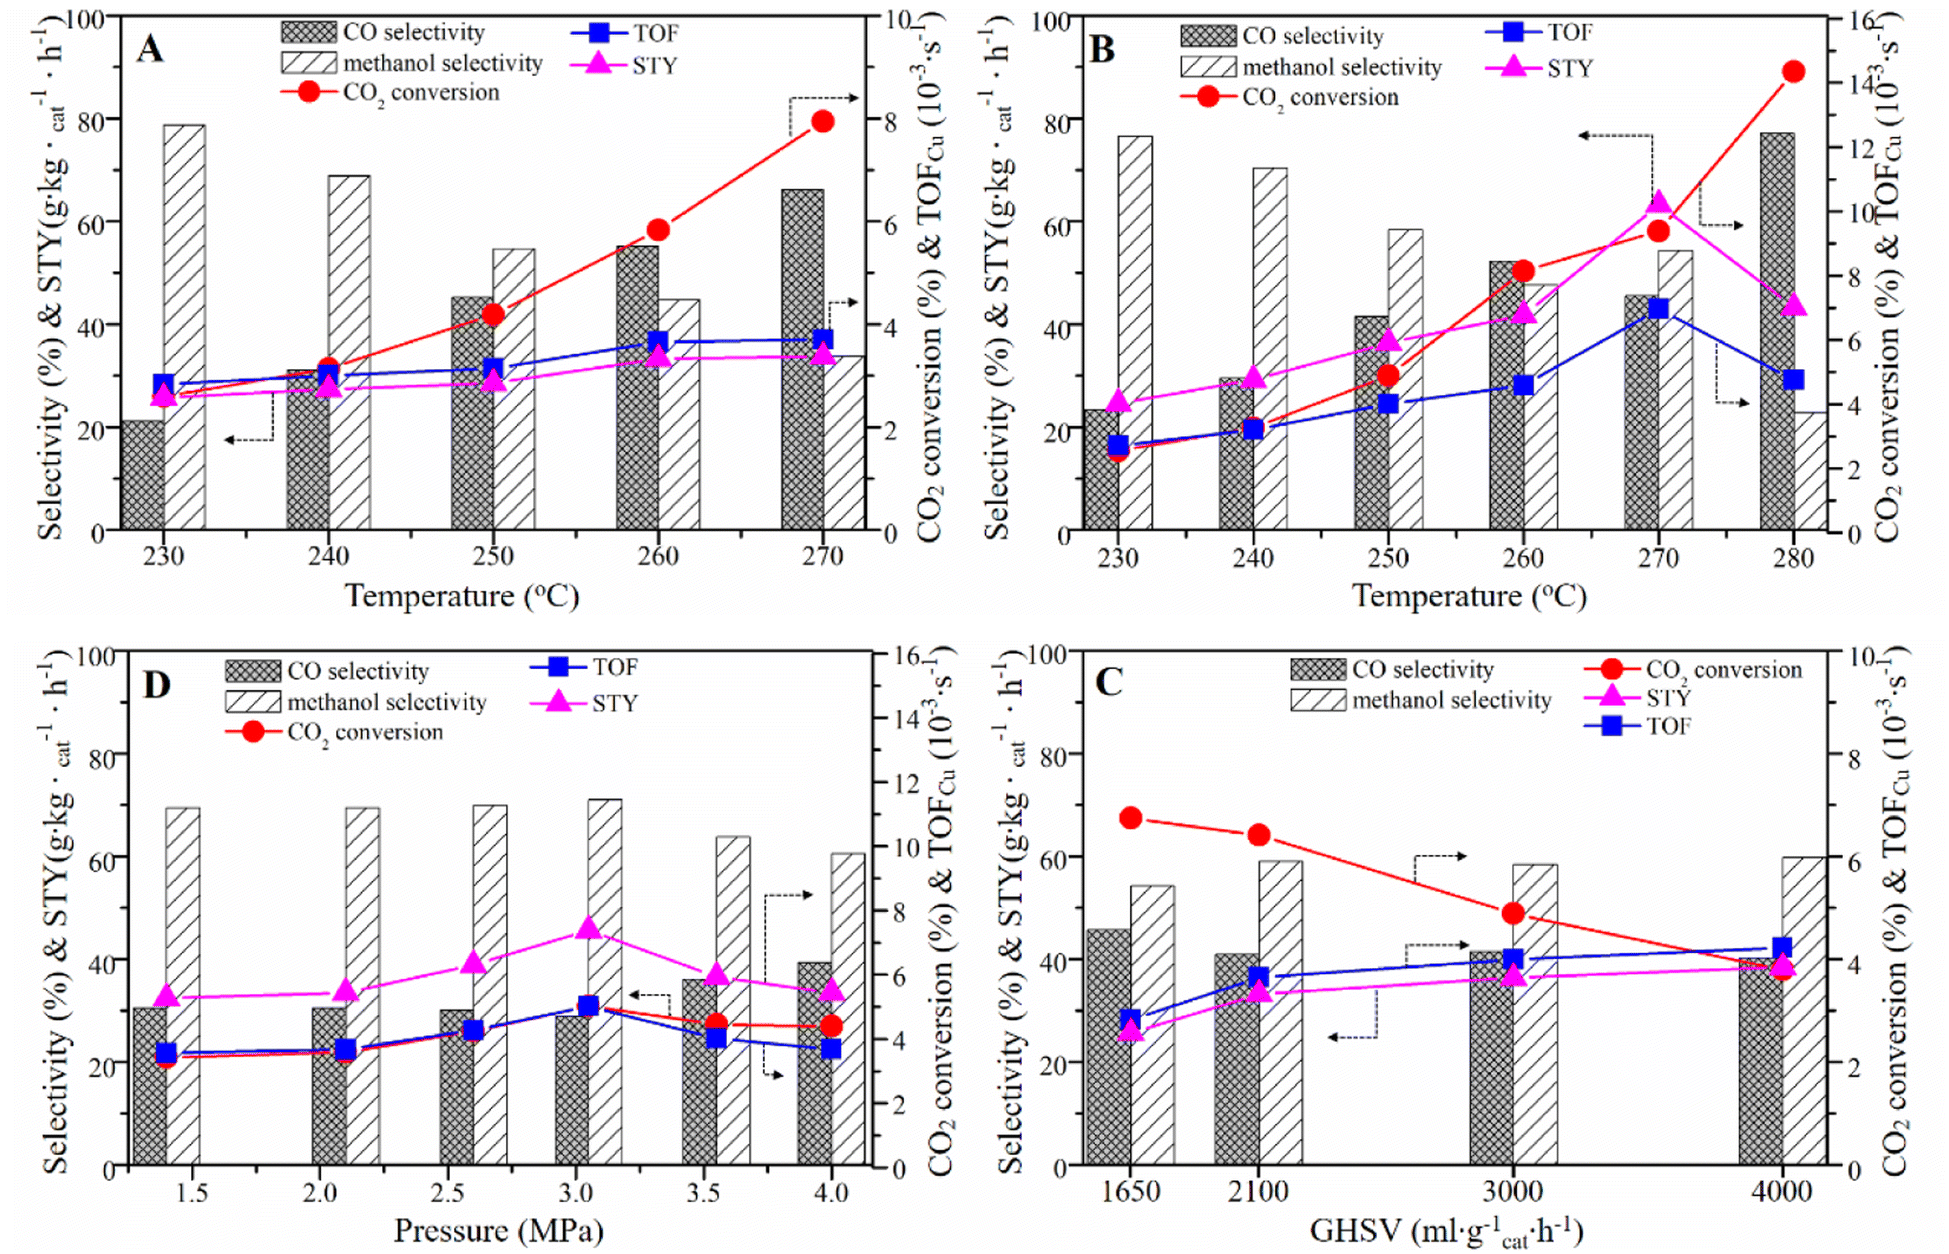 | ||
| Fig. 7 Catalytic performance of (A) CCZ-AE-ox catalyst at different temperatures with P = 2 MPa; and (B) 2.5 MPa (GHSV = 3000 mL gcat−1 h−1; H2/CO2 = 2.4/1); (C) CCZ-AE-ox at different pressure (T = 240 °C; GHSV = 3000 mL gcat−1 h−1; H2/CO2 = 2.4/1), and (D) at various GHSV (T = 250 °C; P = 2.5 MPa; H2/CO2 = 2.4). | ||
| P/MPa | T/°C | GHSV/h−1 | H2/CO2 | CO2 conversion/% | Selectivity/% | STY/g kgcat−1 h | TOF/×10−3 s−1 | |
|---|---|---|---|---|---|---|---|---|
| CO | CH3OH | |||||||
| 2 | 230 | 3000 | 2.4 | 2.60 | 21.23 | 21.23 | 78.77 | 25.75 |
| 240 | 3.14 | 31.13 | 31.13 | 68.87 | 27.37 | |||
| 250 | 4.19 | 45.26 | 45.26 | 54.74 | 28.57 | |||
| 260 | 5.84 | 55.19 | 55.19 | 44.81 | 33.29 | |||
| 270 | 7.95 | 66.21 | 66.21 | 33.79 | 33.73 | |||
| 2.5 | 230 | 3000 | 2.4 | 2.55 | 23.40 | 23.40 | 76.60 | 24.61 |
| 240 | 3.26 | 29.57 | 29.57 | 70.43 | 29.19 | |||
| 250 | 4.89 | 41.53 | 41.53 | 58.47 | 36.38 | |||
| 260 | 8.14 | 52.33 | 52.33 | 47.67 | 41.80 | |||
| 270 | 9.39 | 45.58 | 45.58 | 54.42 | 63.31 | |||
| 280 | 14.35 | 77.16 | 22.84 | 43.27 | 4.75 | |||
| 1.4 | 240 | 3000 | 2.4 | 3.42 | 30.50 | 30.50 | 69.50 | 32.40 |
| 2.1 | 3.59 | 30.53 | 30.53 | 69.47 | 33.47 | |||
| 2.6 | 4.25 | 30.08 | 30.08 | 69.92 | 38.90 | |||
| 3.1 | 5.02 | 28.92 | 28.92 | 71.08 | 45.64 | |||
| 3.6 | 4.45 | 36.14 | 36.14 | 63.86 | 36.58 | |||
| 4.0 | 4.40 | 39.42 | 39.42 | 60.58 | 33.49 | |||
| 2.5 | 250 | 1650 | 2.4 | 6.75 | 45.70 | 45.70 | 54.30 | 25.67 |
| 2100 | 6.41 | 40.97 | 40.97 | 59.03 | 33.21 | |||
| 3000 | 4.89 | 41.53 | 41.53 | 58.47 | 36.38 | |||
| 4000 | 3.80 | 40.24 | 40.24 | 59.76 | 38.46 | |||
| 2.5 | 250 | 3000 | 0.89 | 2.31 | 61.62 | 61.62 | 38.38 | 20.31 |
| 1.67 | 3.67 | 46.09 | 46.09 | 53.91 | 31.40 | |||
| 2.39 | 4.89 | 41.53 | 41.53 | 58.47 | 36.39 | |||
| 3.59 | 6.66 | 38.67 | 38.67 | 61.33 | 36.61 | |||
| 4.14 | 7.09 | 37.29 | 37.29 | 62.71 | 34.81 | |||
Increasing the pressure to 2.5 Mpa, the effect of temperature on catalytic performance was like that of 2 MPa, as shown in Fig. 7B. Interestingly, the CO2 conversion and methanol selectivity at 2.5 MPa were both lower than that at 2 MPa under low reaction temperature of 230 °C. However, as the temperature increased, the increasing rate of CO2 conversion was faster than that at 2 Mpa, while the selectivity of methanol decreases more slowly. Finally, at 280 °C, the conversion rate of CO2 reached 14.35% and the selectivity of methanol was only 22.84%. The turnover frequency (TOF), which represents the number of CO2 molecules hydrogenated on a unit site per second (s−1), was calculated from the exposed copper surface area for various catalysts. Results from this study (see Table 3) showed that the TOF increased with increased temperature, reaching 6.96 s−1 at 270 °C. Further increasing the temperature, the TOF decreased to 4.75 s−1 at 280 °C.
The influence of pressure on the performance of CCZ-AE-ox has been shown in Fig. 7C. As the pressure increased from 1.4 MPa to 3.1 MPa, CO2 conversion and TOF inceased from 3.42% and 3.56 × 10⁻³ s−1 to 5.02% and 5.01 × 10⁻³ s−1, respectively. The product selectivity remained stable. Increasing the pressure to 4.0 MPa (T = 240 °C; GHSV = 3000 mL gcat−1 h−1; H2/CO2 = 2.4/1), the CO2 conversion, CH3OH selectivity, and TOF showed a downward trend, only the CO selectivity increased from 28.92% to 39.42%. Probably because the pressure affected the gas speed passing through the catalyst bed, so it is necessary to investigate the effect of the gas hourly space velocity (GHSV) on the reaction performance.
As displayed in Fig. 7D, the performance test of CCZ-AE-ox was conducted at 1650–4000 mL gcat−1 h−1 (T = 250 °C, P = 2.5 MPa, H2/CO2 = 2.4/1). With the growth of space velocity, the CO2 conversion decreases significantly, but the CH3OH selectivity tended to increase slightly. In particular, the methanol selectivity remained around 60% in the range of the space velocity from 2100 mL gcat−1 h−1 to 4000 mL gcat−1 h−1, and the methanol STY also increased insignificantly, indicating that simply increasing the space velocity to improve the target product was ineffective. This result can be explained that increasing gas space velocity can accelerate the turnover frequency of the activated site of the catalyst, and the TOF increased from 2.82 × 10⁻³ s−1 at GHSV of 1650 mL gcat−1 h−1 to 4 × 10⁻³ s−1 at GHSV of 3000 mL gcat−1 h−1, but further increasing the GHSV, the TOF did not change obviously.
The influence of the H2/CO2 ratio on the catalytic performance was also investigated. As can be seen in Fig. 8A and Table 3, with the rise of the H2/CO2 ratio from 0.9 to 4.1 (T = 250 °C, P = 2.5 MPa, GHSV around 3000 mL gcat−1 h−1), the CO2 conversion grown significantly from 2.31% to 7.09%. The methanol selectivity also showed an increasing trend, but it was stable when H2/CO2 ratio reached 3.59. The STY and TOF also increased until the H2/CO2 ratio reached 3.59.
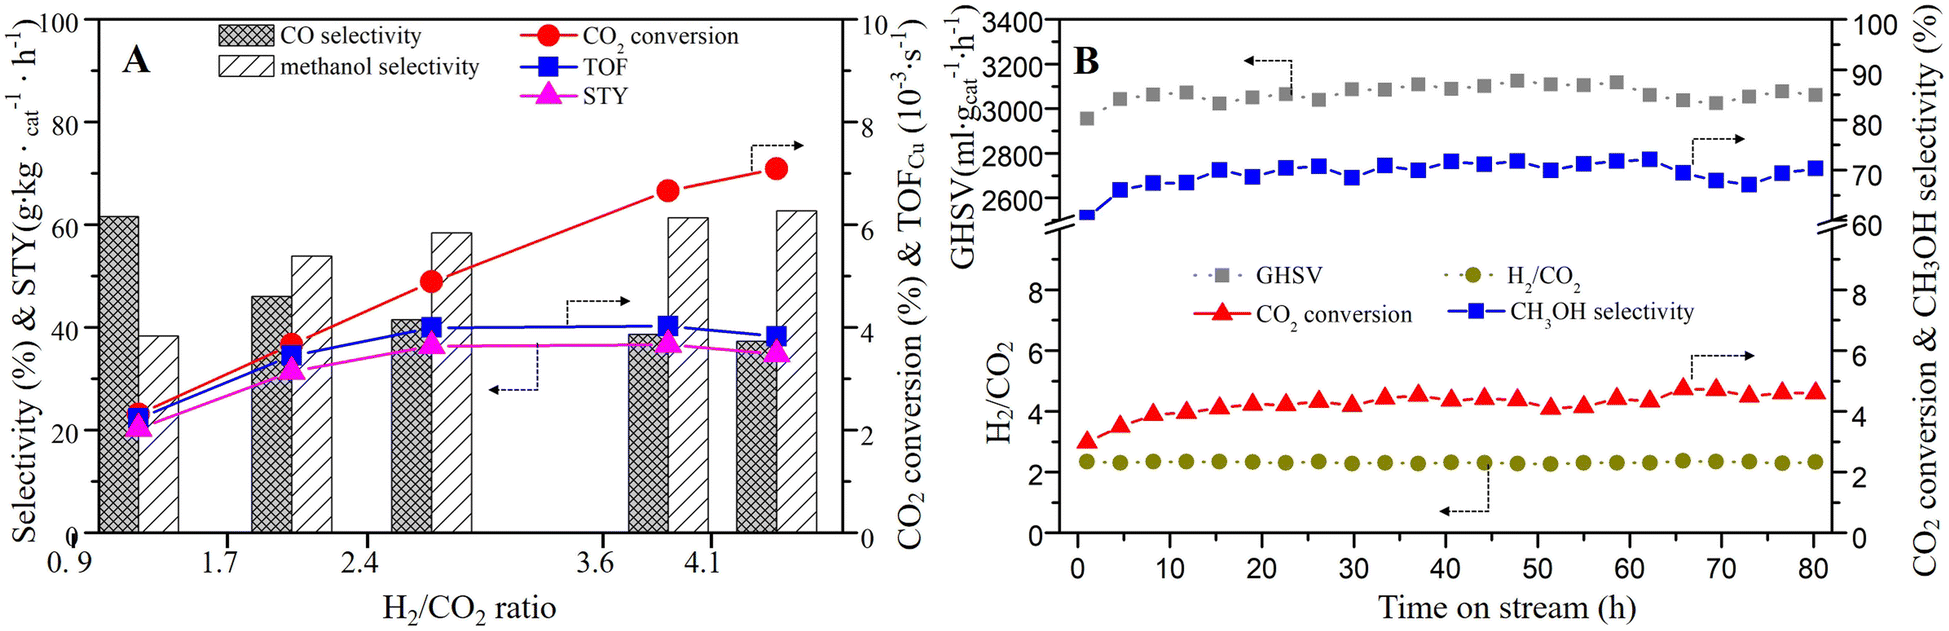 | ||
| Fig. 8 (A) Effect of H2/CO2 ratios (T = 250 °C; P = 2.5 MPa; GHSV = 3000 mL gcat−1 h−1), and (B) the stability test on CCZ-AE-ox catalyst (T = 240 °C; P = 2.5 MPa; GHSV = 3000 mL gcat−1 h−1). | ||
The stability of the catalyst is an important parameter for hydrogenating CO2 to methanol. The on-stream reaction experiment over CCZ-AE-ox catalyst was carried out under the conditions: T = 240 °C; P = 2.5 MPa; GHSV = 3000 mL gcat−1 h−1. As shown in Fig. 7B, the CO2 conversion, and CH3OH selectivity remained almost unchanged after 80 h on stream, which proved that the CCZ-AE-ox catalyst presented stable catalytic performance.
CO2 hydrogenation is the result of the synergistic effect of CO2 and H2. Therefore, a large amount of activated CO2 without sufficient H to react with would desorb from the metal surfaces in the form of CO2 at low H2/CO2 ratios, resulting in low CO2 conversion and product selectivity. For example, at an H2/CO2 of 0.9, the methanol selectivity is only 38%. As the increase of H2/CO2 ratio, more H produced on the Cu+/Cu0 site will react with CO2, resulting in higher selectivity of methanol. When the activated H exceeds the proportion required for CO2 hydrogenation, the product selectivity will remain stable.
4. Conclusions
CCZ-AE-ox catalyst was prepared by ammonia-evaporation method for CO2 hydrogenation to methanol. The introduction of AC improved specific surface CCZ-AE-ox catalyst was prepared by an ammonia-evaporation method for CO2 hydrogenation to methanol. The introduction of an AC support improved the specific surface area of the catalyst. The CCZ-AE-ox catalysts showed only CuO diffraction peaks although activated carbon can provide a reducing atmosphere during the catalyst preparation process. The catalyst CCZ-AE-ox, reduced by H2, showed only the peak of Cu, indicating the complete reduction of CuO to Cu. Meanwhile, in contrast to activated carbon, the CO2 adsorption capacity of the metal-loaded catalyst is significantly higher. The CO2 conversion and CH3OH selectivity of the CCZ-AE-ox catalyst reached 9.39% and 45.58% under the reaction conditions of 2.5 MPa and 270 °C, while those of the AC-ox catalyst has no obvious catalytic performance. Methanol selectivity increases as the temperature decreases. Increasing temperature, space velocity and H2/CO2 ratio all improve TOF and STY, but only the methanol selectivity decreases with increasing temperature. The AC support facilitates the production of methanol from CO2 and our catalysts enable high catalytic performance, making full use of the high specific surface area of the activated carbon to achieve better conversion of CO2 at low energy consumption.Conflicts of interest
The authors declare that there are no known competing financial interests or personal relationships which have appeared to affect the work reported herein.Acknowledgements
This work was supported by the National Natural Science Foundation of China (NSFC, 52002142); The Foundation of Anhui Province for Distinguished Young Scholars (2022AH020038); the Scientific Research Project of Chaohu University (XLY-202005, hxkt20220010, hxkt20220049), and the Start-Up Grant of Chaohu University (KYQD-202003).References
- M. Liu, Y. Yi, L. Wang, H. Guo and A. Bogaerts, Hydrogenation of Carbon Dioxide to Value-Added Chemicals by Heterogeneous Catalysis and Plasma Catalysis, Catalysts, 2019, 9, 275 CrossRef.
- S. G. Meng, C. Chen, X. Gu, H. Wu, Q. Meng, J. Zhang, S. Chen, X. Fu, D. Liu and W. Lei, Efficient photocatalytic H2 evolution, CO2 reduction and N2 fixation coupled with organic synthesis by cocatalyst and vacancies engineering, Appl. Catal., B, 2021, 285, 119789 CrossRef CAS.
- R. F. Keeling and C. D. Keeling, Atmospheric Monthly In Situ CO2 Data, Mauna Loa Observatory, Hawaii (Archive 2021-09-07). In Scripps CO2 Program Data. UC San Diego Library Digital Collections. Available online: https://library.ucsd.edu/dc/object/bb3859642r Search PubMed.
- B. Liang, J. Ma, X. Su, C. Yang, H. Duan, H. Zhou, S. Deng, L. Li and Y. Huang, Investigation on Deactivation of Cu/ZnO/Al2O3 Catalyst for CO2 Hydrogenation to Methanol, Ind. Eng. Chem. Res., 2019, 58, 9030–9037 CrossRef CAS.
- A. Goeppert, M. Czaun, J. P. Jones, G. K. S. Prakash and G. A. Olah, Recycling of carbon dioxide to methanol and derived products-closing the loop, Chem. Soc. Rev., 2014, 43, 7995–8048 RSC.
- G. A. Olah, G. K. S. Prakash and A. Goeppert, Anthropogenic Chemical Carbon Cycle for a Sustainable Future, J. Am. Chem. Soc., 2011, 133, 12881–12898 CrossRef CAS PubMed.
- N. A. M. Razali, K. T. Lee, S. Bhatia and A. R. Mohamed, Heterogeneous catalysts for production of chemicals using carbon dioxide as raw material: A review, Renewable Sustainable Energy Rev., 2012, 16, 4951–4964 CrossRef CAS.
- O. Martin, A. J. Martin, C. Mondelli, S. Mitchell, T. F. Segawa, R. Hauert, C. Drouilly, D. Curulla-Ferre and J. Perez-Ramirez, Indium Oxide as a Superior Catalyst for Methanol Synthesis by CO2 Hydrogenation, Angew. Chem., Int. Ed., 2016, 55, 6261–6265 CrossRef CAS PubMed.
- B. An, J. Z. Zhang, K. Cheng, P. F. Ji, C. Wang and W. B. Lin, Confinement of Ultrasmall Cu/ZnOx Nanoparticles in Metal–Organic Frameworks for Selective Methanol Synthesis from Catalytic Hydrogenation of CO2, J. Am. Chem. Soc., 2017, 139, 3834–3840 CrossRef CAS PubMed.
- A. García-Trenco, E. R. White, A. Regoutz, D. J. Payne, M. S. P. Shaffer and C. K. Williams, Pd2Ga-Based Colloids as Highly Active Catalysts for the Hydrogenation of CO2 to Methanol, ACS Catal., 2017, 7, 1186–1196 CrossRef.
- Q. Sun, Y. L. Zhang, H. Y. Chen, J. F. Deng, D. Wu and S. Y. Chen, A Novel Process for the Preparation of Cu/ZnO and Cu/ZnO/Al2O3 Ultrafine Catalyst: Structure, Surface Properties, and Activity for Methanol Synthesis from CO2+H2, J. Catal., 1997, 167, 92–105 CrossRef CAS.
- C. Baltes, S. Vukojević and F. Schüth, Correlations between synthesis, precursor, and catalyst structure and activity of a large set of CuO/ZnO/Al2O3 catalysts for methanol synthesis, J. Catal., 2008, 258, 334–344 CrossRef CAS.
- P. Gao, F. Li, H. J. Zhan, N. Zhao, F. K. Xiao, W. Wei, L. S. Zhong, H. Wang and Y. H. Sun, Influence of Zr on the performance of Cu/Zn/Al/Zr catalysts via hydrotalcite-like precursors for CO2 hydrogenation to methanol, J. Catal., 2013, 298, 51–60 CrossRef CAS.
- S. Natesakhawat, J. W. Lekse, J. P. Baltrus, P. R. Ohodnicki, B. H. Howard, X. Deng and C. Matranga, Active Sites and Structure-Activity Relationships of Copper-Based Catalysts for Carbon Dioxide Hydrogenation to Methanol, ACS Catal., 2012, 2, 1667–1676 CrossRef CAS.
- P. Gao, H. Y. Yang, L. N. Zhang, C. Zhang, L. S. Zhong, H. Wang, W. Wei and Y. H. Sun, Fluorinated Cu/Zn/Al/Zr hydrotalcites derived nanocatalysts for CO2 hydrogenation to methanol, J. CO2 Util., 2016, 16, 32–41 CrossRef CAS.
- H. Ahouari, A. Soualah, A. Le Valant, L. Pinard, P. Magnoux and Y. Pouilloux, Methanol synthesis from CO2 hydrogenation over copper based catalysts, React. Kinet., Mech. Catal., 2013, 110, 131–145 CrossRef CAS.
- H. Zhan, F. Li, P. Gao, N. Zhao, F. Xiao, W. Wei, L. Zhong and Y. Sun, Methanol synthesis from CO2 hydrogenation over La-M-Cu-Zn-O (M = Y, Ce, Mg, Zr) catalysts derived from perovskite-type precursors, J. Power Sources, 2014, 251, 113–121 CrossRef CAS.
- X. Guo, D. Mao, G. Lu, S. Wang and G. Wu, Glycine-nitrate combustion synthesis of CuO-ZnO-ZrO2 catalysts for methanol synthesis from CO2 hydrogenation, J. Catal., 2010, 271, 178–185 CrossRef CAS.
- E. Samei, M. Taghizadeh and M. Bahmani, Enhancement of stability and activity of Cu/ZnO/Al2O3 catalysts by colloidal silica and metal oxides additives for methanol synthesis from a CO2-rich feed, Fuel Process. Technol., 2012, 96, 128–133 CrossRef CAS.
- F. Arena, G. Mezzatesta, G. Zafarana, G. Trunfio, F. Frusteri and L. Spadaro, Effects of oxide carriers on surface functionality and process performance of the Cu-ZnO system in the methanol synthesis via CO2 hydrogenation, J. Catal., 2013, 300, 141–151 CrossRef CAS.
- H. Dai, Y. P. Qiu, H. B. Dai and P. Wang, Ni-Pt/CeO2 Loaded On Granular Activated Carbon: An Efficient Monolithic Catalyst for Controlled Hydrogen Generation From Hydrous Hydrazine, ACS Sustainable Chem. Eng., 2018, 6, 9876–9882 CrossRef CAS.
- Y. J. Fan and S. F. Wu, A graphene-supported copper-based catalyst for the hydrogenation of carbon dioxide to form methanol, J. CO2 Util., 2016, 16, 150–156 CrossRef CAS.
- Z. Luo, S. S. Tian and Z. Wang, Enhanced Activity of Cu/ZnO/C Catalysts Prepared by Cold Plasma for CO2 Hydrogenation to Methanol, Ind. Eng. Chem. Res., 2020, 59, 5657–5663 CrossRef CAS.
- X. Zhang, L. Zhong, Q. Guo, H. Fan, H. Zheng and K. Xie, Influence of the calcination on the activity and stability of the Cu/ZnO/Al2O3 catalyst in liquid phase methanol synthesis, Fuel, 2010, 89, 1348–1352 CrossRef CAS.
- Y. Zhu, X. Kong, S. Zhu, F. Dong, H. Zheng, Y. Zhu and Y. Li, Construction of Cu/ZrO2/Al2O3 composites for ethanol synthesis: synergies of ternary sites for cascade reaction, Appl. Catal., B, 2015, 166–167, 551–559 CrossRef CAS.
- Y. Jiang, H. Yang, P. Gao, X. Li, J. Zhang, H. Liu, H. Wang, W. Wei and Y. Sun, Slurry methanol synthesis from CO2 hydrogenation over micro-spherical SiO2 support Cu/ZnO catalysts, J. CO2 Util., 2018, 26, 642–651 CrossRef CAS.
- N. B. Trung, T. V. Tam, H. R. Kim, S. H. Hur, E. J. Kim and W. M. Choi, Three-Dimensional Hollow Balls of Graphene-Polyaniline Hybrids for Supercapacitor Applications, Chem. Eng. J., 2014, 255, 89–96 CrossRef CAS.
- J. Liu, A. Zhang, X. Jiang, M. Liu, Y. Sun, C. Song and X. Guo, Selective CO2 Hydrogenation to Hydrocarbons On Cu-Promoted Fe Based Catalysts: Dependence On Cu-Fe Interaction, ACS Sustainable Chem. Eng., 2018, 6, 10182–10190 CrossRef CAS.
- K. Wang, X. Dong, C. Zhao, X. Qian and Y. Xu, Facile Synthesis of Cu2O/CuO/RGO Nanocomposite and its Superior Cyclability in Supercapacitor, Electrochim. Acta, 2015, 152, 433–442 CrossRef CAS.
- Y. Liu, W. Zong, H. Zhou, D. Wang, R. Cao, J. Zhan, L. Liu and B. W. L. Jang, Tuning the Interlayer Cations of Birnessite-Type MnO2 to Enhance its Oxidation Ability for Gaseous Benzene with Water Resistance, Catal. Sci. Technol., 2018, 8, 5344–5358 RSC.
- V. Deerattrakul, P. Dittanet, M. Sawangphruk and P. Kongkachuichay, CO2 Hydrogenation to Methanol Using Cu-Zn Catalyst Supported On Reduced Graphene Oxide Nanosheets, J. CO2 Util., 2016, 16, 104–113 CrossRef CAS.
- H. Noei, H. S. Qiu, Y. M. Wang, E. Loffler, C. Woll and M. Muhler, The identification of hydroxyl groups on ZnO nanoparticles by infrared spectroscopy, Phys. Chem. Chem. Phys., 2008, 10, 7092–7097 RSC.
- Y. Wang, M. Muhler and Ch. Woll, Spectroscopic evidence for the partial dissociation of H2O on ZnO(1010), Phys. Chem. Chem. Phys., 2006, 8, 1521–1524 RSC.
- X. Hu, W. Qin, Q. Guan and W. Li, The Synergistic Effect of CuZnCeOx in Controlling the Formation of Methanol and CO from CO2 Hydrogenation, ChemCatChem, 2018, 10, 4438–4449 CrossRef CAS.
| This journal is © The Royal Society of Chemistry 2023 |