 Open Access Article
Modulating the interaction of graphenic substrates with human interleukin-6 and its monoclonal antibody: a study by Raman images†
Emmanuel de la O-Cuevas abc,
Selene R. Islasb,
Perla Gallegos-Floresa,
Esparza-Ibarra E. L.a,
Hugo Tototzintle-Huitlec and
José M. Saniger
 *b
*b
aUnidad Académica de Ciencias Biológicas, Universidad Autónoma de Zacatecas, 98068 Zacatecas, Mexico
bInstituto de Ciencias Aplicadas y Tecnología, Universidad Nacional Autónoma de México, Circuito Exterior S/N, Cd. Universitaria, 04510 Ciudad de México, Mexico. E-mail: jose.saniger@icat.unam.mx
cUnidad Académica de Física, Universidad Autónoma de Zacatecas, 98068 Zacatecas, Mexico
First published on 17th May 2023
Abstract
Interleukin-6 (IL-6) is a cytokine with wide-ranging biological effects, playing an important role on the immune system and inflammatory responses. Therefore, it is important to develop alternative, highly sensitive and reliable analytical methodologies for the accurate detection of this biomarker in biological fluids. Graphene substrates (GS), such as pristine graphene (G), graphene oxide (GO), and reduced graphene oxide (rGO), have shown great benefits for biosensing and in the development of novel biosensor devices. In this work, we present a proof of concept for the development of a new analytical platform for the specific recognition of human interleukin-6, that is based on the coffee-ring formation of monoclonal antibodies of interleukin-6 (mabIL-6) onto amine functionalized GS. The prepared GS/mabIL-6/IL-6 systems were successfully used to show that IL-6 was specifically and selectively adsorbed onto the area of the mabIL-6 coffee-ring. Raman imaging was confirmed as a versatile tool to investigate different antigen–antibody interactions and their surface distribution. This experimental approach can be used to develop a wide variety of substrates for antigen–antibody interaction allowing the specific detection of an analyte in a complex matrix.
Introduction
Interleukin-6 (IL-6) is a multifunctional cytokine that induces the expression of a variety of proteins responsible for acute inflammation in humans. Several chronic inflammatory diseases are associated with increased levels of IL-6, such as rheumatoid arthritis, chronic autoimmune diseases, COVID-19 (cytosine storm), multiple myelomas and gliomas, etc.,1–3 and for this reason it has been proposed as a biomarker for several inflammatory diseases and immune response.4–6Currently, the most widely used test for IL-6 detection is the Enzyme-Linked Immunosorbent Assay (ELISA). However, this test has some limitations derived from the requirement of trained personnel for its handling; long time analysis; the use of large amounts of antibody; and to be a destructive method. Therefore, some alternative approaches are being considered to overcome these limitations. Among them different types of biosensors have been developed for its detection7 including microarrays,8 electrochemical and photoelectrochemical immunoassays,9–11 and surface plasmon resonance.12,13
In general terms, the detection and quantification of biomarkers, which are generally expressed in low concentrations in biological fluids, is a determining factor for understanding the biomolecular process of chronic inflammatory diseases. In this sense, the timely detection of these biomarkers in biological fluids, within a specific range of concentrations, will allow early diagnosis and better prognosis of multiple diseases, as well as monitoring the therapeutic effectiveness of a certain treatment. IL-6 is a canonical example of this situation.
Raman spectroscopy in combination with spectroscopic signal enhancement techniques, as well as the use of statistical spectral analysis methods based on chemometric, have proven to be an interesting approach for the specific detection of IL-6.14,15 Several strategies have been developed to enhance the Raman signal of biomolecules which allow their detection at low concentrations. One of them is based on the dragging of the biomolecules present in a solution towards the periphery of a solid support. This process, which takes place during the drying of an analyte solution drop under controlled conditions, results in the formation of the so-called “coffee-ring” and leads to an increase in the concentration of the analyte in specific areas of the substrate and then in the higher intensity of their Raman spectral bands. This is the case of the Drop Coating Deposition Raman (DCDR) strategy in which a drop of some fluid containing a solute or suspended particles dries on a solid surface. Under the adequate conditions the drying of the drop leaves a ring-shaped structure on its outer surface, commonly known as a “coffee-ring”. Coffee ring formation has been widely used to achieve preconcentration of biological material such as proteins, viruses, bacteria, etc.16–18 The DCDR technique in combination with Raman signal enhancement techniques such as graphene enhanced Raman spectroscopy (GERS) have showed to be an excellent combination to significantly enhance the Raman signal of various biomolecules, as well as in the design of structures to control the specificity for biomarker detection.19,20
GERS spectroscopy is based on the use of graphenic substrates (GS) such as pristine graphene (G), graphene oxide (GO) or reduced graphene oxide (rGO) as Raman signal enhancement substrates.19,21,22 Graphene oxide-type substrates can interact, through their basal plane aromatic domain and/or their edge-located oxygenated polar species, with aromatic or polar molecules giving rise to rich and complex association processes between them. These interactions would be responsible, through a charge transfer mechanism, for an increase of the adsorbed molecule polarizability which promotes the amplification of their Raman signals.19,21,22 In this sense, in a previous publication of our group19 we showed that the detection limits of IL-6 deposited on rGO substrates, was better than 1 pg mL−1, corresponding with an absolute mass as low as 1 fg.
GERS spectroscopy has become an important alternative for the sensitive detection of biomolecules, with the additional advantage over Au or Ag nanoparticles-mediated amplification (SERS), of its higher reproducibility and very low, if any, spectral deformation of the deposited molecular species. This fact leads to a more reliable and reproducible identification of their vibrational modes.19,21 Moreover, the physicochemical properties of graphene materials can be modified by changing the oxygenated groups in their basal plane and at their edge, or by controlling the arrangement and thickness of the thin films of graphenic substrates (GS) on multilayers supports. The possibility to adjust their physicochemical properties allows the promotion of a great variety of specific interactions (electrostatic, hydrogen bridges, π–π, hydrophobic) with different biomolecules and metabolites, such as hemoglobin,23 albumin,23 human interleukin-6,19 5-S-cysteinyl-dopamine,24 DNA,25 among others, which makes GS attractive and versatile materials for the development of highly specific and sensitive biosensors. The versatility of GS to modify their physicochemical properties helps, to a great extent, to adsorb on them molecular species that provides specificity for the recognition of various antigens.
In this work, monoclonal antibodies of interleukin-6 (mabIL-6) were used for the functionalization of GSs, in order to provide specificity for the recognition of human interleukin-6. The resultant GS/mabIL-6/IL-6 systems were analyzed mainly by using Raman images, in order to obtain physical, chemical and structural information of the system as well as visualizing the spatial distribution of their components.
Experimental
Materials
Graphene oxide powder was purchased from Graphenea (San Sebastian, Spain), interleukin-6 (IL-6) and monoclonal antibody of interleukin-6 (mabIL-6) were provided by the Research Support Network a Consortium of the National Institutes of Health and UNAM.Synthesis of reduced graphene oxide (rGO)
The reduction of graphene oxide was made according to the methodology described in our previous work.21 In short, the reduction of graphene oxide was performed in a U reactor. Commercial GO gray powder was heated at 400 °C for 2 h under constant flow of a 100 mL min−1 H2/Ar (10% H2 balance Ar) mixture. Spectroscopic characterization by UV-Vis and Raman are shown in Fig. S1 and S2 in ESI.†Amination of rGO (rGO–NH2)
To a saturated solution of ethylenediamine (EDA, NH2(CH2)2NH2) powdered rGO was added while stirring at room temperature for 10 hours. The solution was washed with 25 mL of tetrahydrofuran (THF, C4H8O) and then filtered by dialysis (molecular weight of 12–14 kDa) for 48 hours with three washes with deionized water. In this reaction, of the two NH groups present in EDA, one is used to form amide bonds with the COOH− group of the rGO through the CO–NH bond, while the other NH2 group is left free on the surface of the rGO. The product obtained (rGO–NH2) contains a large amount of –NH2 functional groups to anchor by covalent bonds different biological material through the formation of amide bonds, as in this case to anchor monoclonal antibodies of interleukin-6. Spectroscopic characterization by FTIR is shown in Fig. S3 in ESI.†Langmuir–Blodgett assembly of rGO–NH2 and GO
Langmuir–Blodgett (LB) films of rGO–NH2 and GO were made according to the methodology described in our previous work.21 In short, an aqueous dispersion of rGO–NH2 and GO was mixed (separately) with methanol in 1![[thin space (1/6-em)]](https://www.rsc.org/images/entities/char_2009.gif) :
:![[thin space (1/6-em)]](https://www.rsc.org/images/entities/char_2009.gif) 5 volumetric ratio. LB deposition was performed in a trough KSV 5000 alternate multilayer LB system (KSV Finland). The rGO–NH2 and GO monolayers, separately, were transferred to a clean Si/SiO2 substrate using the vertical lifting method at 22 °C.
5 volumetric ratio. LB deposition was performed in a trough KSV 5000 alternate multilayer LB system (KSV Finland). The rGO–NH2 and GO monolayers, separately, were transferred to a clean Si/SiO2 substrate using the vertical lifting method at 22 °C.
Drop coating deposition of mabIL-6 on Si/SiO2 and LB thin films of rGO–NH2 and GO
In order to prepare the mabIL-6/GS/SiO2/Si array, 2.5 microliters of mabIL-6 solution (0.8 ng mL−1) were deposited on GO or rGO–NH2 LB films supported on Si/SiO2, at room temperature and 25% relative humidity. The whole experimental setup (graphenic substrates and mabIL-6) was placed into a plastic bag with dried silica for moisture control. Under these conditions, an approximately 20 micrometers wide coffee ring of mabIL-6 was formed at the external part of Si/SiO2 support covered with GO or rGO–NH2 substrates. This setup allowed to obtain reliable reproducible mabIL-6 coffee ring on the graphenic substrates.Adsorption of IL-6 on the coffee ring of mabIL-6
The nanostructured substrates, with the mabIL-6 coffee ring formed, were plated on cell culture plates and then 100 microliters of 1 ng mL−1 IL-6 solution were added to the wells. It was left to interact for 2 hours in an orbital oscillator, and then the sample was washed several times to remove the not adsorbed material. The samples were then placed for one hour in the controlled relative humidity plastic bag to remove the water excess and then they were studied by Raman spectroscopy and Raman images.Raman measurements
Raman spectra were recorded using WITec Alpha 300 Series Raman-AFM (WITec GmbH, Ulm, Germany) and 672 lines per mm grating with a 20× (0.4 NA) and 100× (0.9 NA) Zeiss objectives. An Nd:YVO4 green laser with a wavelength of 532 nm was used as an excitation source with 3.56 mW of laser power. Punctual Raman spectra, with 4 s of integration time and 25 accumulations, were acquired in the “coffee ring” formed for each drop coated on the corresponding rGO–NH2 or GO substrate; 25 spectra were acquired and averaged at different points on the coffee ring.Raman image analysis
Raman images were obtained using a point-mapping method include in the WITec project Plus software of the Raman spectrometer. Point-mapping operates through a multivariate analysis method, namely true component analysis. In brief, it uses a linear combination of spectra (components) to describe each pixel of the image. The software automatically finds the components (previously known spectra) within the spectral mapping and provides individual spectra (components) to create intensity distribution images, which show the distribution of the different spectra that make up the image.26Results
Raman spectra of IL-6 and monoclonal antibody of interleukin-6
Human interleukin-6 is a multifunctional protein with a molecular weight of 21 kDa consisting of 184 amino acids with α-helical conformation, with two potential sites of N-glycosylation and four cysteine residues. In a previous work we discussed the Raman spectroscopy characterization of interleukin-6, assigning most of its vibrational modes and corroborating the presence of amide-I band at the expected frequency value for a protein with α-helix secondary structure conformation.19,27On the other hand, the monoclonal antibody of interleukin-6 (mabIL-6) belongs to the subclass of IgG immunoglobulins, having a preponderant (70%) β-sheet secondary structure with an approximated molecular weight of 150 kDa.28,29
Fig. 1 shows, for comparison purposes, the fingerprint region of IL-6 and mabIL-6 Raman spectra. Under the best of our knowledge there is no previous report in the literature or in some specialized data base of the mabIL-6 Raman spectrum and therefore the assignment of its main bands is presented for the first time in Table 1. Bands at 760 and 857 cm−1 are related with the vibrational breathing modes of the aromatic rings of the tryptophan and tyrosine, respectively. Similarly, band at 1006 cm−1 will be due to the ring breathing vibration of the phenylalanine30–33 while the band at 1353 cm−1 is associated with the deformation of the tryptophan ring.30–33
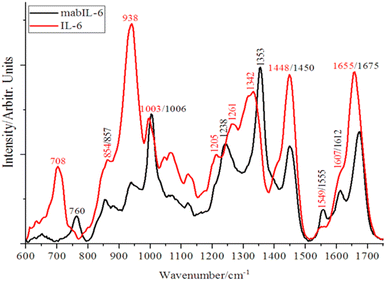 | ||
| Fig. 1 Fingerprint region of Raman spectrum of powdered lyophilized interleukin-6 (IL-6) and 2.5 μL at 4 mg mL−1 of monoclonal antibody of interleukin-6 (mabIL-6). | ||
| IL-6 | mabIL-6 | ||
|---|---|---|---|
| Wavenumber (cm−1) | Band assignment | Wavenumber (cm−1) | Band assignment |
| 708 | C–S stretching vibration of cysteine residues19 | 760 | Tryptophan, ring breathing vibration30–33 |
| 854 | Tyrosine, ring breathing vibration19 | 857 | Tyrosine, ring breathing vibration30–33 |
| 938 | C–C stretching backbone for α-helix conformation19 | 1006 | Phenylalanine, ring breathing vibration30–33 |
| 1003 | Phenylalanine, ring breathing vibration19 | 1238 | Amide III with β-sheet conformation30–33 |
| 1205 | Ring deformation of tyrosine and phenylalanine19 | 1353 | Tryptophan, ring deformation vibration30–33 |
| 1261 | Amide III with α-helix conformation19 | 1450 | CH2 and CH3 bending vibrations30–33 |
| 1342 | Cα–H deformation19 | 1555 | Amide II vibration30–33 |
| 1448 | CH2 and CH3 bending vibrations19 | 1612 | Aromatic ring vibration of tyrosine and phenylalanine30–33 |
| 1549 | Amide II vibration19 | 1675 | Amide I with β-sheet conformation30–33 |
| 1607 | Aromatic ring vibration of tyrosine and phenylalanine19 | ||
| 1655 | Amide I with α-helix conformation19 | ||
On the other hand, the location and shape of the amide-III band at 1238 cm−1 and the amide-I band at 1675 cm−1 allows to confirm the β-sheet conformation of the secondary structure of mabIL-6.30–33 The band assignments of both, IL-6 and mabIL-6, are presented in detail in Table 1.
As can be seen from Fig. 1 and Table 1, the significant differences of the IL-6 and mabIL-6 spectral profiles allows the use of Raman spectroscopy to discern if IL-6, mabIL-6 or a mixture of both are present on a substrate. The difference in the secondary structure of these analytes makes it easy and reliable to distinguish between them by Raman spectroscopy.
Interaction of IL-6 with monoclonal antibody of IL-6 functionalized graphene substrates
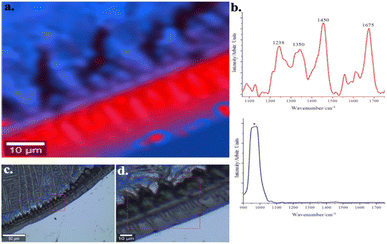
After demonstrating the viability of employing Raman spectroscopy to detect, identify, and distinguish interleukin-6 and its monoclonal antibody (mabIL-6), the next challenge was to create an optimized substrate that could selectively and sensitively detect IL-6.As a previous step, a Raman image study was conducted to demonstrate the ability to form a mabIL-6 coffee-ring using the DCDR approach. For this purpose, a mabIL-6 solution drop was deposited and dried on a Si/SiO2 support, as described in the Experimental section. Fig. 2 shows the Raman image of a portion of the mabIL-6 coffee ring formed on the Si/SiO2 support. For the generation of the image, a set of Raman spectra were collected point by point inside a selected area and the spatial distribution of the spectra was displayed. Only two kinds of spectra were observed in the analyzed area, one corresponding to the Si support (blue colour) and the other related with the mabIL-6 (red colour). The Raman image shows the distribution of both spectra confirming the formation of a mabIL-6 coffee-ring on the solid support under these experimental conditions. From both optical and Raman images, neither discontinuities nor fractures of the coffee-ring are observed, indicating its homogeneous formation along the outer circular area of the Si/SiO2 support. It is important to note that the spectral signal of mabIL-6 was detected only on the coffee-ring and not in the central area surrounded by the ring.
Knowing the feasibility to generate a coffee-ring of mabIL-6 through the DCDR technique, and the ability of Raman images to visualize the distribution of the supported monoclonal antibody, two experimental tests were carried out in order to develop a graphene substrate with the desired functionalities for the selective and sensitive detection of IL-6. For this purpose, two different graphenic substrates were tested: (i) as received commercial GO and (ii) amine functionalized rGO (rGO–NH2). The selectivity to IL-6 was promoted by the deposition of mabIL-6 on both substrates, creating a specific binding site for IL-6. The enhancement of the Raman signal of both IL-6 and mabIL-6 was assumed by the GERS effect of the substrate.
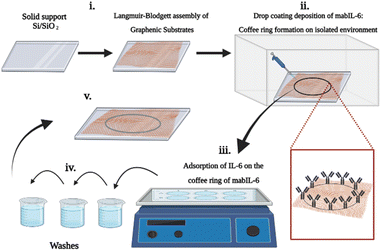
For each test, single layer films of the different graphenic substrates were deposited on Si/SiO2 support by the Langmuir–Blodgett (LB) technique as described in the Experimental section. Scheme 1 shows the different steps for the LB assembly of GS (rGO–NH2 and GO) on Si/SiO2 support; the formation of mabIL-6 coffee-ring on the GS; and the binding of IL-6 on the mabIL-6 coffee ring.
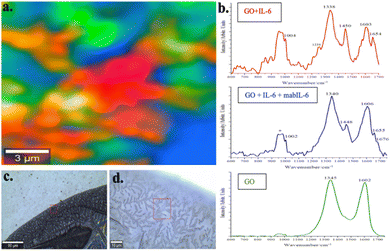
Fig. 3 shows the Raman image of IL-6 attached on the mabIL-6 coffee-ring previously formed on a GO monolayer. The red color in the image corresponds with the red spectrum of the Fig. 3b where IL-6 bands (amide I α-helix 1654 cm−1; 1004, 1238, and 1450 cm−1) and GO bands (1338 and 1603 cm−1) are present.34,35 On the other hand, the blue color in the same image corresponds with the blue spectra of Fig. 3b which is dominated by GO bands (1340 cm−1 and 1606 cm−1), overlaid by minority bands corresponding to amide I of IL-6 (1655 cm−1) and mabIL-6 (1676 cm−1). Finally, the green color area corresponds with GO free of interactions with mabIL-6 or IL-6.
The analysis of the coffee-ring Raman image in Fig. 3 indicates a non-uniform random distribution of both IL-6 and mabIL-6 on the GO monolayer. In effect, GO substrate is present in the whole coffee-ring area but has a different pattern of interaction with mabIL-6 and IL-6. Uncovered GO domains (green areas) coexist with other zones where mabIL-6 and IL-6/GO interacts in different ways. Blue domains represent rich zones in GO with small amounts of IL-6 and mabIL-6, meanwhile the red domains correspond to areas with the highest IL-6 signals in the absence of mabIL-6. This last fact could mean that the antibody is absent in these areas or that it is covered by IL-6 which hides the spectral signal of the antibody. Assuming the last option, the coexistence of mabIL-6 and IL-6 signals (1655 and 1676 cm−1) in the blue domains should be interpreted as mabIL-6 being only partially covered by IL-6.
In view of the inconclusive nature of the above results and in order to achieve a specific and reliable IL-6/mabIL-6 interaction, the GO substrate was substituted by rGO functionalized with ethylenediamine.
The primary consideration for using an amine-functionalized rGO substrate was to facilitate punctual and localized binding of mabIL-6. This is achieved through the strong interaction between the amino groups of the graphenic substrate and the carboxyl terminal groups of the antibody light chains.38,39 On the other hand, it was also considered that the increase in size of the aromatic domain, resulting from GO reduction, would favor π–π interactions with the aromatic amino acid side chains of mabIL-6. As a result of these factors, interactions between the rGO–NH2 functionalized substrate and mabIL-6 would be more defined and reliable.
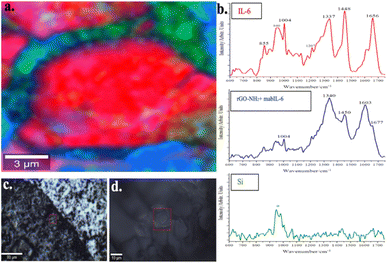
Fig. 4 shows a representative Raman image of the rGO–NH2/mabIL-6/IL-6 array in the coffee-ring area. The whole image is dominated by the presence of red domains whose spectra show the band centered at 1656 cm−1, characteristic of a protein amide I band with a secondary α-helix structure, as is the case of IL-6. Furthermore, the additional bands present in the spectra of these domains centered at 885, 940, 1004, 1207, 1337 and 1448 cm−1 also correspond to IL-6 vibrational modes (see Fig. 1 and Table 1). In conclusion, there are no bands other than those of IL-6 present in the spectra of the red domains. The absence of mabIL-6 signal in the red domains of Fig. 4 is consistent with the formation of an IL-6 upper layer, which overlaps the mabIL-6 and rGO–NH2 sublayers and hide their Raman signals.
On the other hand, the spectra of the blue domains in Fig. 4 are dominated by the D and G bands (1340 and 1603 cm−1)36,37 of the rGO–NH2, together with other band centered at 1677 cm−1 corresponding to the vibrational mode of amide I of mabIL-6. Consequently, these domains are associated with areas where the rGO–NH2 is covered only with mabIL-6 without a noticeable presence of IL-6. Finally, the elongated green domains represent areas of uncovered Si support.
The former findings strongly suggest that the coffee-ring area of the rGO–NH2/mabIL-6/IL-6 system is dominated by a stratified structure formed by an upper layer of IL-6 covering the mabIL-6 and rGO–NH2 sublayers and hiding their spectral signals. These structures represent the specific adsorption sites of IL-6 on the mabIL-6.
On the other hand, green minority domains represent uncoated Si areas, while blue ones correspond to IL-6 uncoated rGO–NH2/mabIL-6 arrays.
Raman imaging is then confirmed as an important label-free analytical tool able to show the distribution of the antigen–antibody interaction sites. Moreover, it is important to highlight that IL-6 vibrational signals were only detected on the mabIL-6 coffee-ring area, confirming that this experimental approach can be used to develop an easy to make biosensor for the specific detection of IL-6. This conceptual approach can be used to specifically detect biomarkers through antigen–antibody interaction. To achieve this, it is important to carefully modulate the attachment of the antibody to the graphenic substrate, ensuring that the active sites of the antibody remain available for binding to the antigen.
Conclusions
The appropriate use of the DCDR technique allows the concentration of the mabIL-6 molecules on a coffee ring structure located at the periphery of silicon-supported graphenic substrates.The mabIL-6 coffee ring behaves as the area where the antigen/antibody selective interaction take place. IL-6 molecules were exclusively detected on the mabIL-6 coffee ring and not in the central area of the graphenic substrate.
The modes of antigen/antibody interaction showed a strong dependence on the functionalization of the substrate. The amine-functionalized rGO substrates showed a more consistent selective interaction pattern than those of pristine commercial GOs.
For GO substrates several domains with different antigen/antibody/substrate interactions types were present and there is no evidence that a specific and selective type of interaction take place.
On the other hand, for the rGO–NH2 substrates a preferential antigen/antibody interactions mode is observed with a spectral profile consistent with the formation of a rGO–NH2/mabIL-6/IL-6 layered array. This array suggests that the attachment of the antibody with the substrate occurs through the interaction of the substrate amine groups with the long chain antibody carboxyl groups, leaving free the antibody specific interaction sites with the IL-6.
Raman imaging was confirmed as a versatile tool to investigate different antigen–antibody interactions and their surface distribution.
This experimental approach can be used to develop a wide variety of substrates for antigen–antibody interaction allowing the specific detection of an analyte in a complex matrix.
Author contributions
Emmanuel de la O.-Cuevas: investigation, methodology, conceptualization, formal analysis, writing original draft. Selene R.-Islas: investigation, resources, writing – review & editing. Perla Gallegos-Flores: writing – review & editing, E. L. Esparza-Ibarra: writing – review & editing. H. Tototzintle-Huitle: writing – review & editing, José M. Saniger: conceptualization, resource, writing – review & editing, supervision, funding acquisition.Conflicts of interest
There are no conflicts of interest to declare.Acknowledgements
Author's would like to thank for the support of the project DGAPA IT-100721 and CONACyT, México FC-2016-2014. E. O. C. wish to acknowledge financial support from CONACyT, México postdoctoral fellowship. The authors thank the Laboratorio Universitario de Caracterización Espectroscópica, LUCE-ICAT-UNAM, for granting access to spectroscopic characterization techniques, and Violeta Álvarez-Venicio and María del Pilar Carreón-Castro, from ICN-UNAM, for granting access to the Laboratorio de Nanopelículas.Notes and references
- G. Cem, Arthritis Res. Ther., 2006, 8(2), 1–6 Search PubMed.
- M. Erta, A. Quintana and J. Hidalgo, Int. J. Biol. Sci., 2012, 8(9), 1254 CrossRef CAS PubMed.
- J. Shekhawat, et al., Indian J. Clin. Biochem., 2021, 36(4), 440–450 CrossRef CAS PubMed.
- Z. S. Ulhaq, Med. Mal. Infect., 2020, 50(4), 382 CrossRef PubMed.
- L. Hoejberg, et al., Melanoma Res., 2012, 22(4), 287–293 CrossRef CAS PubMed.
- K. Shimamoto, et al., J. Rheumatol., 2013, 40(7), 1074–1081 CrossRef CAS PubMed.
- I. Badillo-Ramírez, et al., Biosensors, 2022, 12(4), 244 CrossRef PubMed.
- H. Wu, et al., Analyst, 2008, 133(11), 1550–1555 RSC.
- G. Wang, et al., Langmuir, 2011, 27(3), 1224–1231 CrossRef CAS PubMed.
- N. P. Sardesai, et al., Anal. Bioanal. Chem., 2013, 405(11), 3831–3838 CrossRef CAS PubMed.
- G.-C. Fan, et al., Biosens. Bioelectron., 2014, 59, 45–53 CrossRef CAS PubMed.
- B. Zhang, Nano Res., 2013, 6(2), 113–120 CrossRef CAS.
- P. Chen, ACS Nano, 2015, 9(4), 4173–4181 CrossRef CAS PubMed.
- A. Kamińska, et al., Sci. Rep., 2017, 7(1), 1–11 CrossRef PubMed.
- E. Wiercigroch, et al., Microchim. Acta, 2022, 189(1), 1–10 CrossRef PubMed.
- P. Šimáková, E. Kočišová and M. Procházka, J. Raman Spectrosc., 2013, 44(11), 1479–1482 CrossRef.
- J. Filik and N. Stone, Analyst, 2007, 132(6), 544–550 RSC.
- C. Ortiz, et al., Anal. Biochem., 2006, 353(2), 157–166 CrossRef CAS PubMed.
- E. de la O-Cuevas, et al., RSC Adv., 2019, 9(22), 12269–12275 RSC.
- V. Ranc and Z. Chaloupková, Analyst, 2020, 145(23), 7701–7708 RSC.
- E. de la O-Cuevas, et al., Spectrochim. Acta, Part A, 2021, 246, 119020 CrossRef CAS PubMed.
- W. Xu, N. Mao and J. Zhang, Small, 2013, 9(8), 1206–1224 CrossRef CAS PubMed.
- S. Huang, et al., ACS Photonics, 2018, 5(8), 2978–2982 CrossRef CAS.
- I. Badillo-Ramírez and et al, ., New J. Chem., 2019, 43(40), 15861–15870 RSC.
- C. Lu, et al., Langmuir, 2016, 32(41), 10776–10783 CrossRef CAS PubMed.
- W. GmbH, WiTec Project 5 Plus True Component Analysis, WiTec, Ulm, Germany, 2018, p. 2018 Search PubMed.
- R. J. Simpson, et al., Protein Sci., 1997, 6(5), 929–955 CrossRef CAS PubMed.
- G. Vidarsson, G. Dekkers and T. Rispens, Front. Immunol., 2014, 5, 520 Search PubMed.
- W. Wang, et al., J. Pharm. Sci., 2007, 96(1), 1–26 CrossRef CAS PubMed.
- A. Rygula, et al., J. Raman Spectrosc., 2013, 44(8), 1061–1076 CrossRef CAS.
- A. C. S. Talari, et al., Appl. Spectrosc. Rev., 2015, 50(1), 46–111 CrossRef CAS.
- H. J. Bulter, et al., Nat. Protoc., 2016, 11(4), 664–687 CrossRef PubMed.
- K. Majzner, et al., Vibrational imaging of proteins: changes in the tissues and cells in the lifestyle disease studies in Vibrational Spectroscopy in Protein Research, From Purified Proteins to Aggregates and Assemblies, in Y. Ozaki, M. Baranska, I. Lednev, B. Wood, Academic Press, 2020, pp. 177–218 Search PubMed.
- A. E. F. Oliveira, et al., J. Mater. Sci., 2018, 53(17), 12005–12015 CrossRef CAS.
- A. Kaniyoor and S. Ramaprabhu, AIP Adv., 2012, 2(3), 032183 CrossRef.
- N. H. Kim, T. Kuila and J. H. Lee, J. Mater. Chem. A, 2013, 1(4), 1349–1358 RSC.
- B. Xue, et al., Catal. Commun., 2015, 64, 105–109 CrossRef CAS.
- N. G. Welch, et al., Biointerphases, 2017, 12(2), 02D301 CrossRef PubMed.
- J. H. Jung, et al., Angew. Chem., 2010, 122(33), 5844–5847 CrossRef.
Footnote |
| † Electronic supplementary information (ESI) available. See DOI: https://doi.org/10.1039/d3ra01627g |
| This journal is © The Royal Society of Chemistry 2023 |

