 Open Access Article
Preparation of CuO@humic acid@carbon nanotube composite material using humic acid as a coupling agent and its lithium-ion storage performance†
Bo Liang‡
 a,
Tingting Yang‡c,
Huiqian Yangb,
Jinsheng Zhao*b and
Yunyun Dong
 *b
*b
aSchool of Aviation and Transportation, Jiangsu College of Engineering and Technology, Nantong 226000, China
bShandong Key Laboratory of Chemical Energy Storage and Novel Cell Technology, School of Chemistry and Chemical Engineering, Liaocheng University, Liaocheng 252000, China. E-mail: j.s.zhao@163.com; dongyunyun@lcu.edu.cn
cSchool of Automotive Engineering, Wuhan University of Technology, Wuhan 430070, China
First published on 14th August 2023
Abstract
The conventional Li-ion battery composite electrode material composed of CuO and carbon nanotubes (CNTs) suffer from poor contact between CuO and CNTs. This results in high electrode resistance and poor electrochemical performance. To solve this problem, CuO@humic acid (HA) @CNT anode material with cross-linked network structure was generated by linking CuO and CNT with HA as a coupling agent. For comparison, CuO@HA or CuO@CNT were also prepared in the absence of CNT or HA, respectively. The results showed that CuO@HA@CNT had lower charge transfer resistance, higher conductivity, lithium-ion diffusion coefficient, specific capacity, and rate capability than CuO@HA and CuO@CNT. The specific capacity of the CuO@HA@CNT electrode was significantly better than that of the composite electrode materials of CuO and CNT, which have been prepared by scientists using various methods. Due to the introduction of HA, not only was the uniformly distributed flower-like CuO obtained, but also the specific capacity and rate capability of the electrode material were substantially improved. This study thus provides a good strategy to optimize the capability of transition metal oxide lithium-ion anode materials.
1. Introduction
With the rapid development of the electric vehicle industry, the exploration and development of lithium-ion batteries (LIBs) with higher energy density is currently the focus of research in energy storage.1 Graphite is a commonly used electrode material, but due to the limitations of its inherent defects, it cannot meet the requirements of high power and fast charging at present.2,3 The CuO metal oxide anode materials, however, are gradually being favored by scientists due to their non-toxicity, high energy storage capacity, and high theoretical capacity.4 As with most metal oxides, there are two challenges in applying CuO as anode material of LIBs. On the one hand, its own electronic conductivity is poor.5,6 On the other hand, the volume expansion of CuO over the course of a cycle causes the electrode material to shatter and detach from the current collector, leading to a rapid deterioration of electrochemical performance. In previous studies, combining carbon substrates with CuO has been shown to be an effective way to overcome these difficulties, because the highly conductive and flexible carbon matrix can serve as both a conductive additive and a volume expansion buffer matrix, which can effectively alleviate the capacity decay of CuO.7,8 Researchers have improved the electrochemical properties of the materials by modulating the CuO morphology and size,9–17 and compounding CuO with other metal oxides18–20 or carbon materials.7,21–23 Carbon materials often used for compounding with CuO are graphene, graphene oxide, carbon nanotube (CNT),24,25 and multi-walled carbon nanotubes (MWCNT). Among them, CNT or MWCNT is the most widely used, as shown in the following examples.An electrode material containing CuO nanosheets and MWCNT was prepared by W. Yuan26 using electrophoretic deposition and solution etching. The reversible capacity was close to 540 mA h g−1 at 100 mA g−1, which was much higher than that of CuO anode material without MWCNT. MWCNT not only promoted electron transfer but also enhanced the structural stability of the CuO nanosheets. The porous cross-linked network structure reduced the electrode resistance, improved electrode's capacity and rate capability, and increased electrode's life. S. Lee27 synthesized forest-like CuO/CNT nanocomposites on the CNT surface by taking advantage of the CNT network structure. The electrode material can accommodate a large amount of Li+ ions due to its highly conductive staggered 3D structure, and therefore displayed a good specific capacity (approx. 700 mA h g−1 at 425 mA g−1). S. M. Abbas28 synthesized CuO nanospheres/CNTs composite electrode materials by simple solution reaction in the presence of CNTs using CuCl2 as raw material. The small size and good dispersion of CuO nanorods contributed to the diffusion of Li+ during the charging and discharging process. CNTs had a huge specific surface area, allowing the CuO to be in full contact with the electrolyte, thus generating larger capacity. CNTs acted as conductive channels between the CuO nanostructure and current collectors, thus lowering the internal resistance of the electrodes and boosting the conductivity. The synergistic interaction between the two led to their elevated performance in terms of specific capacity, cycling property, and coulombic efficiency.
X. Cui29 synthesized CNT entangled copper nanowire network structures in a molten mixture of hexadecylamine and cetyltrimethy ammonium bromide through a catalytic growth process, followed by further in situ thermal oxidation to CuO/CNT with network structures. Binder-free and conductive additive-free anodes constructed with this network structure exhibited remarkably promising electrochemical performance. Thin CuO nanowires of 7 ± 3 nm in diameter, 103–104 in aspect ratio and 51.08 m2 g−1 in specific surface area were prepared by H. Huang.30 Subsequently, a thin CuO nanowire/CNT interpenetrating network was prepared, and the electrochemical performance of the lithium battery electrodes prepared by this network structure was significantly better than that of the control. The optimum electrochemical performance was achieved when the mass fraction of CNT in the CuO nanowire/CNT interpenetrating network was 33.3 wt%.
The anode materials reported in the above literature are all complexes of CuO and CNT, which still suffer from poor rate capability and specific capacity. This is due to the poor electrical conductivity of CuO itself, the uneven distribution of CuO morphology, and the small contact surface between CuO and CNT, and consequently leads to high electrode resistance and poor electrochemical performance.
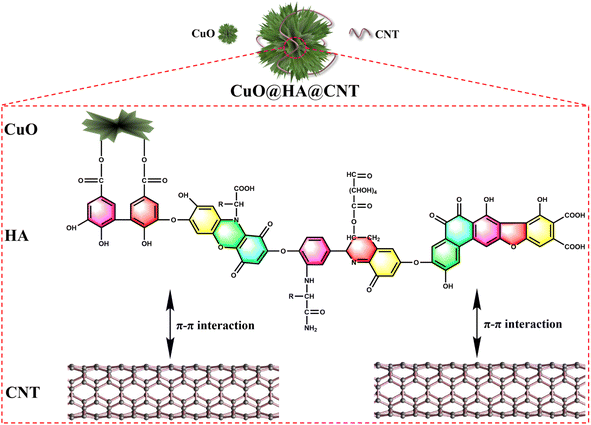
Humic acid (HA) is a product of decomposition and transformation of plant and animal remains. Humic acid is rich in resources, reserves and distribution,31–33 and contains many carboxyl, quinone, and hydroxyl groups, which can combine with metal ions (especially heavy metal ions) to form complexes.34 In this paper, CuO@HA@CNT anode materials (Fig. 1) with a cross-linked network structure was generated by linking CuO and CNT with HA as coupling agent. On the one hand, the carboxyl group of HA molecule reacted with the hydroxyl group on the surface of CuO to generate ester groups; on the other hand, HA molecule generated strong π–π interaction forces with the electron-rich CNTs. As a result, under the action of HA, CuO was firmly fixed on the CNT surface under the effect of HA, which accommodated the volume expansion, lowered the internal resistance, increased the conductivity, and improved the electrode reaction kinetics. For comparison, CuO@HA and CuO@CNT without CNT or HA were also prepared, respectively, and the structures, morphologies and electrochemical properties of CuO@HA@CNT, CuO@HA and CuO@CNT were compared and analyzed.
2. Experimental section
2.1. Experimental reagents
HA, Tianjin Chemical Reagent Company; CNT (98%), Beijing Deke Daojin Science and Technology Co., Ltd; CuSO4·5H2O, Tianjin Chemical Reagent Company; polyvinylidene fluoride (PVDF) and conductive black (Super P), Liyuan Battery Sales Department.2.2. Synthesis of the three composite electrode materials
200 mg HA, 200 mg CNT, and 1.0 g of cetyl trimethyl ammonium bromide (CTAB) were solubilized in deionized water and mixed for 0.5 h at room temperature. Then 630 mg of CuSO4·5H2O was added. Ammonia was then added after complete dissolution to adjust the pH of the solution to 10. The mixture above was heated by microwave at 130 °C for 3 h, centrifuged for 15 min, and washed three times to obtain an intermediate product. The intermediate product was thoroughly ground and placed in a tube furnace and pyrolyzed under air atmosphere at 350 °C for 2 h (heating rate 5 °C min−1), with the final product being CuO@HA@CNT. Under the same reaction conditions, CuO@CNT or CuO@HA were prepared without the addition of HA or CNT, respectively.2.3. Test methods
The physical properties test method of electrode material, the preparation method of lithium battery, and the electrochemical properties test method are presented in ESI.†3. Results and discussions
3.1. XRD, Raman, TGA, and nitrogen adsorption/desorption isotherms analyses
Fig. 2a shows the XRD spectra of the three samples. According to the JCPDS standard card PDF#41-0254, four sharp diffraction peaks at 32.5°, 38.7°, 48.7°, and 61.5° of the three composites corresponded to the (002), (111), (![[2 with combining macron]](https://www.rsc.org/images/entities/char_0032_0304.gif) 02), and (022) crystal planes of CuO, which indicated the presence of CuO in all three samples. The XRD patterns of both CuO@HA@CNT and CuO@CNT showed a broad peak at 25° compared to CuO@HA, which corresponded to the (002) plane of the graphite structure,35 indicating that the composites were doped with CNT. From the Raman spectra in Fig. 2b, it could be seen that all three composites had distinct peaks at 1342 and 1597 cm−1, and this corresponded to the D-band (defect-induced band) and G-band (crystalline graphite band) of the carbon material, respectively. The intensity ratio (ID
02), and (022) crystal planes of CuO, which indicated the presence of CuO in all three samples. The XRD patterns of both CuO@HA@CNT and CuO@CNT showed a broad peak at 25° compared to CuO@HA, which corresponded to the (002) plane of the graphite structure,35 indicating that the composites were doped with CNT. From the Raman spectra in Fig. 2b, it could be seen that all three composites had distinct peaks at 1342 and 1597 cm−1, and this corresponded to the D-band (defect-induced band) and G-band (crystalline graphite band) of the carbon material, respectively. The intensity ratio (ID![[thin space (1/6-em)]](https://www.rsc.org/images/entities/char_2009.gif) :
:![[thin space (1/6-em)]](https://www.rsc.org/images/entities/char_2009.gif) IG) of CuO@HA@CNT, CuO@CNT, and CuO@HA were 1.18, 1.09, and 0.96, respectively, indicating that the highest content of defective carbon atoms was found in CuO@HA@CNT.
IG) of CuO@HA@CNT, CuO@CNT, and CuO@HA were 1.18, 1.09, and 0.96, respectively, indicating that the highest content of defective carbon atoms was found in CuO@HA@CNT.
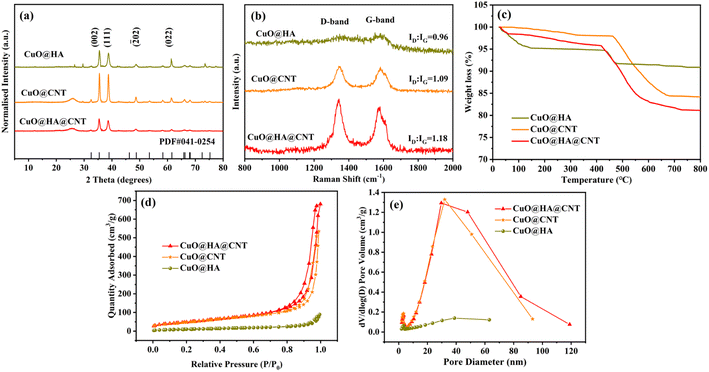 | ||
| Fig. 2 (a) XRD patterns, (b) Raman spectra, (c) TGA curves, (d) nitrogen adsorption/desorption isotherms, and (e) pore size distributions of CuO@HA@CNT, CuO@CNT, and CuO@HA. | ||
Fig. 2c displays the thermos-gravimetric analysis (TGA) curves of the three samples. The weight loss below 100 °C of the CuO@HA, CuO@CNT, and CuO@HA@CNT samples was attributed to the evaporation of adsorbed water vapor on the sample surfaces. For CuO@HA and CuO@HA@CNT, the decomposition of HA occurred at around 450 °C. In CuO@CNT and CuO@HA@CNT, the decomposition of CNT was divided into two stages, the first stage between 200–400 °C, where impurities and organic substances on the surface or inside the structure of the CNT began to desorb and decompose; the second stage was between 400–800 °C, where the carbon framework of the CNT began to decompose, and gradually lost its crystalline properties, and the internal impurities and cracks in CNT also led to its instability and further decomposition.36–38 There was basically no further change in the weight of the three at about 800 °C. And the carbon contents of CuO@HA@CNT, CuO@CNT, and CuO@HA could be calculated to be 18.8%, 15.9%, and 9.2%, respectively. CuO@HA@CNT, CuO@CNT, and CuO@HA all showed typical type III isotherms and H3 hysteresis loops, as indicated in Fig. 2d. As could be seen from Fig. 2e, the pore size distribution of CuO@HA@CNT was mainly between 30 to 50 nm. CuO@HA@CNT and CuO@CNT had much higher specific surface areas of 176.8 and 178.8 m2 g−1 than CuO@HA (40.4 m2 g−1). This was mainly due to the large specific surface area provided by the reticular structure of CNT. The larger specific surface area and mesoporosity could accelerate the diffusion and electron transfer of Li+.
3.2. Morphological and XPS analysis
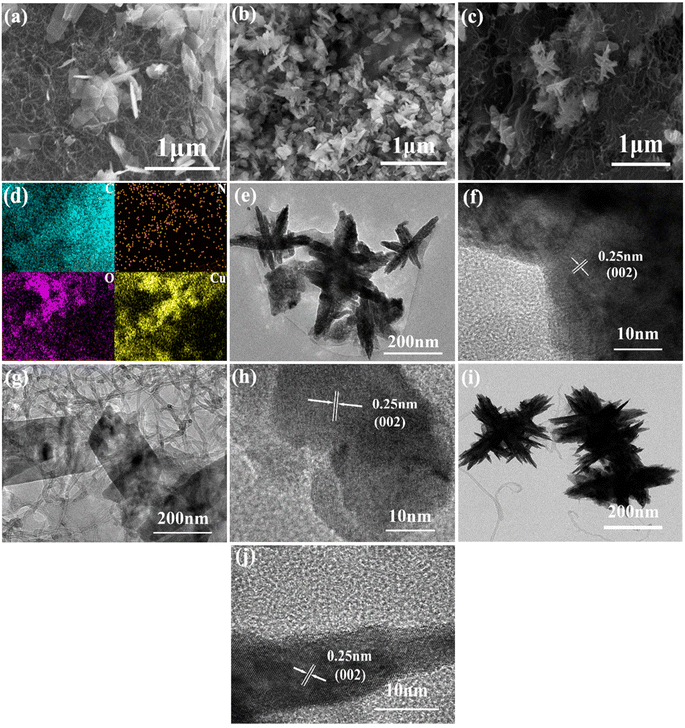
As indicated in Fig. 3, the morphologies of CuO@HA@CNT, CuO@CNT, and CuO@HA samples were clearly different, while in Fig. 3a–c, the CuO in CuO@CNT was in the form of flakes, which were loosely fixed on the CNTs and unevenly dispersed; the CuO in CuO@HA showed a flower-like structure and was uniformly dispersed; the CuO in CuO@HA@CNT also exhibited a flower-like structure and was also uniformly dispersed on the CNT network. As shown in Fig. 3d, the EDS spectrum showed that CuO@HA@CNT contained the elements C, N, O, and Cu, with N originating from HA.Fig. 3e–j show the transmission electron microscope photographs of CuO@HA@CNT, CuO@CNT, and CuO@HA. It could be noticed that there was a set of lattice stripes with a spacing of 0.25 nm in all three samples, which corresponded the (002) crystal plane of CuO, indicating the presence of CuO in all three samples. CuO in CuO@CNT (Fig. 3g and h) was in the form of flakes, while the CuO in both CuO@HA (Fig. 3e and f) and CuO@HA@CNT (Fig. 3i and j) was in the form of a flower, which was consistent with previous SEM observations. It could be inferred that the polar groups in HA could interact with copper ions during precursor formation, thus promoting the formation of nano-flower-like CuO.34 Distinct tubular-structured CNTs could be observed in CuO@CNT and CuO@HA@CNT, which could improve cycling performance and rate capability.
Fig. 4a shows the XPS full spectra of the three composites. All three contained the elements C, O, and Cu, among which CuO@HA@CNT and CuO@HA also contained the element N, while CuO@CNT did not. It could be seen from Fig. 4b that the peaks of C 1s spectrum of CuO@HA@CNT at 284.9 eV, 286.4 eV, and 290.2 eV corresponded to sp2 C, C–N, and C![[double bond, length as m-dash]](https://www.rsc.org/images/entities/char_e001.gif) O, respectively. As indicated in Fig. 4c, in the O 1s spectrum of CuO@HA@CNT, the peak at 529.6 eV came from CuO, and the two peaks at 531.4 and 533.0 eV were possibly attributable to O2 and H2O adsorbed on the sample surface.39 The fine Cu 2P XPS spectrum of CuO@HA@CNT was given in Fig. 4d. The peaks around 933.8 eV and 953.8 eV originated from Cu 2p3/2 and Cu 2p1/2, and the two peaks around 941.6 eV and 944.0 eV corresponded to the Cu2+, which also proved the presence of CuO in CuO@HA@CNT.39,40
O, respectively. As indicated in Fig. 4c, in the O 1s spectrum of CuO@HA@CNT, the peak at 529.6 eV came from CuO, and the two peaks at 531.4 and 533.0 eV were possibly attributable to O2 and H2O adsorbed on the sample surface.39 The fine Cu 2P XPS spectrum of CuO@HA@CNT was given in Fig. 4d. The peaks around 933.8 eV and 953.8 eV originated from Cu 2p3/2 and Cu 2p1/2, and the two peaks around 941.6 eV and 944.0 eV corresponded to the Cu2+, which also proved the presence of CuO in CuO@HA@CNT.39,40
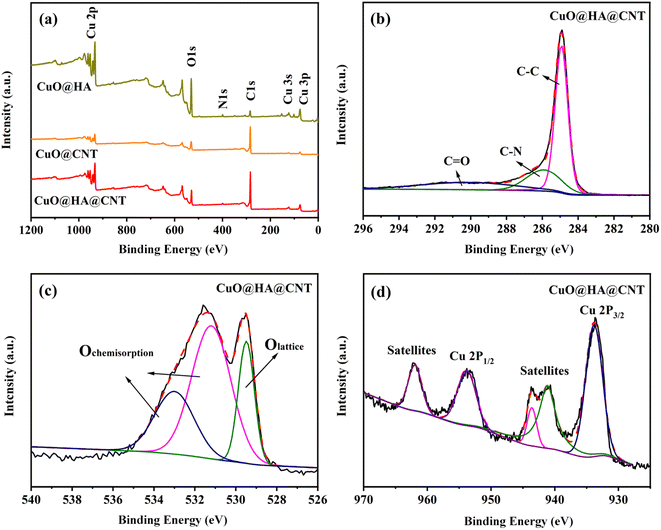 | ||
| Fig. 4 (a) XPS full spectra of CuO@HA@CNT, CuO@CNT, and CuO@HA; XPS fine spectra of CuO@HA@CNT: (b) C 1s, (c) O 1s, and (d) Cu 2p. | ||
3.3. CV and EIS test
Fig. 5a–c show the CV curves of CuO@HA@CNT, CuO@CNT, and CuO@HA, respectively. As demonstrated in Fig. 5a, the conversion of CuO to solid solution CuII1−xCuIxO1−x/2 (eqn (1))41 occurred during the first negative scan. The transition of CuII1−xCuIxO1−x/2 to Cu2O occurred at about 1.21 V (eqn. (2)). Cu2O was converted to Cu (eqn. (3)) at 0.81 and 0.66 V, and the growth of SEI layers also occurred in this region.42 In the 2nd and 3rd cycle of negative scanning, the reduction peaks of all three samples were shifted to higher voltages, which was common in most non-embedded anode materials.43–45 It could also be found from the CV curves that all three showed anodic peaks at around 2.47 V, when Cu transformed to Cu2O and CuO.| 2CuO + 2xLi+ + 2xe− → 2CuII1−xCuIxO1−x/2 + xLi2O | (1) |
| 2CuII1−xCuIxO1−x/2 + 2(1 − x)Li+ + 2(1 − x)e− → Cu2O + (1 − x)Li2O | (2) |
| Cu2O + 2Li+ + 2e− → 2Cu + Li2O | (3) |
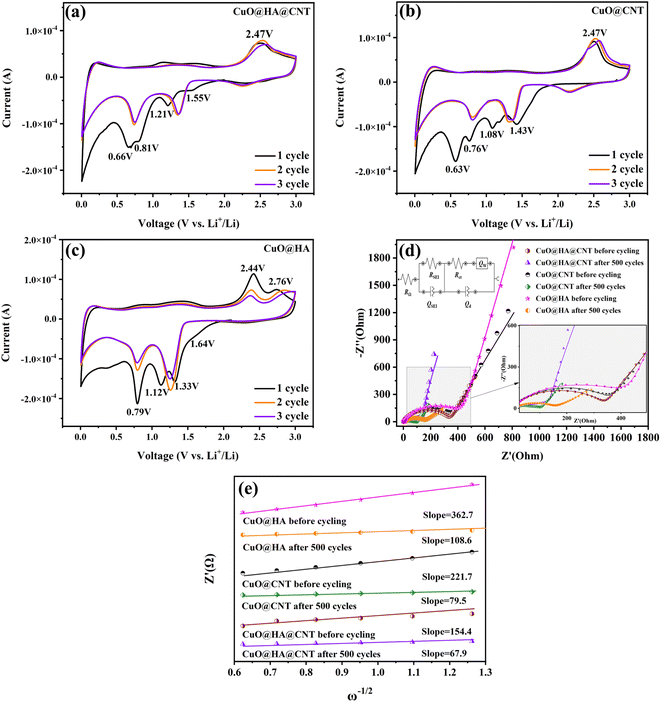 | ||
| Fig. 5 CV curves of (a) CuO@HA@CNT, (b) CuO@CNT, and (c) CuO@HA. (d) Nyquist plots of CuO@HA@CNT, CuO@CNT, and CuO@HA electrodes. (e) Linear fit curves of Z′ vs. ω−1/2. | ||
Fig. 5d shows the AC impedance curves of the three samples before and after cycling, where the addition is an equivalent circuit diagram. RΩ denotes the ohmic resistance. RSEI and QSEI represent the resistance and capacitance of the SEI film. A semi-circle diameter in the mid-frequency region represents the resistance to charge transfer (Rct), a diagonal line in the low-frequency region represents the resistance to Li+ diffusion (Qw), and Qd signifies the capacitance of the bilayer.46
The RΩ and Rct of CuO@HA@CNT, CuO@CNT, and CuO@HA were obtained by fitting the equivalent circuit diagram, as shown in Table 1. As revealed, the Rct values of the three samples after 500 cycles were significantly lower than those before cycling. This was due to the fact that during cycling, the electrode material was gradually activated and a small amount of lithium ions were irreversibly embedded, so that the conductivity of the electrode itself was increased. The Rct of CuO@HA@CNT was the smallest among the three samples, which was due to the fact that HA combined CuO and CNT to form a highly conductive and interleaved three-dimensional structure that reduced the resistance of the electrodes.
| Sample | CuO@HA@CNT | CuO@CNT | CuO@HA | |||
|---|---|---|---|---|---|---|
| Before cycling | After 500 cycles | Before cycling | After 500 cycles | Before cycling | After 500 cycles | |
| RΩ (Ω) | 1.48 | 10.4 | 2.54 | 6.3 | 1.67 | 6.4 |
| Rct (Ω) | 334 | 58 | 362 | 119 | 427 | 151 |
According to eqn (S1), a linear fitting curve of Z′ (real part of Qw impedance) versus ω−1/2 was obtained, as shown in Fig. 5e. The Li+ diffusion coefficient (DLi+) of the electrode could be obtained from eqn (2). The DLi+ values before cycling and after 500 cycles were 3.94 × 10⁻¹³ and 1.51 × 10⁻¹² cm2 s−1 for CuO@HA@CNT, 1.40 × 10⁻¹³ and 3.70 × 10⁻¹³ cm2 s−1 for CuO@CNT, and 6.36 × 10⁻¹⁴ and 1.71 × 10⁻¹³ cm2 s−1 for CuO@HA, respectively. Notably, the DLi+ values of CuO@HA@CNT were the largest both before cycling and after 500 cycles, which indicated that HA brought CuO and CNT together, not only to improve the electrical conductivity, but also to boost the diffusion of lithium ions.
3.4. Cycling stability and rate capability
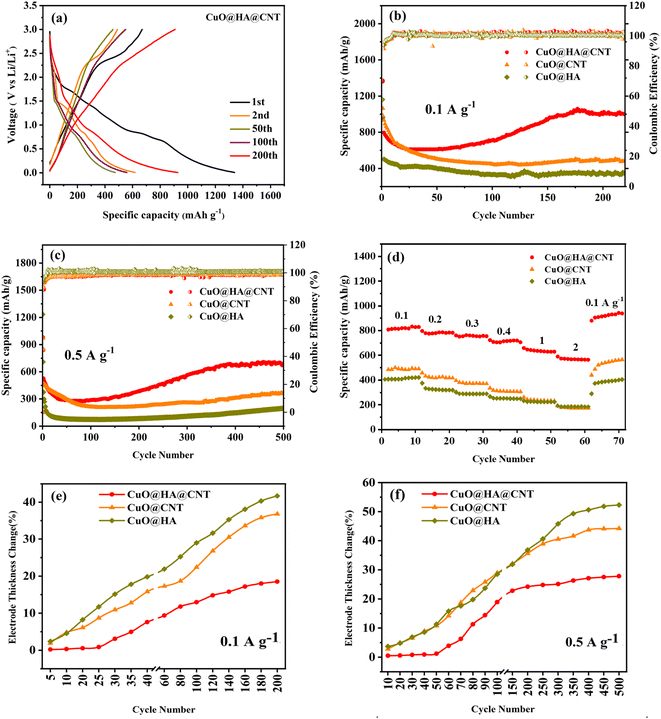
The galvanostatic charge/discharge (GCD) curves of the CuO@HA@CNT electrode are presented in Fig. 6a. At the first cycle, the large difference between the discharge capacity (1339.6 mA h g−1) and the charge capacity (833.4 mA h g−1), and the small coulombic efficiency (CE) (62.2%) were due to SEI film formation and degradation of the electrolyte, which was the case for a good number of electrode materials. There was no significant change in the shape of the curve in the following cycles, indicating that the CuO@HA@CNT electrode had good cycling stability. As demonstrated in Fig. 6b, after 200 cycles at a current density of 0.1 A g−1, the specific capacities of CuO@HA@CNT, CuO@CNT, and CuO@HA reached 1000.2, 479.6, and 344.2 mA h g−1, respectively. As indicated in Fig. 6c, after 500 cycles at 0.5 A g−1, CuO@HA@CNT electrode still had a capacity of 632 mA h g−1, which was much higher than those of the CuO@CNT and CuO@HA due to its relatively lower resistance to charge transfer and higher DLi+.The rate capability of the three samples is shown in Fig. 6d. The reversible capacity and capacity retention of CuO@HA@CNT were improved as compared to the other two samples. The reversible capacities of the CuO@HA@CNT electrode at 0.1, 0.2, 0.3, 0.5, 1, and 2 A g−1 were 814.3, 775.5, 762.9, 705.3, 639.3, and 570.9 mA h g−1, respectively. As the current density dropped rapidly from 2 to 0.1 A g−1, CuO@HA@CNT's capacity was comparable to the initial capacity, thanks to its lower electrode resistance and higher DLi+.
The degree of volume change in CuO during cycling could be characterized by the electrode thickness rate.47 The initial electrode thickness before cycling was first obtained, then the electrode thickness after cycling was tested, and then the electrode thickness rate was calculated according to the following equation.
 | (4) |
Fig. 6e and f depict the electrode thickness changes of CuO@CNT, CuO@HA, and CuO@HA@CNT at current densities of 0.1 and 0.5 A g−1, respectively. It could be seen that the electrode thickness rate of CuO@HA@CNT was the smallest, while the electrode thickness rate of CuO@HA was the largest. CuO@HA@CNT had an electrode thickness rate 0.99 times smaller than CuO@CNT (200 cycles at 0.1 A g−1) and 0.59 times smaller (500 cycles at 0.5 A g−1), indicating that the introduction of HA increased the bonding strength between CuO and CNT, reducing the volume change of CuO. Due to the much higher electrical conductivity of CNT as compared to HA, CuO@HA had lower conductivity than CuO@CNT, which resulted in the largest volume change of CuO@HA.
As demonstrated in Table 2, the specific capacity of CuO@HA@CNT electrode was significantly better than that of CuO and CNT composite electrode materials prepared by other scholars using various methods. This was because the HA coupling agent firmly fixed CuO on the CNT surface and built a solid cross-linked network, and as a result, the volume change and internal resistance were reduced, the conductivity was increased, and the electrode reaction kinetics was improved.
3.5. Lithium storage mechanism
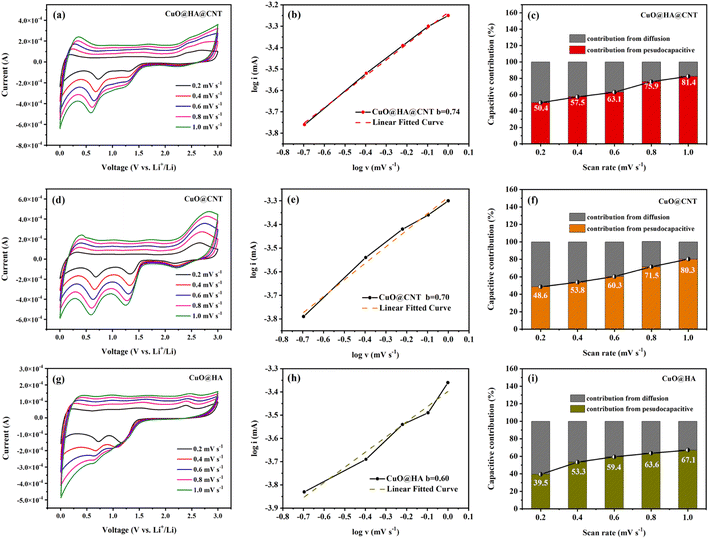
To determine the lithium storage mechanism of the three samples, the CV curves of these three samples at various scan rates were obtained, as shown in Fig. 7a, d and g. Eqn (5) shows the relation between the peak current of the CV curve (i) and scan rate (v). In the case of small scan rates, a and b can be assumed to be constants.48 Eqn (6) is the logarithm of eqn (5). b reflects the reaction kinetics of the electrode. If the b value is near 0.5, it suggests that the lithium storage process is under the control of diffusion, and if the value of b is close to 1, it indicates that the lithium storage process mostly originates from the pseudocapacitance. As displayed in Fig. 7b, e and h, fitting log![[thin space (1/6-em)]](https://www.rsc.org/images/entities/char_2009.gif) i and log
i and log![[thin space (1/6-em)]](https://www.rsc.org/images/entities/char_2009.gif) v yielded b values of 0.74, 0.70, and 0.60 for CuO@HA@CNT, CuO@CNT, and CuO@HA, respectively, indicating that the lithium storage process of the three samples should be controlled by both diffusion and pseudocapacitance.
v yielded b values of 0.74, 0.70, and 0.60 for CuO@HA@CNT, CuO@CNT, and CuO@HA, respectively, indicating that the lithium storage process of the three samples should be controlled by both diffusion and pseudocapacitance.| i = avb | (5) |
log![[thin space (1/6-em)]](https://www.rsc.org/images/entities/char_2009.gif) i = b i = b![[thin space (1/6-em)]](https://www.rsc.org/images/entities/char_2009.gif) log log![[thin space (1/6-em)]](https://www.rsc.org/images/entities/char_2009.gif) v + log v + log![[thin space (1/6-em)]](https://www.rsc.org/images/entities/char_2009.gif) a a
| (6) |
| i = k1v + k2v1/2 | (7) |
Eqn (5) could be modified to eqn (7), and the capacitive contribution for a given voltage can be obtained after data processing49 as demonstrated in Fig. 7c, f and i. It could be noticed that as the CV scan rate increased from 0.2 to 1.0 mV s−1, the capacitive contribution of CuO@HA@CNT, CuO@CNT, and CuO@HA rose from 50.4% to 81.4%, 48.6% to 80.3%, and 39.5% to 67.1%, respectively. This was caused by the acceleration of electron transport and the shortening of the ion diffusion distance with the increase of scanning speed, which ultimately led to the enhancement of the capacitive contribution of the three.50
The pseudocapacitive process, also known as the faradaic process, typically occurs on the surface of electrode materials or in their vicinity. And the pseudo-capacitance process favors the high rate of lithium-ion insertion and extraction. It could be observed in Fig. 7c, f and i that the capacitive contribution of CuO@HA@CNT was higher than that of CuO@CNT and CuO@HA at the same scan rate, which was the main reason behind the good cycling stability and rate capability of CuO@HA@CNT.51
4. Conclusion
In this paper, CuO@HA@CNT lithium battery anode material with cross-linked network structure was generated by linking CuO and CNT with HA as coupling agent. For comparison, CuO@HA or CuO@CNT were also prepared in the absence of CNT or HA, respectively. XRD and XPS analyses revealed the existence of CuO in all three electrodes. SEM and TEM demonstrated that CuO in CuO@CNT existed in the form of flakes, and CuO in both CuO@HA and CuO@HA@CNT showed flower-like shape, indicating that HA promoted nanoflower-like CuO formation. The charge transfer resistance, conductivity, lithium-ion diffusion coefficient, specific capacity, and rate capability of CuO@HA@CNT were superior to the other samples. The reversible capacities of the CuO@HA@CNT electrode at 0.1, 0.2, 0.3, 0.5, 1, and 2 A g−1 were 814.3, 775.5, 762.9, 705.3, 639.3, and 570.9 mA h g−1, respectively, which were greatly superior to the composite electrode materials of CuO and CNT prepared by scientists using various methods. This was because HA firmly anchored CuO on the CNT surface and built a solid cross-linked network, which reduced volume change and internal resistance, and improved the conductivity, lithium-ion diffusion coefficient, as well as capacitive contribution, so that the CuO@HA@CNT achieved excellent specific capacity and rate capability.Data availability
Data will be made available on request.Author contributions
Bo Liang: investigation, methodology, writing – original draft. Tingting Yang: methodology, software, writing – original draft. Huiqian Yang: investigation, formal analysis. Jinsheng Zhao: conceptualization, writing – review & editing. Yunyun Dong: project administration, supervision, resources.Conflicts of interest
There are no conflicts of interest to declare.Acknowledgements
The work received financial support from the National Natural Science Foundation of China (22172069), Heilongjiang Provincial Natural Science Foundation of China (LH2020E089), The Natural Science Foundation of the Jiangsu Higher Education Institutions of China (23KJA460004, 21KJB430010), Basic Scientific Research program of Nantong City (JC22022014, JC12022090, JC12022019), Outstanding young core teachers from “Green-Blue Project” of Colleges and Universities in Jiangsu Province, Young and Middle-aged Academic Leaders from “Green-Blue Project” of Colleges and Universities in Jiangsu Province, and Scientific Research Start-up Fund for Talent Introduction at Jiangsu College of Engineering and Technology.References
- Q. Li, H. Li, Q. Xia, Z. Hu, Y. Zhu, S. Yan, C. Ge, Q. Zhang, X. Wang, X. Shang, S. Fan, Y. Long, L. Gu, G.-X. Miao, G. Yu and J. S. Moodera, Nat. Mater., 2021, 20, 76–83 CrossRef CAS.
- B. Liang, J. Zhao and C. Ban, J. Mater. Sci.: Mater. Electron., 2023, 34, 1450 CrossRef CAS.
- Q. Lu, L. Kong, B. Liang and J. Zhao, Int. J. Electrochem. Sci., 2022, 17, 221274 CrossRef CAS.
- Z. Yang, D. Wang, F. Li, D. Liu, P. Wang, X. Li, H. Yue, S. Peng and D. He, Mater. Lett., 2013, 90, 4–7 CrossRef CAS.
- Z. Li, Y. Zhang, X. Li, F. Gu, L. Zhang, H. Liu, Q. Xia, Q. Li, W. Ye, C. Ge, H. Li, H. Hu, S. Li, Y.-Z. Long, S. Yan, G.-X. Miao and Q. Li, J. Am. Chem. Soc., 2021, 143, 12800–12808 CrossRef CAS.
- H. Li, Z. Hu, Q. Xia, H. Zhang, Z. Li, H. Wang, X. Li, F. Zuo, F. Zhang, X. Wang, W. Ye, Q. Li, Y. Long, Q. Li, S. Yan, X. Liu, X. Zhang, G. Yu and G.-X. Miao, Adv. Mater., 2021, 33, 2006629 CrossRef CAS.
- Z. Yin, W. Fan, Y. Ding, J. Li, L. Guan and Q. Zheng, ACS Sustainable Chem. Eng., 2015, 3, 507–517 CrossRef CAS.
- P. Liu, W. Lei, X. Xia and Q. Hao, ChemElectroChem, 2017, 4, 2068–2074 CrossRef CAS.
- S. Yao, Z. Shi and X. Zhang, J. Alloys Compd., 2019, 794, 333–340 CrossRef CAS.
- J. Ye, A. Baumgaertel, Y. Wang, J. Biener and M. M. Biener, ACS Nano, 2015, 9, 2194–2202 CrossRef CAS.
- S. Huang, J. Jin, Y. Cai, Y. Li, H. Tan, H. Wang, G. Van Tendeloo and B. Su, Nanoscale, 2014, 6, 6819–6827 RSC.
- Y. Li, Z. Fu and B. Su, Adv. Funct. Mater., 2012, 22, 4634–4667 CrossRef CAS.
- J. Yue, X. Gu, L. Chen, N. Wang, X. Jiang, H. Xu, J. Yang and Y. Qian, J. Mater. Chem. A, 2014, 2, 17421–17426 RSC.
- X. Xu, R. Cao, S. Jeong and J. Cho, Nano Lett., 2012, 12, 4988–4991 CrossRef CAS PubMed.
- J. Li, Z. Li, F. Ning, L. Zhou, R. Zhang, M. Shao and M. Wei, ACS Omega, 2018, 3, 1675–1683 CrossRef CAS PubMed.
- L. Tian, H. Zou, J. Fu, X. Yang, Y. Wang, H. Guo, X. Fu, C. Liang, M. Wu, P. K. Shen and Q. Gao, Adv. Funct. Mater., 2010, 20, 617–623 CrossRef CAS.
- B. Pecquenard, F. Le Cras, D. Poinot, O. Sicardy and J. Manaud, ACS Appl. Mater. Interfaces, 2014, 6, 3413–3420 CrossRef CAS.
- N. Kim, G. Lee and J. Choi, Chem.–Eur. J., 2018, 24, 19045–19052 CrossRef CAS PubMed.
- W. Li, K. Shang, Y. Liu, Y. Zhu, R. Zeng, L. Zhao, Y. Wu, L. Li, Y. Chu, J. Liang and G. Liu, Electrochim. Acta, 2015, 174, 985–991 CrossRef CAS.
- Y. Yuan, F. Chen, L. Ye, G. Cai, M. Zhu, S. Yin and S. Guo, J. Alloys Compd., 2019, 790, 814–821 CrossRef CAS.
- X. Zhang, Y. Hu, D. Zhu, A. Xie and Y. Shen, Ceram. Int., 2016, 42, 1833–1839 CrossRef CAS.
- Y. Liu, W. Wang, L. Gu, Y. Wang, Y. Ying, Y. Mao, L. Sun and X. Peng, ACS Appl. Mater. Interfaces, 2013, 5, 9850–9855 CrossRef CAS PubMed.
- C. Chen, S. Lee, M. Cho and Y. Lee, Mater. Lett., 2015, 140, 111–114 CrossRef CAS.
- R. Wang, L. Feng, Y. Zhang and W. Bai, Journal of Yunnan Minzu University, 2018, 27, 192–196 Search PubMed.
- J. Yin, J. Dong, H. Ding and F. Li, Energy Storage Science and Technology, 2021, 10, 995–1001 Search PubMed.
- W. Yuan, Z. Qiu, Y. Chen, B. Zhao, M. Liu and Y. Tang, Electrochim. Acta, 2018, 267, 150–160 CrossRef CAS.
- S. Lee, H. Song, Y. Hwang Jun, M. Kim Seung and Y. Jeong, Carbon Lett., 2018, 27, 98–107 CrossRef.
- S. M. Abbas, S. T. Hussain, S. Ali, F. Abbas, N. Ahmad, N. Ali and Y. Khan, J. Alloys Compd., 2013, 574, 221–226 CrossRef CAS.
- X. Cui, B. Song, S. Cheng, Y. Xie, Y. Shao and Y. Sun, Nanotechnology, 2017, 29, 035603 CrossRef.
- H. Huang, Q. Yu, Y. Ye, P. Wang, L. Zhang, M. Gao, X. Peng and Z. Ye, CrystEngComm, 2012, 14, 7294–7300 RSC.
- S. Yang, Y. Huang, X. Han and G. Han, Trans. Nonferrous Met. Soc. China, 2021, 31, 2062–2073 CrossRef CAS.
- E. Duraia, S. Niu, G. Beall and C. Rhodes, J. Mater. Sci.: Mater. Electron., 2018, 29, 8456–8464 CrossRef CAS.
- S. Xu, J. Zhou, J. Wang, S. Pathiranage, N. Oncel, P. Robert Ilango, X. Zhang, M. Mann and X. Hou, Adv. Funct. Mater., 2021, 31, 2101645 CrossRef CAS.
- H. Seki and A. Suzuki, J. Colloid Interface Sci., 1995, 171, 490–494 CrossRef CAS.
- S. Zheng, J. Hu, L. Zhong, W. Song, L. Wan and Y. Guo, Chem. Mater., 2008, 20, 3617–3622 CrossRef CAS.
- A. Mahajan, A. Kingon, Á. Kukovecz, Z. Konya and P. M. Vilarinho, Mater. Lett., 2013, 90, 165–168 CrossRef CAS.
- D. Bom, R. Andrews, D. Jacques, J. Anthony, B. Chen, M. S. Meier and J. P. Selegue, Nano Lett., 2002, 2, 615–619 CrossRef CAS.
- J. H. Lehman, M. Terrones, E. Mansfield, K. E. Hurst and V. Meunier, Carbon, 2011, 49, 2581–2602 CrossRef CAS.
- M. Devaraj, R. Deivasigamani and S. Jeyadevan, Colloids Surf., B, 2013, 102, 554–561 CrossRef CAS PubMed.
- H. Xie, X. Liu, R. Wu, J. Liu, J. Wu and L. Li, ACS Appl. Energy Mater., 2020, 3, 7325–7334 CrossRef CAS.
- S. Wang, J. Zhang and C. Chen, Scr. Mater., 2007, 57, 337–340 CrossRef CAS.
- X. Chen, N. Zhang and K. Sun, J. Mater. Chem., 2012, 22, 13637–13642 RSC.
- P. Poizot, S. Laruelle, S. Grugeon, L. Dupont and J. Tarascon, Nature, 2000, 407, 496–499 CrossRef CAS PubMed.
- C. Li, L. Kong, J. Zhao and B. Liang, Colloids Surf., A, 2022, 651, 129707 CrossRef CAS.
- B. Liang, X. Liu, X. Guo and J. Zhao, Synth. Met., 2022, 289, 117112 CrossRef CAS.
- Y. Fang, Y. Chen, L. Zeng, T. Yang, Q. Xu, Y. Wang, S. Zeng, Q. Qian, M. Wei and Q. Chen, J. Colloid Interface Sci., 2021, 593, 251–265 CrossRef CAS PubMed.
- Y. H. Kwon, K. Minnici, J. J. Park, S. R. Lee, G. Zhang, E. S. Takeuchi, K. J. Takeuchi, A. C. Marschilok and E. Reichmanis, J. Am. Chem. Soc., 2018, 140, 5666–5669 CrossRef CAS PubMed.
- X. Yang and A. L. Rogach, Adv. Energy Mater., 2019, 9, 1900747 CrossRef.
- L. Liang, X. Li, F. Zhao, J. Zhang, Y. Liu, L. Hou and C. Yuan, Adv. Energy Mater., 2021, 11, 2100287 CrossRef CAS.
- M. Wang, C. Li, J. Zhao, A. Li and B. Liang, Coatings, 2022, 12, 1912 CrossRef CAS.
- X. Chen, L. Lv, W. Sun, Y. Hu, X. Tao and Y. Wang, J. Mater. Chem. A, 2018, 6, 13705–13716 RSC.
Footnotes |
| † Electronic supplementary information (ESI) available. See DOI: https://doi.org/10.1039/d3ra01926h |
| ‡ The authors contribute equally to the present work. |
| This journal is © The Royal Society of Chemistry 2023 |

