 Open Access Article
Investigation of the structure, phase transitions, molecular dynamics, and ferroelasticity of organic–inorganic hybrid NH(CH3)3CdCl3 crystals
Ae Ran Lim *ab
*ab
aGraduate School of Carbon Convergence Engineering, Jeonju University, Jeonju 55069, Korea
bDepartment of Science Education, Jeonju University, Jeonju 55069, Korea. E-mail: aeranlim@hanmail.net; arlim@jj.ac.kr
First published on 20th June 2023
Abstract
Understanding the physical and chemical properties of the organic–inorganic hybrid NH(CH3)3CdCl3 is essential for its application. Considering its importance, a single crystal of NH(CH3)3CdCl3 was grown with an orthorhombic structure at 300 K. The phase transition temperatures were determined to be 345 (TC3), 376 (TC2), and 452 K (TC1) (phases IV, III, II, and I, respectively, starting from a low temperature). The partial decomposition temperature was 522 K (Td). Furthermore, the NMR chemical shifts of the 1H, 13C, and 113Cd atoms of the cation and anion varied with increasing temperature. Consequently, a significant change in the coordination geometry of Cl around Cd in CdCl6 and a change in the coordination geometry of H in NH was associated with changes in the N–H⋯Cl hydrogen bond near the phase transition temperature. The 13C activation energy Ea obtained from the spin-lattice relaxation time was smaller than that of 1H Ea, suggesting that energy transfer around 13C is easier. Additionally, a comparison of the twin domain walls measured via optical polarizing microscopy and Sapriel's theory indicated that the crystal structure in phase III was more likely to be orthorhombic than hexagonal.
1. Introduction
Until now, solar cells based on organic–inorganic hybrid materials have been extensively studied.1–8 Typically, CH3NH3PbX3 (X = Cl, Br, and I) materials are attracting attention as photovoltaic materials,9–13 but these materials are easily degraded in a humid environment and are toxic due to the presence of Pb. Therefore, interest and research on eco-friendly organic–inorganic hybrid perovskite type materials have recently increased.14–24 The development of solid-state physics has enabled the research on new materials with reduced- and low-dimensional properties. Alkylammonium groups can bond to inorganic groups via hydrogen bonding in various ways. Alkylammonium metal trihalogens, NH(CH3)3MX3 (M = Cu, Co, Mn, Zn, or Cd; X = Cl or Br), have attracted considerable attention because of their low-order magnetic properties. These compounds exhibit structural phase transitions, which are considered to be due to the ordered–disorder-type orientation of the alkylammonium ions. Moreover, they exhibit interesting properties such as ferroelectricity, ferroelasticity, and low-dimensional magnetism.25–28 These properties are related to the structural phase transitions that characterize these materials, including their potential applications in temperature and humidity sensors.29,30NH(CH3)3CdCl3 undergoes three phase transitions at 342, 374, and 415 K.31 The four phases, ordered from low to high temperature, are referred to as phases IV, III, II, and I. According to previous reports by Chapuis et al.,31–33 the low temperature phase IV (295 K) has an orthorhombic space group Pbnm structure, with lattice constants of a = 8.986 Å, b = 14.502 Å, c = 6.710 Å, and Z = 4. Additionally, the structure of phase III above 342 K is hexagonal, space group P63/m, with a = 26.080 Å, c = 6.756 Å, and Z = 18. Another hexagonal phase II between 374 K and 415 K, belongs to space group P63/m with a = 15.105 Å, c = 6.763 Å, and Z = 6. Meanwhile, according to reports by Kashida et al.,34–39 phase III belongs to the orthorhombic space group Pbnm, and has lattice parameters of a = 17.123 Å, b = 15.256 Å, c = 6.731 Å, and Z = 8, in contrast to the hexagonal structure reported by Chapuis et al.31–33 The single-crystal structures in phase III reported by Chapuis et al.31–33 and Kashida et al.34–39 were orthorhombic and hexagonal, respectively. NH(CH3)3CdCl3 comprises [NH(CH3)3]+ and [CdCl6]− octahedra. The atomic arrangement is connected by the alteration of organic cations and inorganic anions. Until now, relatively little attention has been paid to structural phase transitions.
In addition to the research on crystal structure described above, other studies on NH(CH3)3CdCl3 have been conducted, including that of Sano and Kashida,40 who investigated molecular reorientation using dielectric properties. Subsequently, Kchaou et al.41–43 reported optical, electrical properties, IR, and Raman spectroscopy results.
The spin-lattice relaxation time (T1ρ) in a rotating frame is generally mentioned as relaxation in the radio frequency field, and is useful because it can provide information for slow motions of nuclei.44,45 Ferroelasticity describes a phenomenon in which materials under external stress exhibit spontaneous strain induced by a phase transition between two equally stable phases, described mainly by lattice orientations. Consequently, ferroelastic materials respond to mechanical deformation by switching their phases with an accompanying lattice reorientation. Ferroelastic materials exhibit phase transitions between ferroelastic and paraelastic phases.46
Although the structures in phases IV, III, and II were reported, the crystal structure in phase III was not correct. And, the molecular dynamics studies have not been conducted for this material.
In this study, single crystals of NH(CH3)3CdCl3 were grown using an aqueous solution method, and their structures were analyzed via single-crystal X-ray diffraction (XRD). Phase transition temperatures (TC) were measured using differential scanning calorimetry (DSC) and powder XRD. In addition, the thermal stability that is not easily decomposed in a humid environment was discussed. To understand the role of the NH(CH3)3 cation and CdCl3 anion in this crystal, the magic-angle spinning (MAS) nuclear magnetic resonance (NMR) chemical shifts for 1H and 13C, and static NMR chemical shifts for 113Cd were obtained near the phase transition temperatures. Using this result, the role of the N–H⋯Cl hydrogen bond between the cation and anion was discussed. Furthermore, the spin-lattice relaxation time T1ρ, which represents the energy transfer around the 1H and 13C atoms of the cation, was discussed, and their activation energies Ea were determined. To determine the exact structure in phase III, the existence of twin domains was suggested using polarizing microscopy and Sapriel's theory. The resulting crystal structure and physicochemical properties provide important information on the environment-friendly organic–inorganic hybrid for potential applications.
2. Experimental
2.1. Crystal growth
Single crystals of NH(CH3)3CdCl3 were prepared from NH(CH3)3Cl (Aldrich, 98%) and CdCl2 (Aldrich, 98%) in a ratio of 1![[thin space (1/6-em)]](https://www.rsc.org/images/entities/char_2009.gif) :
:![[thin space (1/6-em)]](https://www.rsc.org/images/entities/char_2009.gif) 1. The mixture was heated and stirred to obtain a homogeneous solution. The resulting solution was filtered, and transparent colorless single crystals with prismatic shapes elongated along the crystallographic c-axis were subsequently grown via slow evaporation after a few days at 300 K.
1. The mixture was heated and stirred to obtain a homogeneous solution. The resulting solution was filtered, and transparent colorless single crystals with prismatic shapes elongated along the crystallographic c-axis were subsequently grown via slow evaporation after a few days at 300 K.
2.2. Characterization
The lattice parameters at 300 K were determined using single-crystal XRD at the Korea Basic Science Institute (KBSI) Western Seoul Center. Powder XRD patterns were measured at various temperatures in the same facility. The experimental conditions were similar to those reported previously.47DSC measurements were performed using a DSC instrument (TA Instruments, DSC 25) in the temperature range of 200–573 K at heating and cooling rates of 10 °C min−1 under a flow of dry nitrogen gas. The amount of the sample used in the DSC experiment was 4.8 mg.
The ferroelastic twin domain wall observations were performed within a temperature range of 300–573 K using an optical polarizing microscope with a heating stage (Linkam THM-600).
Thermal gravimetric analysis (TGA) was also performed in the temperature range of 300–873 K with a heating rate of 10 °C min−1 under nitrogen gas.
The MAS NMR spectra for 1H and 13C in the NH(CH3)3CdCl3 crystals were measured using a solid-state 400 MHz NMR spectrometer (AVANCE III+, Bruker) at the KBSI Western Seoul Center. The 1H NMR spectra were recorded at Larmor frequency of 400.13 MHz and 13C NMR spectra were recorded at Larmor frequency of 100.61 MHz. The samples in the cylindrical zirconia rotors were spun at a rate of 10 kHz for the MAS NMR measurements to minimize the spinning sideband. The chemical shifts were referenced to adamantane and tetramethylsilane (TMS) for 1H and 13C, respectively, as standards for accurate chemical shift measurements. Spin-lattice relaxation time T1ρ values were obtained using a π/2 − τ pulse by a spin-lock pulse of duration τ for 1H and 13C, and were measured using a previously reported method.48 Further, the 113Cd static NMR spectra of the NH(CH3)3CdCl3 crystals were measured at a Larmor frequency of 88.75 MHz, and the chemical shifts used CdCl2O8·6H2O as standard samples. The chemical shifts and T1ρ could not be measured above 420 K because the NMR spectroscopy did not have adequate temperature control at high temperature. An almost constant temperature within the error range of ±0.5 K was maintained, even when the rate of flow of nitrogen gas and heater current were adjusted.
3. Results and discussion
3.1. Single-crystal XRD
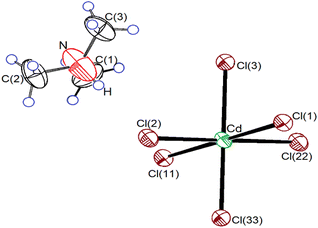
Single-crystal XRD results for the NH(CH3)3CdCl3 crystals were obtained at 300 K. The crystal grew an orthorhombic system with a Pnma space group and lattice constants of a = 14.5088 (8) Å, b = 6.7108 (3) Å, c = 8.9901 (4) Å, and Z = 4. These results at 300 K are consistent with those reported by Chapuis et al.31–33 and Kashida et al.34–39 Fig. 1 shows the thermal ellipsoids and atomic numbering of the NH(CH3)3CdCl3 crystals. The XRD data are presented in Table 1, and the bond lengths and angles are presented in Table 2. The structure consisted of infinite chains of face-sharing CdCl6 octahedra, and the [NH(CH3)3]+ ion was located in the space between the chains. This compound is characterized by the hydrogen bonds N–H⋯Cl connecting the organic [NH(CH3)3]+ cation to the inorganic [CdCl6]− anion. Owing to the relatively strong bonds, the CdCl6 octahedra were slightly elongated in the direction of the bonded Cl atom.| Chemical formula | C3H10NCdCl3 |
| Weight | 278.87 |
| Crystal system | Orthorhombic |
| Space group | Pnma |
| T (K) | 300 |
| a (Å) | 14.5088 (8) |
| b (Å) | 6.7108 (3) |
| c (Å) | 8.9901 (4) |
| Z | 4 |
| V (Å3) | 875.33 |
| Radiation type | Mo-Kα |
| Wavelength (Å) | 0.71073 |
| Reflections collected | 8940 |
| Independent reflections | 1173 (Rint = 0.0441) |
| Goodness-of-fit on F2 | 1.073 |
| Final R indices [I > 2 sigma(I)] | R1 = 0.0357, wR2 = 0.1028 |
| R Indices (all data) | R1 = 0.0412, wR2 = 0.1220 |
| Cd–Cl(1) | 2.6307 (11) |
| Cd–Cl(2) | 2.6707 (12) |
| Cd–Cl(3) | 2.6394 (12) |
| Cd–Cl(11) | 2.6307 (11) |
| Cd–Cl(22) | 2.6707 (12) |
| Cd–Cl(33) | 2.6394 (12) |
| N–C(1) | 1.408 (12) |
| N–C(2) | 1.433 (9) |
| N–C(3) | 1.433 (9) |
| Cl(1)–Cd–Cl(3) | 84.06 (4) |
| Cl(1)–Cd–Cl(2) | 95.89 (4) |
| Cl(3)–Cd–Cl(2) | 95.85 (4) |
| Cl(1)–Cd–Cl(11) | 180.00 |
| Cl(2)–Cd–Cl(22) | 180.00 |
| Cl(3)–Cd–Cl(33) | 180.00 |
| C(1)–N–C(3) | 116.7 (6) |
| C(1)–N–C(2) | 116.7 (6) |
| C(3)–N–C(2) | 115.2 (10) |
3.2. Phase transition and powder XRD
The DSC result was obtained at a temperature range of 200–573 K, with heating and cooling speed of 10 °C min−1 and a powder sample of 4.8 mg within the capsule. Fig. 2 shows two strong endothermic peaks (376 and 452 K) and three weak endothermic peaks (345, 416, and 522 K) as a result of heating. Endothermic peaks reported by other groups were observed at 342, 374, and 415 K, whereas our results were observed at 345, 376, 416, 452, and 522 K. The enthalpies of the five peaks were 99, 377, 47, 717, and 370 J mol−1, respectively. Furthermore, the exothermic peaks attributed to cooling were observed at 302, 409, and 462 K. The phase transition temperatures during heating and cooling were irreversible. From the DSC and the powder XRD results mentioned below, it was referred to as phase IV below 345 K, phase III between 345 and 376 K, phase II between 376 and 452 K, and finally phase I above 452 K.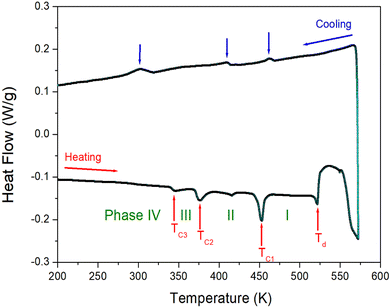 | ||
| Fig. 2 Differential scanning calorimetry curve of NH(CH3)3CdCl3 measured with the heating and cooling rates of 10 °C min−1. | ||
The appearance of a single crystal according to the temperature change was observed using an optical polarizing microscope to confirm whether the five peaks shown in the DSC results in Fig. 2 are the phase transition temperatures or melting points. The crystals showed no significant changes until the temperature increased from 300 to 550 K. The surface of the single crystals began to melt at approximately 570 K.
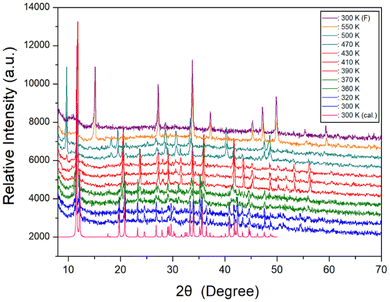
Furthermore, a powder XRD experiment was performed using temperature change, and these results in the range of 8–70° (2θ) are shown in Fig. 3. As a comparison of experimental and theoretical simulation has been reported in many materials,49–52 the theoretical XRD pattern at 300 K for NH(CH3)3CdCl3 is shown in Fig. 3, which agrees well with the experimental pattern. The XRD patterns represented in blue (below 345 K) differ slightly from those recorded in olive (above 345 K); this difference is associated with TC3 (345 K). The XRD pattern recorded at 370 K differs from those obtained above 390 K (red), indicating a clear structural change (=TC2). Furthermore, the XRD patterns below 452 K (red) differ from those recorded above 452 K (dark cyan), which is related to the TC1. The change of the powder XRD peaks above 470 K is the result of the structural change by the phase transition temperature TC1. The XRD patterns (dark cyan) below 522 K are different from those above 522 K (orange), which confirms that 522 K has a partial decomposition temperature Td from the TGA experiment mentioned below. And, after observing the XRD patterns while heating up to 550 K, the XRD pattern (purple) did not return to its original state after lowering the temperature. This was also confirmed by the XRD experiment that heating and cooling were irreversible in the DSC experiment. However, the XRD pattern for the small endothermic peak at 416 K shown in DSC experiment did not show any significant change. From the DSC, XRD, and polarizing microscopy experiments, the phase transition temperatures and the decomposition temperature were determined to be TC3 = 345 K, TC2 = 376 K, TC1 = 452 K, and Td = 522 K, respectively.
3.3. Thermal property
TGA and differential thermal analysis (DTA) measurements were performed at the same 10 °C min−1 rate as in the DSC experiment, and the results are shown in Fig. 4. A colorless, transparent single crystal is shown in the inset of Fig. 4. The TGA results reveal that the crystal was thermally stable up to 530 K. The initial weight loss of NH(CH3)3CdCl3 began at 530 K, representing the partial decomposetion temperature Td with a weight loss of 2%. The Td (=530 K) shown in the TGA result agrees well with the peak at 522 K shown in the DSC result. Therefore, it was confirmed that the endothermic peak at 522 K was Td. The weight loss of approximately 34% at 640 K, which is at the largest inflection point in the TGA curve, was the result of the decomposition of NH(CH3)3Cl, an initial reagent in crystal growth. Around 870 K, the 55% weight loss is due to the decomposition of NH(CH3)3Cl2, leaving almost only CdCl. The weight loss observed in the TGA experiment appears to agree well with the weight loss calculated from the chemical reaction. Near 973 K, NH(CH3)3CdCl3 was completely decomposed. On the other hand, to confirm the phase transition temperatures, the DTA curve is shown in detail inside Fig. 7. TC1 and TC2 matched well with the peaks shown in DSC, and TC3 could be identified by the slope of the DTA curves indicated by the red line.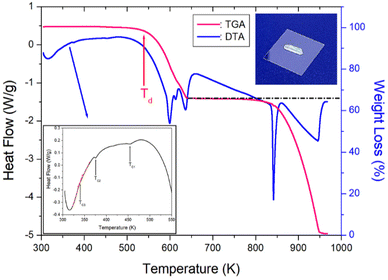 | ||
| Fig. 4 Thermogravimetry and differential thermal analysis curves of NH(CH3)3CdCl3 (inset: crystal shape of NH(CH3)3CdCl3). | ||
3.4. NMR chemical shifts and spin-lattice relaxation times for 1H and 13C
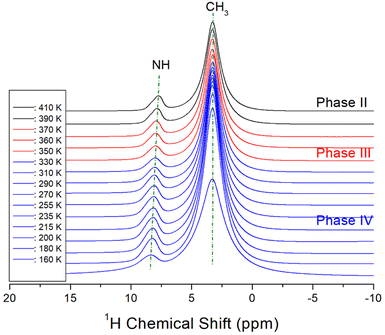
The NMR chemical shifts of 1H in the NH(CH3)3CdCl3 crystal were obtained in phases IV, III, and II, as shown in Fig. 5. The intensities of 1H signals appeared to be small and large, respectively, in proportion to the number of H atoms in NH and CH3. The 1H chemical shifts for NH and CH3 were 8.22 and 3.27 ppm, respectively, at 160 K and 7.72 and 3.24 ppm, respectively, at 410 K. As the temperature increased, the 1H chemical shifts of CH3 hardly changed, however, the 1H chemical shifts of NH showed a large change compared to those of CH3. This result indicates that the structural geometry around H, which is directly bound to N, changes significantly with temperature, although there is no rapid change near the phase-transition temperatures. The linewidths of 1H in NH and CH3 narrowed as the temperature increased, and those at 300 K were almost the same at 1.59 ppm.The 13C MAS NMR chemical shifts in NH(CH3)3CdCl3 were also measured for phases IV, III, and II with increasing temperature, as shown in Fig. 6. Only one signal of 13C for the three CH3 ions shown in the crystal structure of Fig. 1 was recorded, thus, the structural environments of 13C for the three CH3 groups were all identical. At 300 K, a 13C NMR chemical shift was observed at 46.74 ppm, and the line width was small at 0.68 ppm compared to the 1H line width. As the temperature increased, the chemical shifts moved without any anomalous change, that is, the structural geometry of 13C changed continuously with temperature. The 13C NMR linewidths were narrower than the 1H NMR linewidths for NH and CH3, indicating that the molecular motion of 13C located at the end of the [NH(CH3)3] cation was significantly free.
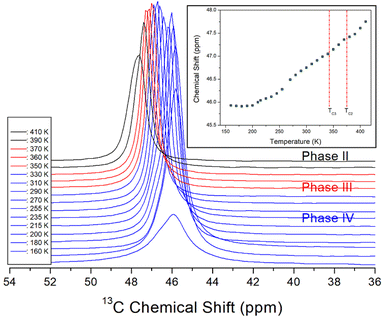 | ||
| Fig. 6 In situ 13C MAS NMR chemical shifts for NH(CH3)3CdCl3 at phases IV, III, and II (inset: 13C MAS NMR chemical shifts for NH(CH3)3CdCl3 as a function of temperature). | ||
The method to obtain T1ρ for 1H and 13C was to collect an FID following the spin-lock pulse. The intensity of the measured magnetization is given by:44,45
| S(t)/S(0) = exp(−TSL/T1ρ), | (1) |
| (1/T1ρ) = R[4J1(ω1) + J2(ωC − ωH) + 3J3(ωC) + 6J4(ωC + ωH) + 6J5(ωH)], J1 = τC/[1 + ω12τC2], J2 = τC/[1 + (ωC − ωH)2τC2], J3 = τC/[1 + ωC2τC2], J4 = τC/[1 + (ωC + ωH)2τC2], J5 = τC/[1 + ωH2τC2] | (2) |
| τC = τC (0)exp(−Ea/kBT) | (3) |
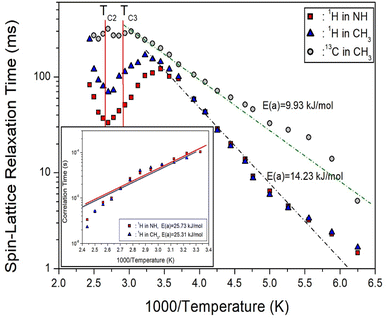
In the case of 13C shown in Fig. 7, the T1ρ values increased rapidly as the temperature increased, and no significant change was seen at the phase transition temperatures. The behavior of the 13C T1ρ for Arrhenius-type molecular motions that undergo fast motion can be represented as ω1τC « 1, T1ρ−1 ∼ exp(Ea/kBT), which is similar to the trend of 1H T1ρ at low temperatures. The logarithmic scale of T1ρ vs. inverse temperature is represented by the dotted line in Fig. 7, where the activation energy for 13C is Ea = 9.93 ± 2.58 kJ mol−1. The smaller Ea of 13C compared to 1H means that energy transfer around 13C is less impeded.
3.5. Static NMR chemical shifts for 113Cd
Because information can be obtained from the 113Cd NMR chemical shifts, we attempted to consider changes in the structural environment around Cd in CdCl3. The spin number of 113Cd is I = 1/2, and only one resonance signal is expected.55 In situ static 113Cd NMR experiments as a function of temperature were employed to examine the structural environment of the CdCl6 anions in NH(CH3)3CdCl3, as shown in Fig. 8. The NMR chemical shifts were recorded using CdCl2O8·6H2O as the standard. The chemical shift of 113Cd at 300 K was 240.36 ppm, and the linewidth was significantly broad at approximately 30 ppm. Unlike the 1H and 13C chemical shifts, the chemical shifts of 113Cd changed between phases IV and III and phases III and II. This result indicates that the environment of the Cd atom surrounded by Cl atoms changed more in TC3 than in TC2, unlike for 1H and 13C.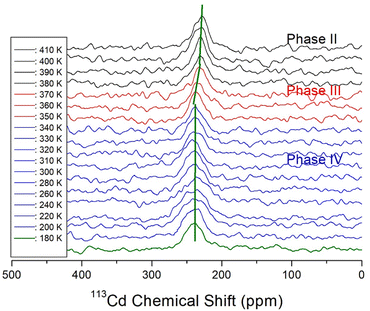 | ||
| Fig. 8 In situ static 113Cd NMR chemical shifts of NH(CH3)3CdCl3 single crystal at phases IV, III, and II. | ||
3.6. Ferroelastic property
The NH(CH3)3CdCl3 crystal exists in four phases, and the crystal structure has been reported as follows: orthorhombic (mmm) in phase IV below 342 K, orthorhombic (mmm) or hexagonal (6/mmm) in phase III between 342 and 374 K, and hexagonal (6/mmm) in phase II above 374 K. If the structure is orthorhombic in phase III, ferroelastic twin domain walls should exist in phase III as 6/mmmFmmm, which is denoted by Sapriel's theory.56 If the structure is hexagonal in phase III, twin domain walls should not exist in phase III, but domain walls should exist in phase IV. In other words, if phase III has an orthorhombic structure, twin domain walls in phase III should appear, as in the polarizing microscopy results. From the optical polarizing microscopy results, several parallel lines representing ferroelastic twin domain walls are present in phase III (Fig. 9(b)), and the domain pattern was not observed in phases IV and II (Fig. 9(a) and (c)). In phase IV, the domain walls did not appear, but in phase III, new domain walls began to appear from top to bottom. However, in Phase II, the domain walls disappeared and were not visible. The small lines seen in all the phases are not domain walls, as they appeared during the sample preparation for polarizing microscopy. For the transition from the mmm of the orthorhombic phase III to the 6/mmm of the hexagonal phase II, the equations on domain wall orientations were expressed as x = 0, y = 0, and x = ±√3, y = ±√3. According to Sapriel, the equations of the twin domain walls represent by the ferroelasticity of 6/mmmFmmm. Therefore, by comparing optical polarizing microscopy results and Sapriel's theory,56 the crystal structures in phases IV, III, and II are more likely to be orthorhombic, orthorhombic, and hexagonal, respectively.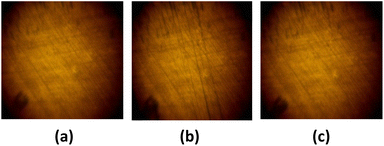 | ||
| Fig. 9 The ferroelastic twin domain patterns at (a) phase IV, (b) phase III, and (c) phase II of NH(CH3)3CdCl3 single crystal. | ||
4. Conclusions
We analyzed the crystal structures, phase transition temperatures, thermal behavior, and structural dynamics of organic–inorganic hybrid NH(CH3)3CdCl3 crystals to investigate their physicochemical properties. First, the orthorhombic structure of this crystal was confirmed using single-crystal XRD at 300 K, and the TC values at 345, 376, and 452 K were determined using DSC and powder XRD. In addition, it was confirmed that the endothermic peak at 522 K was Td. In the DSC results, the small peak at 415 K was observed in both the other groups31–39 and our group, but it is thought to be due to impurities generated during crystal growth, not the phase transition temperature due to structural change. And, the crystal structure in phase III was more likely to be orthorhombic than hexagonal. Second, the chemical shifts were caused by the local field around the resonating nucleus. The 1H, 13C, and 113Cd NMR chemical shifts of the [NH(CH3)3] cation and [CdCl6] anion varied with increasing temperature, suggesting that the surrounding environment changes with temperature. Changes in the 113Cd NMR chemical shifts in CdCl6 and 1H NMR chemical shifts in NH were larger than those in the 1H NMR chemical shifts in CH3 and 13C NMR chemical shifts in CH3; 1H and 13C chemical shifts change continuously without rapid change according to temperature change, but 113Cd chemical shifts in CdCl6 show discontinuous changes near the phase transition temperatures. From this result, it was found that the surrounding environments of 113Cd change more than those of 1H and 13C at the phase transition temperature. Also, the discontinuous change of Cd near the phase transition temperature is thought to induce the change of hydrogen bond N–H⋯Cl by the orientation of Cl around Cd. From these experimental results, it was found that the hydrogen bond N–H⋯Cl plays a significant role near the phase transition temperature. Additionally, T1ρ, which represents the energy transfer around the 1H and 13C atoms of the cation, varied significantly with temperature. The smaller value of Ea for 13C compared to 1H suggests that energy transfer around 13C is easier. Meanwhile, by comparing the twin domain walls using optical polarizing microscopy and Sapriel's theory, the crystal structure in phases IV, III, and II were found to likely be orthorhombic, orthorhombic, and hexagonal, respectively. The structural geometry revealed critical information regarding their basic mechanisms. Overall, this study elucidates these fundamental properties to broaden the applications of organic–inorganic hybrid compounds.Conflicts of interest
There are no conflicts to declare.Acknowledgements
This work was supported by the National Research Foundation of Korea (NRF) grant funded by the Korea government (MSIT) (2023R1A2C2006333). This research was also supported by the Basic Science Research Program through the National Research Foundation of Korea (NRF), funded by the Ministry of Education, Science, and Technology (2016R1A6A1A03012069).References
- S. K. Abdel, A. S. Abdel-Rahman, W. M. Gamal, M. AbdelKader, H. S. Ayoub, A. F. El-Sherif, M. F. Kandeel, S. Bozhko, E. E. Yakimov and E. B. Yakimov, Acta Crystallogr., Sect. B: Struct. Sci., Cryst. Eng. Mater., 2019, 75, 880 CrossRef PubMed.
- Y.-F. Gao, T. Zhang, W.-Y. Zhang, Q. Ye and F. J. Da-Wei, J. Mater. Chem. C, 2019, 7, 9840 RSC.
- N. Mahfoudh, K. Karoui, F. Jomni and A. B. Rhaiem, Appl. Organomet. Chem., 2020, 34, e5656 CAS.
- Y. Xie, Y. Ai, Y.-L. Zeng, W.-H. He, X.-Q. Huang, D.-W. Fu, J.-X. Gao, X.-G. Chen and Y.-Y. Tang, J. Am. Chem. Soc., 2020, 142, 12486 CrossRef CAS PubMed.
- D. -W. Fu, J.-X. Gao, W.-H. He, X.-Q. Huang, Y.-H. Liu and Y. Al, Angew. Chem., Int. Ed., 2020, 59, 17477 CrossRef CAS PubMed.
- C. Su, M. Lun, Y. Chen, Y. Zhou, Z. Zhang, M. Chen, P. Huang, D. Fu and Y. Zhang, CCS Chem., 2021, 4, 2009 CrossRef.
- S. K. Abdel-Aal, M. F. Kandeel, A. F. El-Sherif and A. S. Abdel-Rahman, Phys. Status Solidi A, 2021, 218, 2100036 CrossRef CAS.
- S. K. Abdel-Aal and A. Ouasri, J. Mol. Struct., 2022, 1251, 131997 CrossRef CAS.
- Q. Chen, N. D. Marco, Y. Yang, T.-B. Song, C.-C. Chen, H. Zhao, Z. Hong, H. Zhou and Y. Yang, Nano Today, 2015, 10, 355 CrossRef CAS.
- I. M. Hermes, S. A. Bretschneider, V. W. Bergmann, D. Klasen, J. Mars, W. Tremel, F. Laquai, H.-J. Butt, M. Mezger, R. Berger, B. J. Rodriguez and S. A. L. Weber, J. Phys. Chem., 2016, 120, 5724 CrossRef CAS PubMed.
- E. Strelcov, Q. Dong, T. Li, J. Chae, Y. Shao, Y. Deng, A. Gruverman, J. Huang and A. Centrone, Sci. Adv., 2017, 3, e1602165 CrossRef PubMed.
- S. K. Abdel-Aal, A. S. Abdel-Rahman, G. G. KocherOberlehner, A. Ionov and R. Mozhchil, Acta Crystallogr., Sect. A: Found. Adv., 2017, 70, C1116 Search PubMed.
- Y. Liu, L. Collins, R. Proksch, S. Kim, B. R. Watson, B. Doughty, T. R. Calhoun, M. Ahmadi, A. V. Ievlev, S. Jesse, S. T. Retterer, A. Belianinov, K. Xiao, J. Huang, B. G. Sumpter, S. V. Kalinin, B. Hu and O. S. Ovchinnikova, Nat. Mater., 2018, 17, 1013 CrossRef CAS PubMed.
- A. H. Mahmoudkhani and V. Langer, Acta Crystallogr., Sect. B: Struct. Sci., 2002, E58, m592 Search PubMed.
- Z. Cheng and J. Lin, CrystEngComm, 2010, 12, 2646 RSC.
- M. F. Mostafa and S. S. El-khiyami, J. Solid State Chem., 2014, 209, 82 CrossRef CAS.
- S. Gonzalez-Carrero, R. E. Galian and J. Perez-Prieto, Part. Part. Syst. Charact., 2015, 32, 709 CrossRef CAS.
- S. K. Abdel-Adal, G. Kocher-Oberlehner, A. Ionov and R. N. Mozhchil, Appl. Phys. A, 2017, 123, 531 CrossRef.
- K. Pradeesh, G. S. Yadav, M. Singh and G. Vijaya Prakash, Mater. Chem. Phys., 2010, 124, 44 CrossRef CAS.
- S. Saikumar, J. J. Ahmad, G. Baumberg and G. Vijaya Prakash, Scr. Mater., 2012, 67, 834 CrossRef.
- B. Staskiewicz, O. Czupinski and Z. Czapla, J. Mol. Struct., 2014, 1074, 723 CrossRef CAS.
- S. Ahmad, C. Hanmandlu, P. K. Kanaujia and G. Vijaya Prakash, Opt. Mater. Express, 2014, 4, 1313 CrossRef CAS.
- Z. Czapla, J. Przeslawski, M. Crofton, J. Janczak, O. Czupinski, A. Ingram and M. Kostrzewa, Phase Transitions, 2017, 90, 637 CrossRef CAS.
- H.-Y. Zhang, Z. Wei, P.-F. Li, Y.-Y. Tang, W.-Q. Liao, H.-Y. Ye, H. Cai and R.-G. Xiong, Angew. Chem., Int. Ed., 2018, 57, 526 CrossRef CAS PubMed.
- D. Visser, G. J. Mcintyre, W. G. Haje and W. J. A. Maaskant, Phys. B, 1989, 156–157, 254 CrossRef CAS.
- J.-T. Yu, K.-T. Liu and Y.-H. Jeng, Solid State Commun., 1994, 89, 543 CrossRef.
- A. Ben Rhaiem, N. Zouari, K. Guidara and A. Daoud, J. Alloys Compd., 2005, 387, 1 CrossRef CAS.
- Y. Zhang, H.-Y. Ye, W. Zhang and R.-G. Xiong, Inorg. Chem. Front., 2014, 1, 118 RSC.
- H. Reshak, H. Kamarudir, I. V. Kityk and S. Auluck, J. Mater. Sci., 2013, 48, 5157 CrossRef.
- K. Karoui, A. Ben Rhaiem, F. Jomni, J. L. Moneger, A. Bulou and K. Guidara, J. Mol. Struct., 2013, 1048, 287 CrossRef CAS.
- U. Walther, D. Brinkmann, G. Chapuis and H. Arend, Solid State Commun., 1978, 27, 901 CrossRef CAS.
- G. Chapuis and F. J. Zuniga, Acta Crystallogr., Sect. B: Struct. Crystallogr. Cryst. Chem., 1980, 36, 807 CrossRef.
- G. Chapuis and F. J. Zuniga, Acta Crystallogr., Sect. B: Struct. Sci., 1988, 44, 243 CrossRef.
- T. Fukumoto, K. Sano, S. Kashida and H. Kaga, J. Phys. Soc. Jpn., 1983, 52, 4213 CrossRef CAS.
- S. Kashida, K. Sano, T. Fukumoto, H. Kaga and M. Mori, J. Phys. Soc. Jpn., 1983, 52, 1255 CrossRef CAS.
- T. Fukumoto and S. Kashida, J. Phys. Soc. Jpn., 1985, 54, 3785 CrossRef CAS.
- S. Kashida and S. Sato, J. Phys. Soc. Jpn., 1985, 54, 2934 CrossRef CAS.
- S. Kashida, K. Sano, T. Fukumoto, H. Kaga and M. Mori, J. Phys. Soc. Jpn., 1985, 54, 211 CrossRef CAS.
- S. Kashida, Y. Ito and S. Sato, J. Solid State Chem., 1987, 69, 258 CrossRef CAS.
- K. Sano and S. Kashida, J. Phys. C: Solid State Phys., 1987, 20, 2985 CrossRef.
- H. Kchaou, A. Ben Rhaiem, K. Karoui, F. Jomni and K. Guidara, Appl. Phys. A, 2016, 122, 82 CrossRef.
- H. Kchaou, K. Karoui, A. Bulou and A. Ben Rhaiem, Phys. E, 2017, 88, 50 CrossRef CAS.
- H. Kchaou, K. Karoui and A. Ben Rhaiem, Phys. E, 2017, 85, 308 CrossRef CAS.
- G. Heidi, A Study of T1ρ Relaxation: From Relaxation Mechanisms to the Magnetic Resonance Imaging Contrast, Kuopio University printing, Finland, 2003 Search PubMed.
- A. Abragam, The Principles of Nuclear Magnetism, Oxford University press, 1961 Search PubMed.
- E. K. H. Salje, Ann. Rev. Mater. Res., 2012, 42, 265 CrossRef CAS.
- A. R. Lim and J. Cho, Sci. Rep., 2022, 12, 16901 CrossRef CAS PubMed.
- A. R. Lim, RSC Adv., 2021, 11, 37824 RSC.
- A. Bootchanont, S. Rujirawat, R. Yimnirun, R. Guo and A. Bhalla, Ceram. Int., 2016, 42, 8151 CrossRef CAS.
- M. Matsuki, T. Yamada, N. Yasuda, S. Dekura, H. Kitagawa and N. Kimizuka, J. Am. Chem. Soc., 2018, 140, 291 CrossRef CAS PubMed.
- X.-F. Zhou, A. R. Oganov, X. Dong, L. Zhang, Y. Tian and H.-T. Wang, Phys. Rev. B: Condens. Matter Mater. Phys., 2011, 84, 054543 CrossRef.
- A. K. Singh and A. K. Singh, Solid State Sci., 2012, 14, 100 CrossRef CAS.
- R. K. Harris, Nuclear Magnetic Resonance Spectroscopy, Pitman Pub, UK, 1983 Search PubMed.
- J. L. Koenig, Spectroscopy of Polymers, Elsevier, New York, 1999 Search PubMed.
- S. Sakida and Y. J. Kawamoto, J. Phys. Chem. Solids, 2002, 63, 151 CrossRef CAS.
- J. Sapriel, Phys. Rev. B: Solid State, 1975, 12, 5128 CrossRef CAS.
| This journal is © The Royal Society of Chemistry 2023 |

