 Open Access Article
Creative Commons Attribution 3.0 Unported Licence
Construction of highly-stable covalent organic framework with combined enol-imine and keto-enamine linkages†
Jian Jiang *a,
Kaiyu Hea,
Xue Caia,
Hong Yub,
Minghui Zuoa,
Guan Yuna,
Tao Yuna,
Yue Maa,
Zitong Zhanga,
Yunling Liu
 c and
Zhenlu Wang
 c
c
aHeilongjiang Key Laboratory of Photoelectric Functional Materials, College of Chemistry and Chemical Engineering, Mudanjiang Normal University, Mudanjiang 157011, P. R. China. E-mail: jianjiang@mdjnu.edu.cn
bState Key Laboratory of Photocatalysis on Energy and Environment, College of Chemistry, Fuzhou University, Fuzhou 350116, P. R. China
cCollege of Chemistry, Jilin University, 2519 Jiefang Road, Changchun 130021, P. R. China
First published on 15th May 2023
Abstract
A novel covalent organic framework (COF) (Tp-BI-COF) with combined ketimine-type enol-imine and keto-enamine linkages was prepared through a cascade of ketimine condensation followed by aldimine condensation and characterized by XRD, solid state 13C NMR, IR, TGA and BET. Tp-BI-COF showed high stability toward acid, organic solvent, and boiling water. The 2D COF exhibited photochromic properties after being irradiated with a xenon lamp. The stable COF, with aligned one-dimensional nanochannels, provided nitrogen sites on pore walls, which confine and stabilize the H3PO4 in the channel via hydrogen-bonding interactions. After loading with H3PO4, the material showed excellent anhydrous proton conductivity.
Introduction
Covalent organic frameworks (COFs) are porous crystalline polymers with well-defined frameworks and ordered pores,1 which can be constructed through covalent bonds among elements such as C, N, O, B and Si.2 The unique crystallinity of COFs is thought to be provided by the reversibility of covalent bonds formed during synthesis,3 for example, reversible formation of borate, borazine, imine, triazine, and hydrazone bonds resulting in a highly crystalline framework.4 The most attractive feature of COFs is that their structure, including the size and shape of the frameworks and pores, can be precisely controlled by changing their building blocks and linkages.5 In particular, 2D COFs integrate organic building blocks into covalent 2D sheets and frameworks to form periodic arrays and directional open nanochannels. To date, 2D COFs have emerged as powerful platforms for designing functional materials with catalytic,6 photoconductive,7 gas storage,8 charge transport9 and photovoltaic properties.10Due to the reversible reactions that occur after COFs are synthesized, in the presence of ambient humidity, COFs usually decompose.11 Therefore, the instability of covalent organic frameworks remains a difficult problem, preventing COFs from being widely used in various practical applications. Because of irreversible nature of keto-enamine linkage, it has been used to construct COFs with exceptional stability.4a As one of the most common products of Schiff-base condensation, ketimine has been proved to be much more kinetically inert than aldimine,12 which make it a good candidate to compose stable COFs. However, as far as we know, few COFs were constructed with ketimine as linkage in literature.
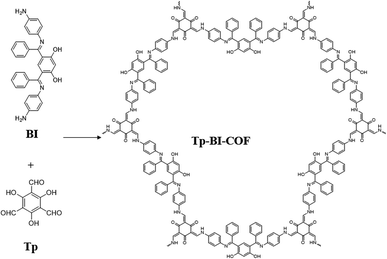
Here, we report the synthesis of a novel 2D COF with cloverleaf-shaped pore, Tp-BI-COF, through a cascade of ketimine condensation followed by aldimine condensation. The aldimine formed suffered irreversible enol-to-keto tautomerization to obtain keto-enamine linkage. Tp-BI-COF contains both keto-enamine and ketimine linkage, which give it excellent chemical and thermal stability (Fig. 1).
Experimental section
General
Unless stated otherwise all reagents were purchased from commercial source and used without purification. 1,3,5-Triformylphloroglucinol13 and 1,3-dihydroxy-4,6-dibenzoylbenzen14 (Tp) was synthesized according to literature methods. P-phenylenediamine was purified by sublimation before use.Measurements
X-ray powder diffraction (PXRD) patterns were recorded on a Rigaku Ultima IV-185 diffractometer using Cu Kα radiation (λ = 1.54056 Å) over the 2θ range of 1.8°–30° and on a SAXSess mc2 diffractometer using Cu Kα radiation (λ = 1.54056 Å) over the 2θ range of 0.5°–5°. The Shimadzu UV-2600 UV-Vis spectrophotometer, equipped with integration sphere ISR-2200, was used to measure the UV-Vis diffuse reflectance spectrum of solid powders at room temperature. FT-IR spectra were measured on a PerkinElmer Frontier infrared spectrometer FTIR-650 ranging from 4000 to 400 cm−1. The thermogravimetric analysis was performed on a Netzsch TG 209 F1 Libra thermogravimetric analyzer with a ramp rate of 10 K min−1 and a temperature of 35 to 800 °C under the atmosphere of nitrogen. Elemental analysis (C, H, O and N) was performed on a PerkinElmer 2400chn elemental analyzer. SEM images were obtained using a JSM-6480LV at 5.0 kV. FEI (Jeol FEG 2100F) high resolution transmission electron microscope (HRTEM) equipped with field emission source operating at 300 kV was used to record TEM images. The nitrogen adsorption and desorption isotherms were measured at 77 K using an Autosorb-iQ (Quantachrome) surface area size analyzer. Before measurement, the samples were degassed in vacuum at 100 °C for 10 h. The Brunauer–Emmett–Teller (BET) method was utilized to calculate the specific surface area. 1H and 13CNMR spectrum were measured on a Bruker Fourier 400 MHz spectrometer. Solid state cross polarization magic angle spinning (CP/MAS) NMR was taken on an AVIII 500 MHz solid-state NMR spectrometer. Mass spectra were obtained on the SolariX XR-15T FTMS Mass Spectrometry Facility. X-ray photoelectron spectroscopy (XPS) was measured on the Thermo ESCALAB 250XI instrument and the C 1s line at 284.8 eV was used as the binding energy reference.Preparation of triformylphloroglucinol (Tp)
Prepared as previously reported.13 To hexamethylenetetraamine (15.098 g, 108 mmol) and dried phloroglucinol (6.014 g, 49 mmol) was added 90 ml trifluoroacetic acid under N2. The solution was heated at 100 °C for ca. 2.5 h. Approximately 150 ml of 3 M HCl was added and the solution was heated at 100 °C for 1 h. After cooling to room temperature, the solution was filtered through Celite, extracted with ca. 600 ml dichloromethane, dried over magnesium sulfate, and filtered. Rotary evaporation of the solution afforded 1.25 g (11.82%) of an off-white powder. 1H NMR indicated near 99% purity; a pure sample was obtained by sublimation. 1H NMR (400 MHz, CDCl3): δ 14.11 (s, 3H), 10.15 (s, 3H) ppm. MP = 198–200 °C. ρ = 1.755 g cm−3. Solubility: CH2Cl2 (Slightly, Heated), DMSO (slightly, heated).Preparation of 1,3-dihydroxy-4,6-dibenzoylbenzen
Prepared as previously reported.14 Under N2, aluminium trichloride (5.734 g, 43 mmol) and dried dichloromethane (100 ml) were added to a 250 ml three-necked flask and stirred for 3 h. A solution of 1,3-dimethoxybenzene (2.5 ml, 19 mmol) and benzoyl chloride (5 ml, 43 mmol)) in dichloromethane (80 ml) was then slowly added dropwise to the stirred aluminium trichloride suspension. After the addition was complete, the reaction mixture was stirred at room temperature for 72 h. The resulting solution was then poured onto a mixture of crushed ice and concentrated hydrochloric acid (3![[thin space (1/6-em)]](https://www.rsc.org/images/entities/char_2009.gif) :
:![[thin space (1/6-em)]](https://www.rsc.org/images/entities/char_2009.gif) 1, 150 ml). The organic layer was separated and washed with an aqueous 5% KOH solution (6 × 100 ml). The base extracts were combined, neutralized with concentrated HCl, and extracted with dichloromethane (4 × 150 ml). The dichloromethane extracts were dried (MgSO4) and the solvent was removed under reduced pressure. The resulting 2 g (34.3%) crude product was recrystallized from methanol to give a white solid. 1H NMR (400 MHz, CDCl3): δ 6.63 (s, 1H), 7.25–7.60 (m, 10H), 8.01 (s, 1H), 12.88 (s, 2H) ppm. MP = 150 °C. ρ = 1.312 g cm−3. Solubility: CH2Cl2 (ultrasonic oscillation).
1, 150 ml). The organic layer was separated and washed with an aqueous 5% KOH solution (6 × 100 ml). The base extracts were combined, neutralized with concentrated HCl, and extracted with dichloromethane (4 × 150 ml). The dichloromethane extracts were dried (MgSO4) and the solvent was removed under reduced pressure. The resulting 2 g (34.3%) crude product was recrystallized from methanol to give a white solid. 1H NMR (400 MHz, CDCl3): δ 6.63 (s, 1H), 7.25–7.60 (m, 10H), 8.01 (s, 1H), 12.88 (s, 2H) ppm. MP = 150 °C. ρ = 1.312 g cm−3. Solubility: CH2Cl2 (ultrasonic oscillation).
Preparation of 4,6-bis((E)-((4-aminophenyl)imino)(phenyl)methyl)benzene-1,3-diol (BI)
A mixture of 1,3-dihydroxy-4,6-dibenzoylphenone (1.304 g, 4.1 mmol) and p-phenylenediamine (0.864 g, 8 mmol) was heated by heat gun (around 180 °C) in Schlenk tube under N2. The mixed solid turned to dark red liquid, and then the liquid became dry and red solid was obtained. Stop heating, and the crude product was sonicated in 10 ml methanol. After filtration, the solid was dried under vacuum at 60 °C to obtain 1.76 g (88.4%) of red powder. 1H NMR (400 MHz, DMSO-d6): δ (ppm) 10.30 (s, 2H), 7.22–7.03 (m, 10H), 6.62 (s, 1H), 6.47–6.30 (m, 8H), 6.28 (s, 1H), 5.06 (s, 4H). 13C NMR (100 MHz, DMSO-d6): δ (ppm) 169.36, 168.89, 147.02, 142.2, 137.82, 133.80, 133.37, 129.07, 128.72, 128.70, 124.64, 114.11, 112.62, 104.69. MALDI-FTICR MS (dithranol matrix) m/z = 499.3 (M + H)+. Anal. Calc'd for C32H26N4O2: C (77.09%), H (5.26%), N (11.24%); found: C (77.32%), H (5.12%), N (11.26%). MP = dec at 298 °C.Preparation of Tp-BI-COF
A hydrothermal synthesis reactor (20 ml) is charged with Tp (17.8 mg, 0.086 mmol), BI (64 mg, 0.129 mmol), 2 ml of mesitylene, 2 ml of dioxane, 0.4 ml of 3 M aqueous acetic acid. This mixture was sonicated for 30 minutes in order to get a homogenous dispersion. The reactor was sealed off and then heated at 120 °C for 3 days. Red precipitation formed was collected by centrifugation and washed with anhydrous tetrahydrofuran and acetone. The powder collected was then dried at 180 °C under vacuum for 24 hours to give 32.44 mg dark red powder in 42.04% isolated yield. Elemental analysis: calcd: C (75.82%), H (4.24%), N (9.31%); found: C (67.68%), H (5.267%), N (9.40%). The elemental analysis is often reported to be different from the expected values as a result of incomplete combustion, as has also been found in other reports of carbon-rich porous materials.15 Solid-state 13C NMR δ (ppm): 186.55, 184.02, 146.44, 135.36, 129.64, 120.63, 114.68, 106.72.Preparation of H3PO4@Tp-BI-COF
H3PO4@Tp-BI-COF was prepared according to a reported method. 16a Under N2, homogeneous solution of phosphoric acid crystal (148.63 mg) dissolved in anhydrous THF (2 ml) was injected into the Tp-BI-COF sample (50 mg) in a vial (20 ml) which was preheated under vacuum at 120 °C overnight to yield a solution which was stirred at room temperature for 3 h under N2. The system was slowly evaporated under vacuum to remove THF at 70 °C over a period of 6 h. The vial was then kept in an oven at 70 °C under N2 for 12 h. The resulting powder was collected to yield H3PO4@Tp-BI-COF quantitatively.Results and discussion
Characterization and properties of Tp-BI-COF
Powder X-ray diffraction (PXRD) pattern of Tp-BI-COF showed an intense peak at 2.1°, along with some other peaks with lower diffraction intensities, indicating long-range molecular ordering. In order to elucidate the structure of the COF, models were constructed with Materials studio software package. Two possible overlaps, eclipsed model with AA stacking and staggered model with AB stacking, were evaluated and universal force-field in the forcite module was used to minimize the geometrical energy. The experimentally obtained PXRD pattern is in good agreement with the simulated pattern of eclipsed model (Fig. 2a). As shown in Fig. 2b, according to the simulations, the layer sheet of the COF exhibits fluctuation and flexibility, which is caused by the nonplanar geometry of building block BI (Fig. S2†) and sp3 nitrogen node in keto-enamine moiety. To find out the unit cell parameters, Pawley refinement was performed, giving the values a = 38.13004 Å, b = 37.63950 Å, c = 4.25724 Å for Tp-BI-COF.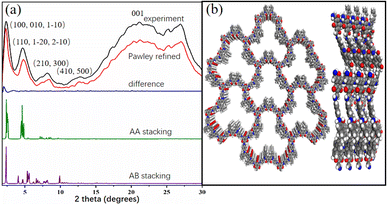 | ||
| Fig. 2 (a) PXRD patten of Tp-BI-COF. (b) Top and side view of structure of Tp-BI-COF with AA stacking with seven pores and four layers. | ||
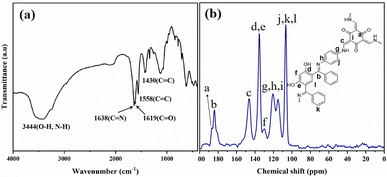
The FT-IR spectrum of Tp-BI-COF showed a broad absorption peak appeared at 3444 cm−1 arising from stretching vibration of –OH (resorcinol) and –NH– present in the keto form. Peaks assigned to both carbonyl and imine groups were also appeared in IR spectrum at 1619 cm−1 and 1638 cm−1, respectively. Stretching vibration peak of conjugated C![[double bond, length as m-dash]](https://www.rsc.org/images/entities/char_e001.gif) C appeared at 1558 cm−1 proved the tautomerism (Fig. 3a). Thus, both enol-imine and keto-enamine moieties are present in the structure of Tp-BI-COF.
C appeared at 1558 cm−1 proved the tautomerism (Fig. 3a). Thus, both enol-imine and keto-enamine moieties are present in the structure of Tp-BI-COF.
Structure of Tp-BI-COF was further demonstrated by 13C cross-polarization magic-angle-spinning (CP-MAS) solid-state NMR spectroscopy (Fig. 3b). The spectrum exhibited a resonance signal at 184.02 ppm, which was assigned to the C![[double bond, length as m-dash]](https://www.rsc.org/images/entities/char_e001.gif) N bond, and a shoulder peak at 186.55 ppm corresponding to the carbonyl carbon in keto-enamine moiety.
N bond, and a shoulder peak at 186.55 ppm corresponding to the carbonyl carbon in keto-enamine moiety.
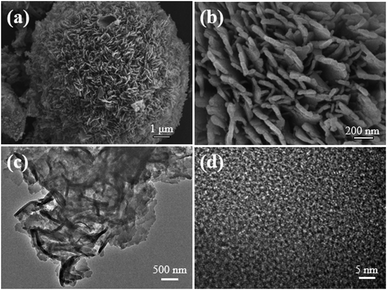
Scanning electron microscopy (SEM) images (Fig. 4a and b and S8†) showed that the sample was mainly composed of spherical clusters of about 10–20 μm in diameter. A close view revealed that each of the clusters was stacked by an aggregation of a large number of flakes with widths in 30–50nm. Transmission electron microscopy (TEM) images also suggested the cluster of sheet-like flakes (Fig. 4c and S9†).
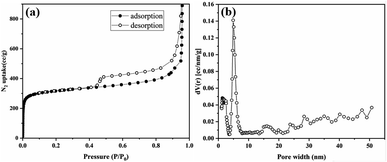
Thermogravimetric analysis (TGA) was performed to determine its thermal stability and confirm the absence of guest molecules in the pores (Fig. S17†). Tp-BI-COF showed thermal stability up to 460 °C. Gradual weight losses of 30% for Tp-BI-COF was observed above 460 °C, corresponding to decomposition of the framework. The permanent porosity of Tp-BI-COF was evaluated by measuring the N2 adsorption isotherm at 77 K. The Brunauer–Emmett–Teller (BET) surface area of Tp-BI-COF was found to be 1018 m2 g−1. Tp-BI-COF showed a hybrid of type-I and type-IV adsorption isotherm (Fig. 5a). It featured a sharp adsorption of nitrogen into the pores at low relative pressures (P/P0 < 0.01), and hysteresis loop at higher relative pressure (P/P0 > 0.43), which is characteristic of both microporous and mesoporous nature of the material. The pore size distribution of Tp-BI-COF calculated using the nonlocal density functional theory (NLDFT) method (equilibrium model on silica), revealed the presence of 4.9 nm-sized pores (Fig. 5b), which is close to that of the lattice size (4.4 nm). Moreover, the micropores, less than 2 nm, were likely derived from interstitial spaces between flexible layers.
Chemical stability was checked by immersing Tp-BI-COF sample in THF, CH2Cl2, boiling water, aqueous HCl (9 M), H3PO4/THF solution (0.7 M). After 7 days, PXRD showed that Tp-BI-COF retained its crystallinity, as evidenced by unchanged peak positions and full width at half maximum (Fig. S19†). Nitrogen adsorption measurements indicated that the porosity of the immersed COF samples was preserved under these conditions (Fig. S20†). Stability in NaOH showed retention of PXRD peak positions and nearly unchanged surface area after treatment with 9 M NaOH for 1 day, and loss of PXRD peaks and decrease of surface area after treatment with 9 M NaOH for 2 days (Fig. S21 and S22†).
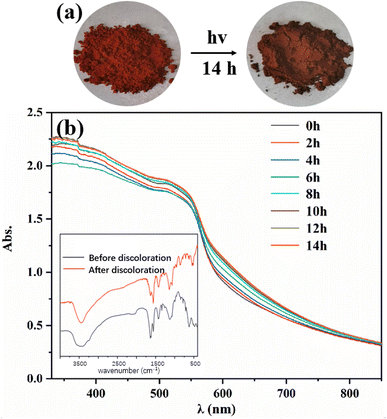
The photochromic property of Tp-BI-COF was investigated, and a color-change, from red to dark red, was observed after being irradiated with a 300 W xenon lamp for 14 h at room temperature (Fig. 6). It was found by UV-Vis diffuse reflectance spectroscopy that after discoloration, a new absorption band appeared at 580–750 nm. The FT-IR spectra of Tp-BI-COF remained almost same before and after discoloration, except the relative intensity of peaks at 1638 cm−1 and 1558 cm−1, which were assigned to stretching vibration of C![[double bond, length as m-dash]](https://www.rsc.org/images/entities/char_e001.gif) N and C
N and C![[double bond, length as m-dash]](https://www.rsc.org/images/entities/char_e001.gif) C bonds, respectively. The PXRD pattern and BET surface area of sample which was irradiated for 14 h are similar to that of unirradiated one (Fig. S14 and S15†), indicating skeleton was retained. The mechanism of photochromism of Tp-BI-COF is still under study.
C bonds, respectively. The PXRD pattern and BET surface area of sample which was irradiated for 14 h are similar to that of unirradiated one (Fig. S14 and S15†), indicating skeleton was retained. The mechanism of photochromism of Tp-BI-COF is still under study.
Characterization and properties of H3PO4@Tp-BI-COF
Anhydrous proton conduction, which enables high temperature proton transport based on pure H3PO4, requires high stability of porous material and proton network.16 Because one macrocycle of Tp-BI-COF contains twelve inward Nin from C![[double bond, length as m-dash]](https://www.rsc.org/images/entities/char_e001.gif) N and C–N units, which enables anchoring and stabilizing H3PO4 network on pore walls in aligned channels, the stable Tp-BI-COF was expected to provide freeway for proton flow. In order to loaded pure H3PO4 crystal into the channels of framework, H3PO4@Tp-BI-COF was prepared via vacuum impregnation method.16a The generated H3PO4@Tp-BI-COF sample showed negligible porosity (Fig. S12†), indicating that the pores of Tp-BI-COF were filled with H3PO4. From the density of pure H3PO4 (1.834 g cm−3) and the pore volume of Tp-BI-COF (1.62 cm3 g−1), the maximum H3PO4 loading was calculated as 74.8 wt%. New peaks at 969 and 510 cm−1 present in FT-IR spectrum of the composite, which were attributed to P
N and C–N units, which enables anchoring and stabilizing H3PO4 network on pore walls in aligned channels, the stable Tp-BI-COF was expected to provide freeway for proton flow. In order to loaded pure H3PO4 crystal into the channels of framework, H3PO4@Tp-BI-COF was prepared via vacuum impregnation method.16a The generated H3PO4@Tp-BI-COF sample showed negligible porosity (Fig. S12†), indicating that the pores of Tp-BI-COF were filled with H3PO4. From the density of pure H3PO4 (1.834 g cm−3) and the pore volume of Tp-BI-COF (1.62 cm3 g−1), the maximum H3PO4 loading was calculated as 74.8 wt%. New peaks at 969 and 510 cm−1 present in FT-IR spectrum of the composite, which were attributed to P![[double bond, length as m-dash]](https://www.rsc.org/images/entities/char_e001.gif) O bond, demonstrated the formation of H3PO4@Tp-BI-COF (Fig. S7†). The EDS mapping indicated the homogeneously distribution of P element throughout H3PO4@Tp-BI-COF (Fig. S25†). The vibrational band of the C
O bond, demonstrated the formation of H3PO4@Tp-BI-COF (Fig. S7†). The EDS mapping indicated the homogeneously distribution of P element throughout H3PO4@Tp-BI-COF (Fig. S25†). The vibrational band of the C![[double bond, length as m-dash]](https://www.rsc.org/images/entities/char_e001.gif) N bond shifted to 1688 cm−1, indicating the N atom of the C
N bond shifted to 1688 cm−1, indicating the N atom of the C![[double bond, length as m-dash]](https://www.rsc.org/images/entities/char_e001.gif) N bond interacted with H3PO4.16 Interaction between H3PO4 and Tp-BI-COF was studied by X-ray photoelectron spectroscopy (XPS) (Fig. 7 and S27†). The binding energies of the C 1s spectrum of Tp-BI-COF were observed at 284.6, 285.7 and 288.35 eV, which were attributed to the C
N bond interacted with H3PO4.16 Interaction between H3PO4 and Tp-BI-COF was studied by X-ray photoelectron spectroscopy (XPS) (Fig. 7 and S27†). The binding energies of the C 1s spectrum of Tp-BI-COF were observed at 284.6, 285.7 and 288.35 eV, which were attributed to the C![[double bond, length as m-dash]](https://www.rsc.org/images/entities/char_e001.gif) C, C
C, C![[double bond, length as m-dash]](https://www.rsc.org/images/entities/char_e001.gif) N and C
N and C![[double bond, length as m-dash]](https://www.rsc.org/images/entities/char_e001.gif) O bonds in the COF. The shift of the second peak from 285.7 to 285.97 eV for H3PO4@Tp-BI-COF was attributed to the ionization of the imine C
O bonds in the COF. The shift of the second peak from 285.7 to 285.97 eV for H3PO4@Tp-BI-COF was attributed to the ionization of the imine C![[double bond, length as m-dash]](https://www.rsc.org/images/entities/char_e001.gif) N bond to the iminium cation (C
N bond to the iminium cation (C![[double bond, length as m-dash]](https://www.rsc.org/images/entities/char_e001.gif) NH+).17 Two peaks at 399.54 and 400.1 eV appeared in high-resolution N 1s spectrum of Tp-BI-COF, which were assigned to the N atoms of the C–N bond and imine C
NH+).17 Two peaks at 399.54 and 400.1 eV appeared in high-resolution N 1s spectrum of Tp-BI-COF, which were assigned to the N atoms of the C–N bond and imine C![[double bond, length as m-dash]](https://www.rsc.org/images/entities/char_e001.gif) N bond, shifted to 400.27 eV and 402.1 eV for H3PO4@Tp-BI-COF, respectively, reflecting N atoms in both C–N and C
N bond, shifted to 400.27 eV and 402.1 eV for H3PO4@Tp-BI-COF, respectively, reflecting N atoms in both C–N and C![[double bond, length as m-dash]](https://www.rsc.org/images/entities/char_e001.gif) N bonds interacted with H3PO4. In the P 2p XPS spectrum of H3PO4@Tp-BI-COF, two peaks were observed at 134.2 and 135.0 eV, which were assigned to the phosphorus atoms of H2PO4− and H3PO4, respectively. Based on FT-IR and XPS data, we suggest both N atoms in C–N and C
N bonds interacted with H3PO4. In the P 2p XPS spectrum of H3PO4@Tp-BI-COF, two peaks were observed at 134.2 and 135.0 eV, which were assigned to the phosphorus atoms of H2PO4− and H3PO4, respectively. Based on FT-IR and XPS data, we suggest both N atoms in C–N and C![[double bond, length as m-dash]](https://www.rsc.org/images/entities/char_e001.gif) N bond on the pore walls are protonated by H3PO4 (Fig. S16†), and H3PO4 network in the channel is restricted and stabilized through hydrogen bond.
N bond on the pore walls are protonated by H3PO4 (Fig. S16†), and H3PO4 network in the channel is restricted and stabilized through hydrogen bond.
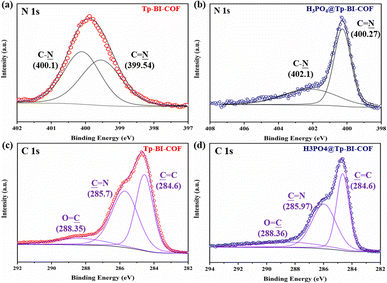 | ||
| Fig. 7 High-resolution XPS spectra of the (a) N 1s band of Tp-BI-COF, (b) N 1s band of H3PO4@Tp-BI-COF, (c) C 1s band of Tp-BI-COF, and (d) C 1s band of H3PO4@Tp-BI-COF. | ||
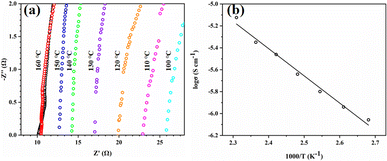
Tp-BI-COF is an insulator (conductivity = 4.8 × 10⁻⁹ S cm−1 at 160 °C), which makes it suitable for proton-conducting study. Proton conductivity of pellet of H3PO4@Tp-BI-COF, which was prepared at a pressure of 200 kN under nitrogen for 30 min, was measured by alternating-current impedance spectroscopy under anhydrous conditions under nitrogen at varying temperatures from 100 to 160 °C. The proton conductivities were calculated to be 2.34 × 10⁻³, 2.63 × 10⁻³, 3.03 × 10⁻³, 3.55 × 10⁻³, 4.25 × 10⁻³, 4.75 × 10⁻³, and 5.95 × 10⁻³ S cm−1 at 100 °C, 110 °C, 120 °C, 130 °C, 140 °C, 150 °C, and 160 °C, respectively (Fig. 8a). Under anhydrous conditions, the proton flow is on the same order of magnitude as other similar COFs (Table S3†). We tested the long-term stability of H3PO4@Tp-BI-COF at 160 °C for 120 h and observed that the proton conductivity almost remained at the same value as its initial value (Fig. S28†), and PXRD of sample after long-term test retained unchanged as well (Fig. S23†). As shown in Fig. 8b, an Arrhenius-type linear curve is derived. According to the slope of the curve, the activation energy was estimated to be 0.21 eV. These results suggest that Tp-BI-COF can give a way to design well-defined porous material for anhydrous proton conduction.
Conclusions
In summary, a crystalline COF with both ketimine-type enol-imine and keto-enamine tautomeric linkages is introduced for the first time. The porous framework is thermally and chemically stable. The material shows photochromic property and stable anhydrous proton conduction over a wide temperature range above 100 °C. This work provides further aid to the fields of photochromism and anhydrous proton conduction.Conflicts of interest
There are no conflicts to declare.Acknowledgements
This work was supported by Basic Research Fund of the Department of Education of Heilongjiang Province (No. 1353MSYQN005), Key Project of Department of Education of Heilongjiang Province (No. 1355ZD003), the Education Research Fund for Department of Heilongjiang Province (No. 1352DZ001) and the Scientific Group Research Project of Mudanjiang Normal University (No. 1451T001).Notes and references
-
(a) X. Chen, K. Geng, R. Liu, K. T. Tan, Y. Gong, Z. Li, S. Tao, Q. Jiang and D. Jiang, Angew. Chem., Int. Ed., 2020, 59, 5050 CrossRef CAS PubMed
; (b) S. Chandra, T. Kundu, S. Kandambeth, R. Babarao, Y. Marathe, S. M. Kunjir and R. Banerjee, J. Am. Chem. Soc., 2014, 136, 6570 CrossRef CAS PubMed
.
-
(a) A. P. Cote, A. I. Benin, N. W. Ockwig, M. O'Keeffe, A. J. Matzger and O. M. Yaghi, Science, 2005, 310, 1166 CrossRef CAS PubMed
; (b) J. R. Hunt, C. J. Doonan, J. D. LeVangie, A. P. Cote and O. M. Yaghi, J. Am. Chem. Soc., 2008, 130, 11872 CrossRef CAS PubMed
; (c) J. F. Dienstmaier, D. D. Medina, M. Dogru, P. Knochel, T. Bein, W. M. Heckl and M. Lackinger, ACS Nano, 2012, 6, 7234 CrossRef CAS PubMed
; (d) P. Kuhn, M. Antonietti and A. Thomas, Angew. Chem., Int. Ed., 2008, 47, 3450 CrossRef CAS PubMed
.
- X. Feng, X. Ding and D. Jiang, Chem. Soc. Rev., 2012, 41, 6010 RSC
.
-
(a) S. Kandambeth, A. Mallick, B. Lukose, M. V. Mane, T. Heine and R. Banerjee, J. Am. Chem. Soc., 2012, 134, 19524 CrossRef CAS PubMed
; (b) Y. Zeng, R. Zou and Y. Zhao, Adv. Mater., 2016, 28, 2855 CrossRef CAS PubMed
; (c) P. J. Waller, F. Gandara and O. M. Yaghi, Acc. Chem. Res., 2015, 48, 3053 CrossRef CAS PubMed
; (d) F. K. Shieh, S. C. Wang, C. I. Yen, C. C. Wu, S. Dutta, L. Y. Chou, J. V. Morabito, P. Hu, M. H. Hsu, K. C. Wu and C. K. Tsung, J. Am. Chem. Soc., 2015, 137, 4276 CrossRef CAS PubMed
.
-
(a) T. Y. Zhou, S. Q. Xu, Q. Wen, Z. F. Pang and X. Zhao, J. Am. Chem. Soc., 2014, 136, 15885 CrossRef CAS PubMed
; (b) Z. F. Pang, S. Q. Xu, T. Y. Zhou, R. R. Liang, T. G. Zhan and X. Zhao, J. Am. Chem. Soc., 2016, 138, 4710 CrossRef CAS PubMed
.
-
(a) W. Zhang, P. Jiang, Y. Wang, J. Zhang, Y. Gao and P. Zhang, RSC Adv., 2014, 4, 51544 RSC
; (b) Q. Fang, S. Gu, J. Zheng, Z. Zhuang, S. Qiu and Y. Yan, Angew. Chem., Int. Ed., 2014, 53, 2878 CrossRef CAS PubMed
; (c) S. Lin, C. S. Diercks, Y. B. Zhang, N. Kornienko, E. M. Nichols, Y. Zhao, A. R. Paris, D. Kim, P. Yang, O. M. Yaghi and C. J. Chang, Science, 2015, 349, 1208 CrossRef CAS PubMed
.
-
(a) S. Wan, J. Guo, J. Kim, H. Ihee and D. Jiang, Angew. Chem., Int. Ed., 2008, 47, 8826 CrossRef CAS PubMed
; (b) S. Dalapati, S. Jin, J. Gao, Y. Xu, A. Nagai and D. Jiang, J. Am. Chem. Soc., 2013, 135, 17310 CrossRef CAS PubMed
; (c) X. Feng, L. Liu, Y. Honsho, A. Saeki, S. Seki, S. Irle, Y. Dong, A. Nagai and D. Jiang, Angew. Chem., Int. Ed., 2012, 51, 2618 CrossRef CAS PubMed
; (d) M. Dogru, M. Handloser, F. Auras, T. Kunz, D. Medina, A. Hartschuh, P. Knochel and T. Bein, Angew. Chem., Int. Ed., 2013, 52, 2920 CrossRef CAS PubMed
.
-
(a) C. J. Doonan, D. J. Tranchemontagne, T. G. Glover, J. R. Hunt and O. M. Yaghi, Nat. Chem., 2010, 2, 235 CrossRef CAS PubMed
; (b) J. R. Song, J. Sun, J. Liu, Z. T. Huang and Q. Y. Zheng, Chem. Commun., 2014, 50, 788 RSC
; (c) H. Wei, S. Chai, N. Hu, Z. Yang, L. Wei and L. Wang, Chem. Commun., 2015, 51, 12178 RSC
.
-
(a) S. Wan, F. Gándara, A. Asano, H. Furukawa, A. Saeki, S. K. Dey, L. Liao, M. W. Ambrogio, Y. Y. Botros, X. Duan, S. Seki, J. F. Stoddart and O. M. Yaghi, Chem. Mater., 2011, 23, 4094 CrossRef CAS
; (b) X. Feng, L. Chen, Y. Honsho, O. Saengsawang, L. Liu, L. Wang, A. Saeki, S. Irle, S. Seki, Y. Dong and D. Jiang, Adv. Mater., 2012, 24, 3026 CrossRef CAS PubMed
.
- J. Guo, Y. Xu, S. Jin, L. Chen, T. Kaji, Y. Honsho, M. A. Addicoat, J. Kim, A. Saeki, H. Ihee, S. Seki, S. Irle, M. Hiramoto, J. Gao and D. Jiang, Nat. Commun., 2013, 4, 2736 CrossRef PubMed
.
-
(a) Y. Du, K. Mao, P. Kamakoti, P. Ravikovitch, C. Paur, S. Cundy, Q. Li and D. Calabro, Chem. Commun., 2012, 48, 4606 RSC
; (b) L. M. Lanni, R. W. Tilford, M. Bharathy and J. J. Lavigne, J. Am. Chem. Soc., 2011, 133, 13975 CrossRef CAS PubMed
.
- P. D. Frischmann, J. Jiang, J. K.-H. Hui, J. J. Grzybowski and M. J. MacLachlan, Org. Lett., 2008, 10, 1255 CrossRef CAS PubMed
.
- J. H. Chong, M. Sauer, B. O. Patrick and M. J. MacLachlan, Org. Lett., 2003, 5, 3823 CrossRef PubMed
.
- M. Abdul-Aziz, J. V. Auping and M. A. Meador, J. Org. Chem., 1995, 60, 1303 CrossRef CAS
.
-
(a) Y. Zhu, H. Yang, Y. Jin and W. Zhang, Chem. Mater., 2013, 25, 3718 CrossRef CAS
; (b) W. Lu, D. Yuan, D. Zhao, C. I. Schilling, O. Plietzsch, T. Muller, S. Brase, J. Guenther, J. Blümel, R. Krishna, Z. Li and H. C. Zhou, Chem. Mater., 2010, 22, 5964 CrossRef CAS
; (c) J. X. Jiang, F. Su, A. Trewin, C. D. Wood, N. L. Campbell, H. Niu, C. Dickinson, A. Y. Ganin, M. J. Rosseinsky, Y. Z. Khimyak and A. I. Cooper, Angew. Chem., Int. Ed., 2007, 46, 8574 CrossRef CAS PubMed
.
-
(a) S. Tao, L. Zhai, A. D. Dinga Wonanke, M. A. Addicoat, Q. Jiang and D. Jiang, Nat. Commun., 2020, 11, 1981 CrossRef CAS PubMed
; (b) J. Li, J. Wang, Z. Wu, S. Tao and D. Jiang, Angew. Chem., Int. Ed., 2021, 60, 2 CrossRef
.
- U. S. Waware, R. Arukula, A. M. S. Hamouda and P. Kasak, Ionics, 2019, 26, 831 CrossRef
.
Footnote |
| † Electronic supplementary information (ESI) available. See DOI: https://doi.org/10.1039/d3ra02251j |
| This journal is © The Royal Society of Chemistry 2023 |

